
In April 2018,
GBPUSD was reaching the end of a big bear-market rally, and the price reached above 1.4300 for the first time in 2 years.
The wave count that I was working with was looking for a top to form as part of a 4th wave correction.
You can read that post here.
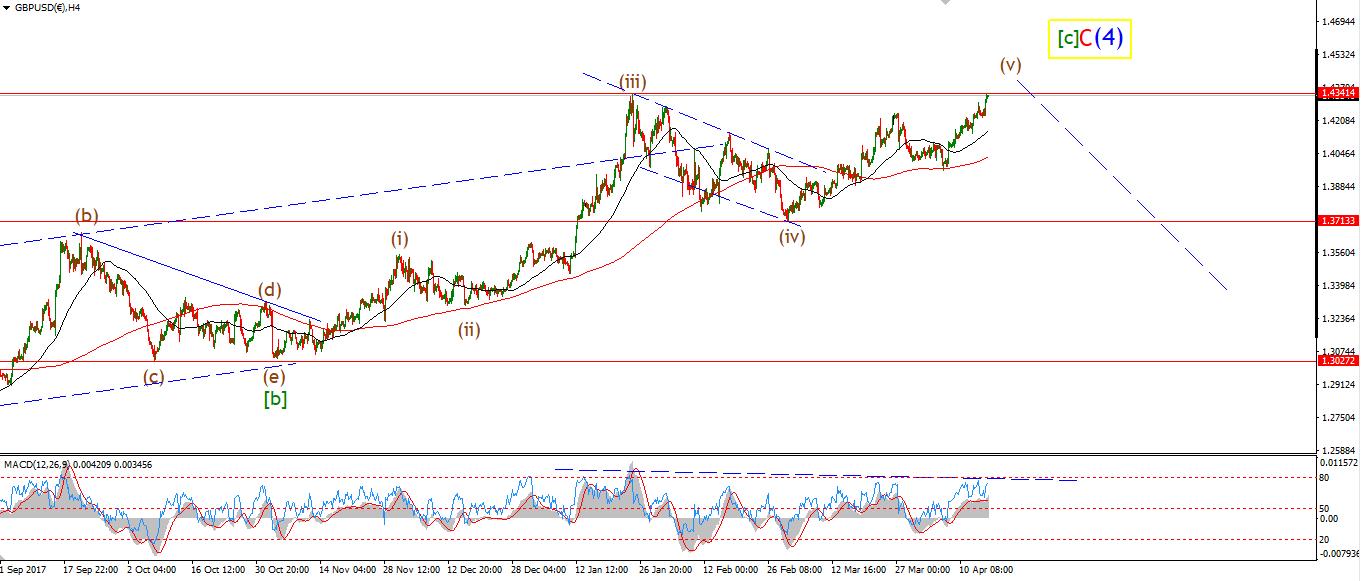
And as April rolled on, the price looked like it was forming a top in wave ‘C’ of (4) as shown on the 4hr chart below.
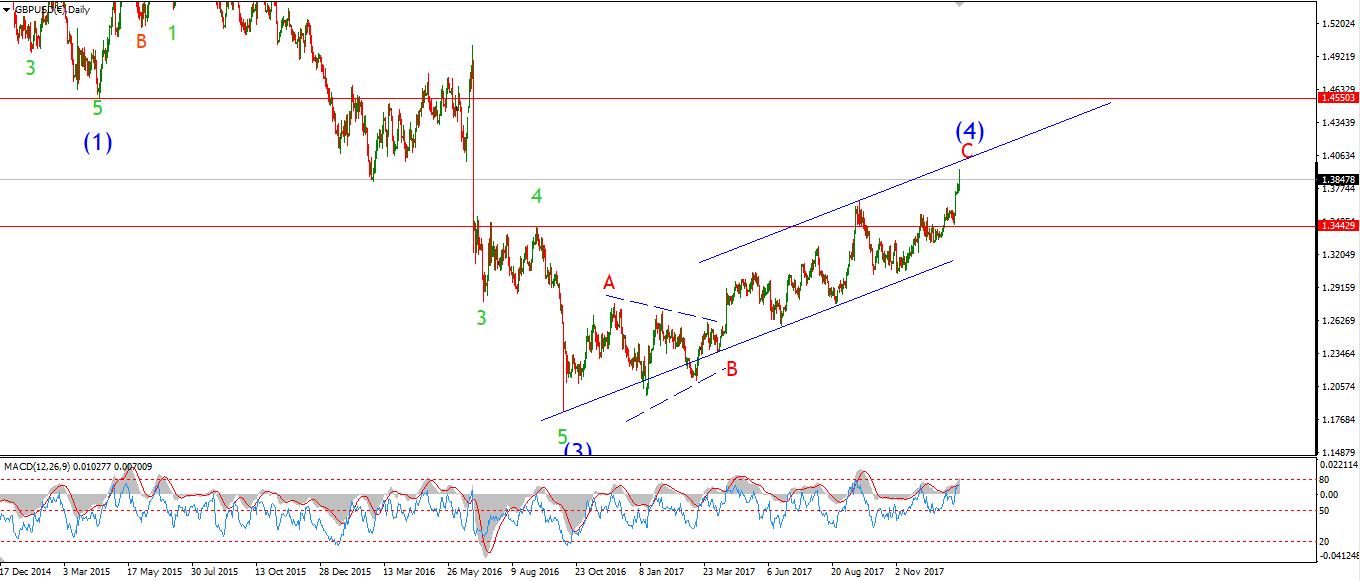
The daily chart shows the big picture wave structure.
This market was days away from a significant turning point.
On April 16th, I wrote:
From this point on I think the upside is very limited in cable.
The two trend channels intersect at 1.4388.
On the 4hr chart
we can see that wave (v) has already surpassed equality with wave (i) brown.
Momentum has topped out and is beginning to diverge downwards.
The price will not be far behind.Tomorrow;
If the price reaches 1.4388 and backs off in an impulsive fashion,
That will be our first signal that the rally may be complete.
The Top tick for wave (4) came one day later on April 17th at 1.4380.
And from that point on Cable has been dropping into a new bear-market leg down.
Here’s the chart showing the decline into wave (5):
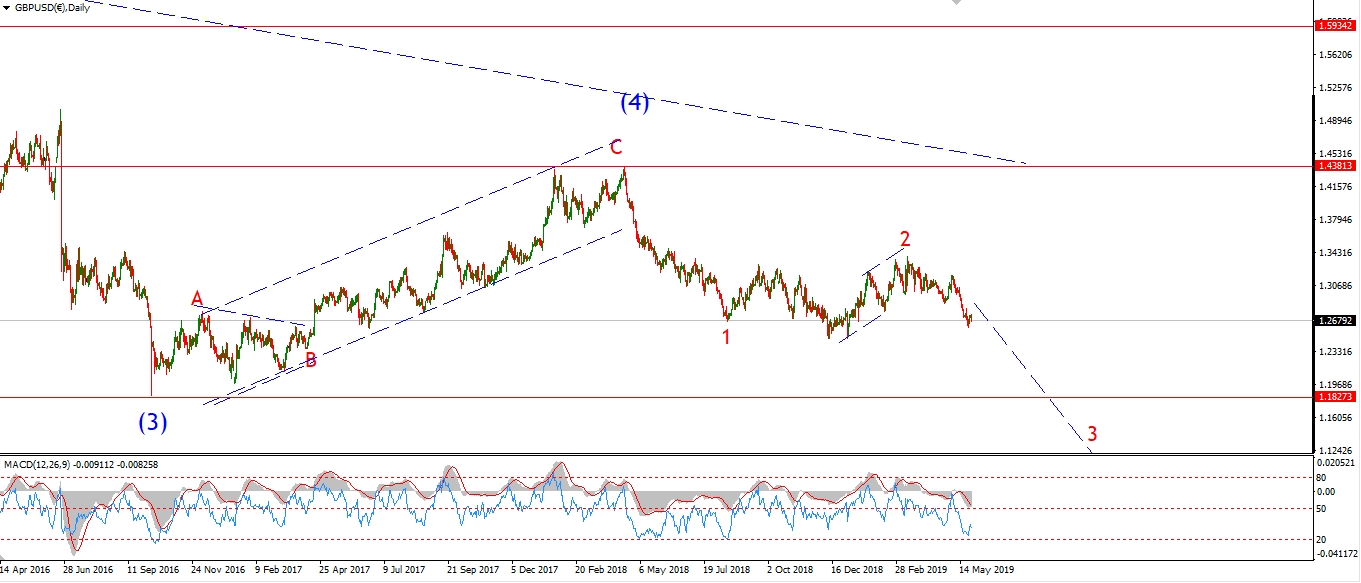
GBPUSD has declined 1700 points so far off the wave (4) high.
And according to the current wave count, this decline is not over.
If you want to stay ahead of major market moves like this one in GBPUSD.
Then you need to read my nightly Elliott wave analysis.
[vc_row][vc_column][vc_separator border_width=”5″][/vc_column][/vc_row]
Don’t miss the next big move
in the the GBPUSD!
Join Bullwaves.org now.
[vc_row][vc_column][vc_separator border_width=”5″][/vc_column][/vc_row]
[vc_row][vc_column][vc_column_text]
Monthly Membership.
24.99
Nightly Charts + Analysis.
Weekly Video Analysis.
Critical turning points.
Price Projections.
[vc_row][vc_column][vc_separator border_width=”5″][/vc_column][/vc_row]