
[vc_row][vc_column][vc_separator border_width=”5″][/vc_column][/vc_row]
[vc_row][vc_column][vc_column_text]
Good evening folks.
Welcome back.
There are a multitude of market warning signals flashing red right now.
Here is just another to add to the pile!
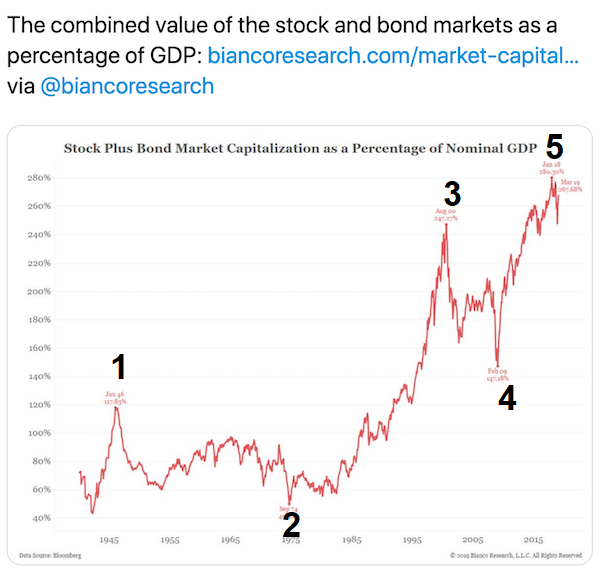
The above chart shows the total financial market value, stocks +bonds, as a % of GDP from 1940 to present.
I came across this today and the very first thing I saw, was a perfect five wave pattern off the lows into this years highs.
The corrections even happened in three waves!
It never ceases to amaze me the amount of places where the five wave pattern will occur.
The point being,
We are at a top in total financial market valuation.
We can take this weeks news of another multi billion $ loss making unicorn going public as a clear sign we are at the top.
Massive losses that would cripple any normal company are viewed as a strength in the unicorn world!
So,
How do the stock market and Bond market look right now?
[vc_row][vc_column][vc_separator border_width=”5″][/vc_column][/vc_row][vc_row][vc_column][vc_column_text]
US 10 yr Treasuries.
[/vc_column_text][/vc_column][/vc_row][vc_row][vc_column][vc_separator border_width=”5″][/vc_column][/vc_row][vc_row][vc_column width=”2/3″][vc_custom_heading text=”1 hr” use_theme_fonts=”yes”][vc_column_text]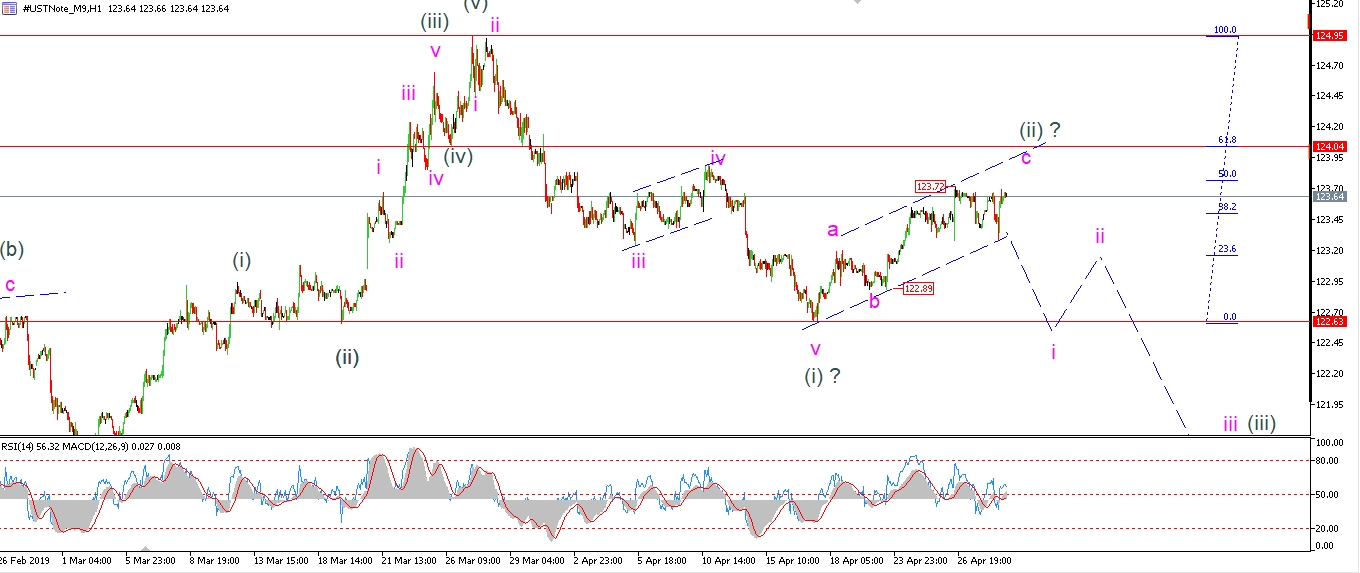 [/vc_column_text][/vc_column][vc_column width=”1/3″][vc_custom_heading text=”4 Hours” use_theme_fonts=”yes”][vc_column_text]
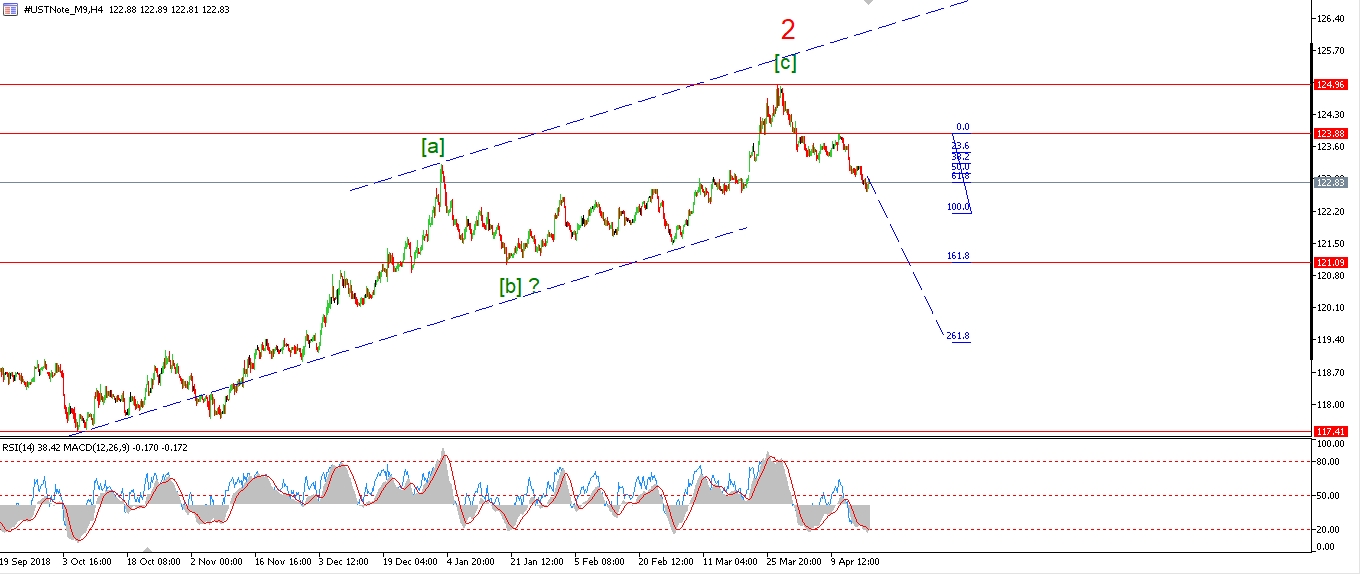 [/vc_column_text][vc_custom_heading text=”Daily” use_theme_fonts=”yes”][vc_column_text]
 [/vc_column_text][/vc_column][/vc_row]
[vc_row][vc_column][vc_column_text]
It seems that wave ‘c’ of (ii) is going to push to a new high above 123.72.
Teh choppy action over the last few days traced out a three wave decline,
before the price rallied again today.
The 62% retracement of wave (i) lies at 124.04.
This is the next likely target for wave (ii) to complete.
Tomorrow;
watch for this bearish signal to complete finally in wave (ii).
A sharp turn down off wave (ii) will signal that wave (iii) has begun.
[/vc_column_text][/vc_column][/vc_row]
[vc_row][vc_column][vc_separator border_width=”5″][/vc_column][/vc_row][vc_row][vc_column][vc_column_text]
S&P 500.
[/vc_column_text][/vc_column][/vc_row][vc_row][vc_column][vc_separator border_width=”5″][/vc_column][/vc_row][vc_row][vc_column width=”2/3″][vc_custom_heading text=”1 hr” use_theme_fonts=”yes”][vc_column_text]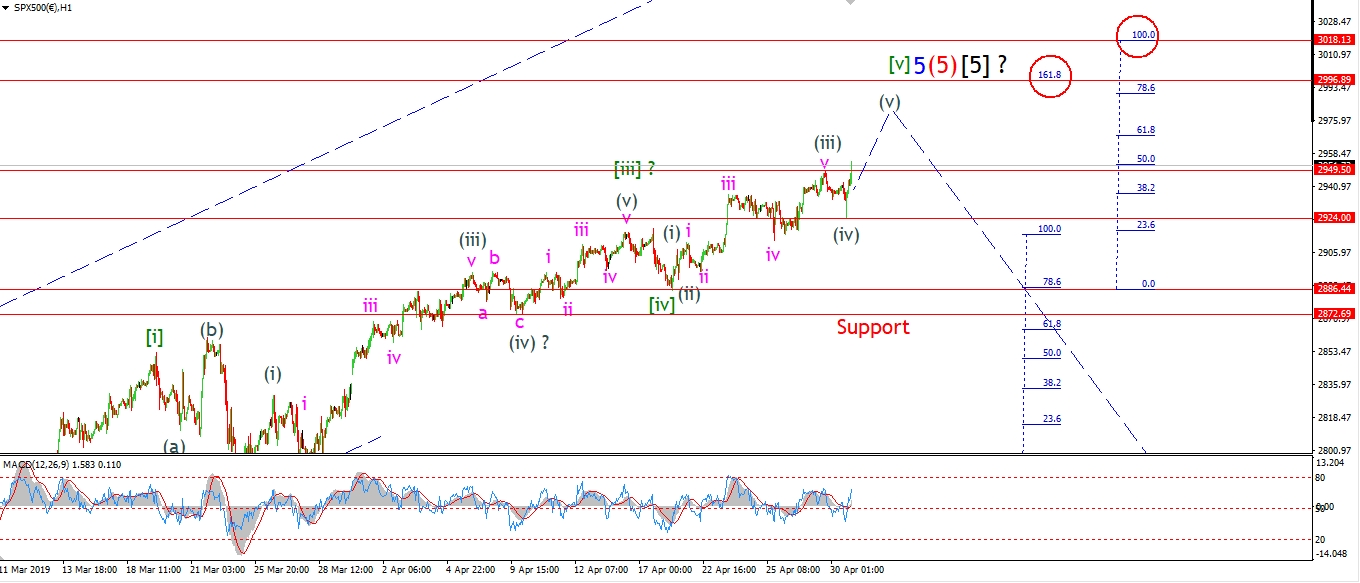 [/vc_column_text][/vc_column][vc_column width=”1/3″][vc_custom_heading text=”4 Hours” use_theme_fonts=”yes”][vc_column_text]
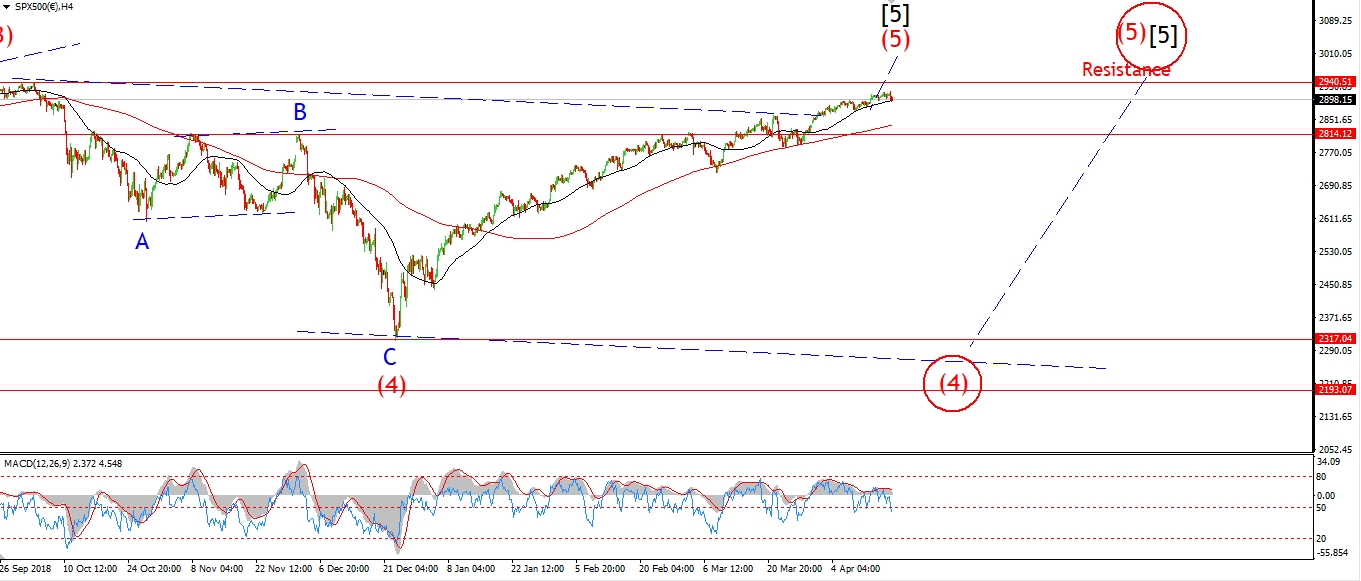 [/vc_column_text][vc_custom_heading text=”Daily” use_theme_fonts=”yes”][vc_column_text]
 [/vc_column_text][/vc_column][/vc_row]
[vc_row][vc_column][vc_column_text]
The choppy pattern that has developed in the S&P over the last few sessions
lends itself to a series of fourth wave corrections.
This is now shown on the short term chart as wave ‘iv’ of (iii) on last Thursdays low.
And then todays low at wave (iv) of [v].
The market is rallying again this evening and this should begin wave (v) of [v].
And this rally in wave [v] may well be the last rally for a while.
Tomorrow;
Wave (v) is likely to trace out a five wave structure itself over the coming days.
the Fibonacci target at 2996 is still possible.
Watch for 2924 to hold and a push back up towards the 2996 level to complete wave [v] green.
[/vc_column_text][/vc_column][/vc_row]
[vc_row][vc_column][vc_separator border_width=”5″][/vc_column][/vc_row]
IF You want nightly Elliott Wave Updates,
Check out Bullwaves Membership.
And stay ahead of the next BIG market move!
[vc_row][vc_column][vc_column_text]
[/vc_column_text][/vc_column][/vc_row]
[vc_row][vc_column][vc_separator border_width=”5″][/vc_column][/vc_row]