
[vc_row][vc_column][vc_separator border_width=”5″][/vc_column][/vc_row]
Back in August 2017 I released this chart to support my very bullish outlook for GOLD.
It involves a long term corrective low in wave ‘2’.
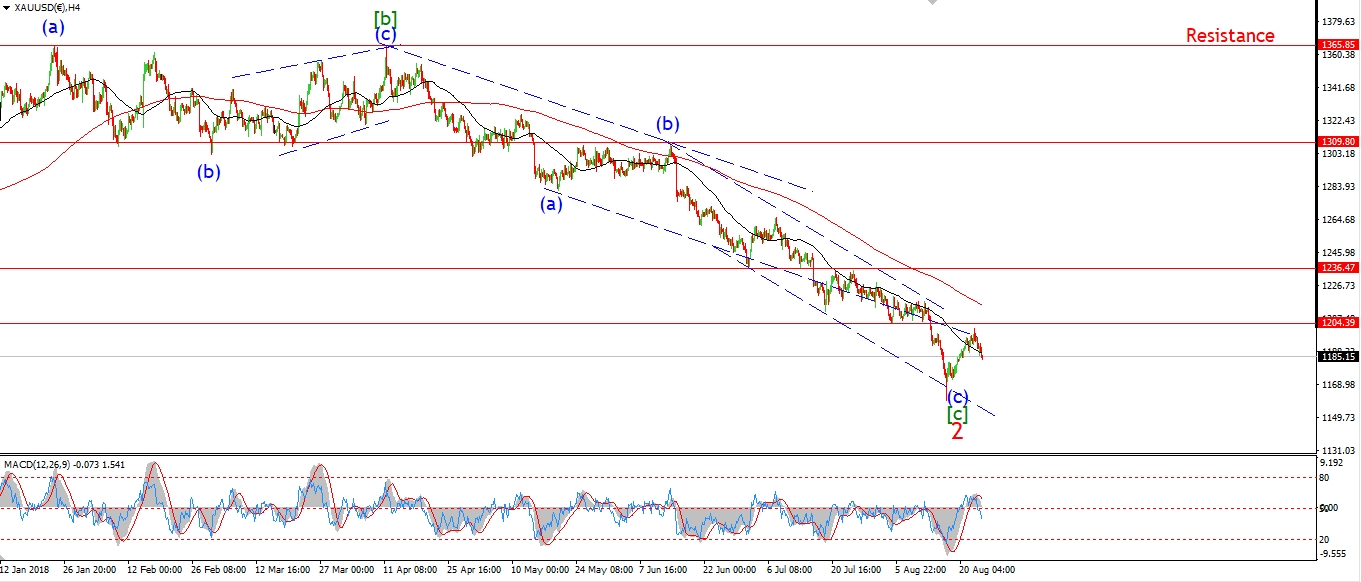
The market had just created an impulsive pattern higher off the 1160 lows on August 16th.
The wave count called for a large wave ‘3’ up to begin off that low.
I said this on the 28th of August;
“We are now drawing near
to an impulsive bullish signal in GOLD.”
And here is the outcome of that call;

Gold hit a high on January 4th of 1298.
That is a 12% rise off the lows.
[vc_row][vc_column][vc_separator border_width=”5″][/vc_column][/vc_row]
Become a BULLWAVES Member,
And find out where GOLD goes next!
[vc_row][vc_column][vc_separator border_width=”5″][/vc_column][/vc_row]
[vc_row][vc_column][vc_column_text]
Monthly Membership.
24.99
Nightly Charts + Analysis.
Weekly Video Analysis.
Critical turning points.
Price Projections.
[vc_row][vc_column][vc_separator border_width=”5″][/vc_column][/vc_row]