
Good evening folks and the Lord’s blessings to you.
EURUSD
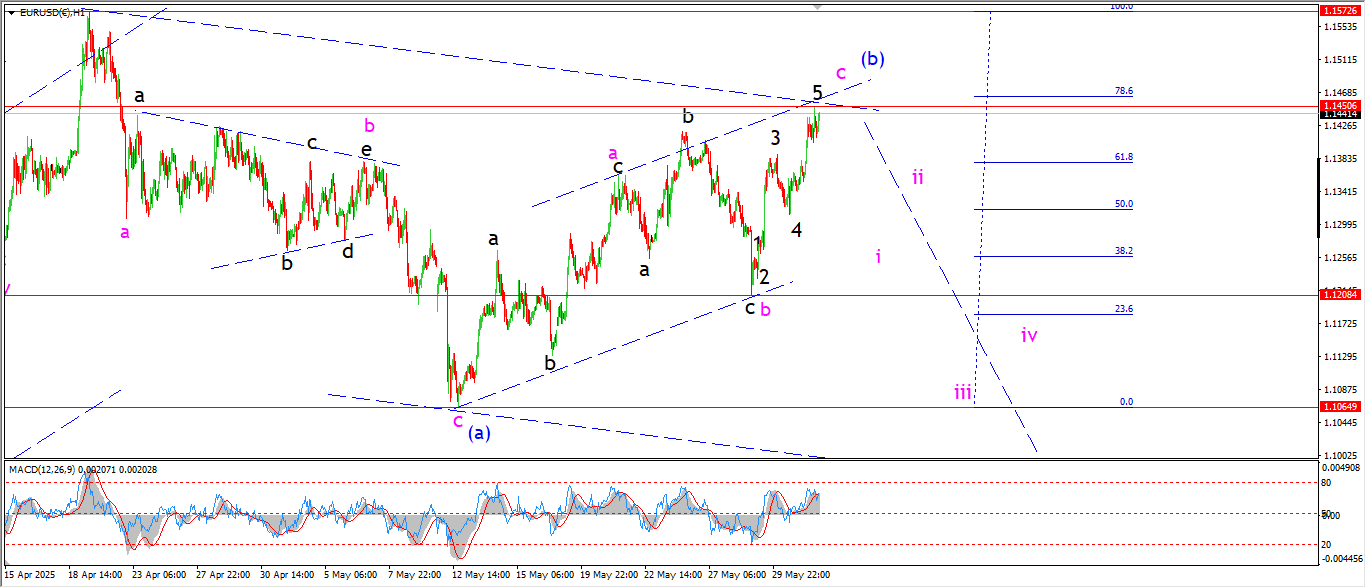
EURUSD 1hr.
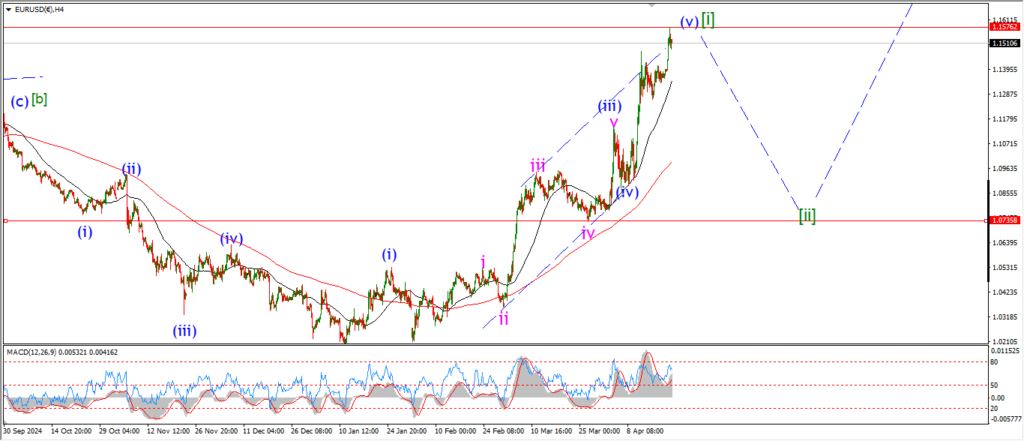
EURUSD 4hr.
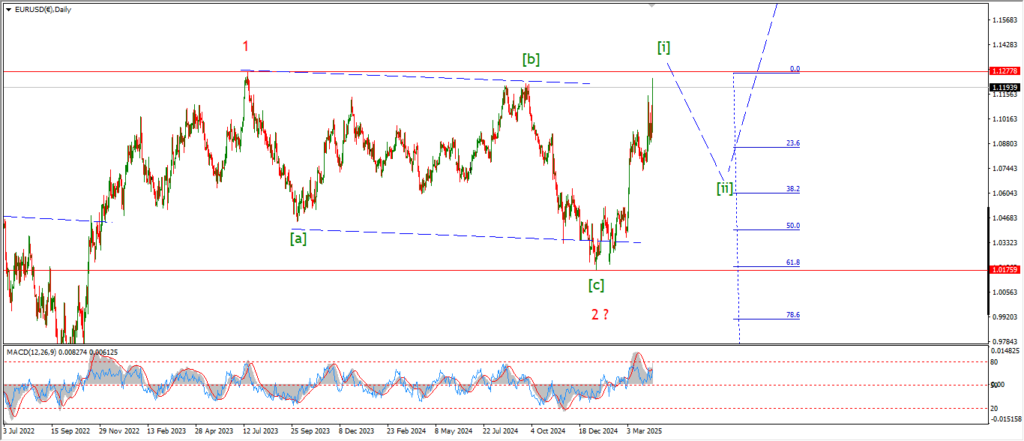
EURUSD daily.
The session high reached 1.1450 so far.
That brings the wave (b) rally within about 15 pips of the 78.65 retracement level of wave (a).
The rally in wave (b) has completed three waves up,
and wave ‘c’ of (b) has completed a five wave internal pattern.
So,
as far as I can tell,
we are in a good position to close out wave (b),
and turn lower into wave (c) this week.
Tomorrow;
wave (b) must now show signs of a top and reversal.
Wave ‘i’ of (c) should retrace most all of the rally in wave ‘c’,
so that gives an initial target at 1.1208 for wave ‘i’ of (c).
GBPUSD
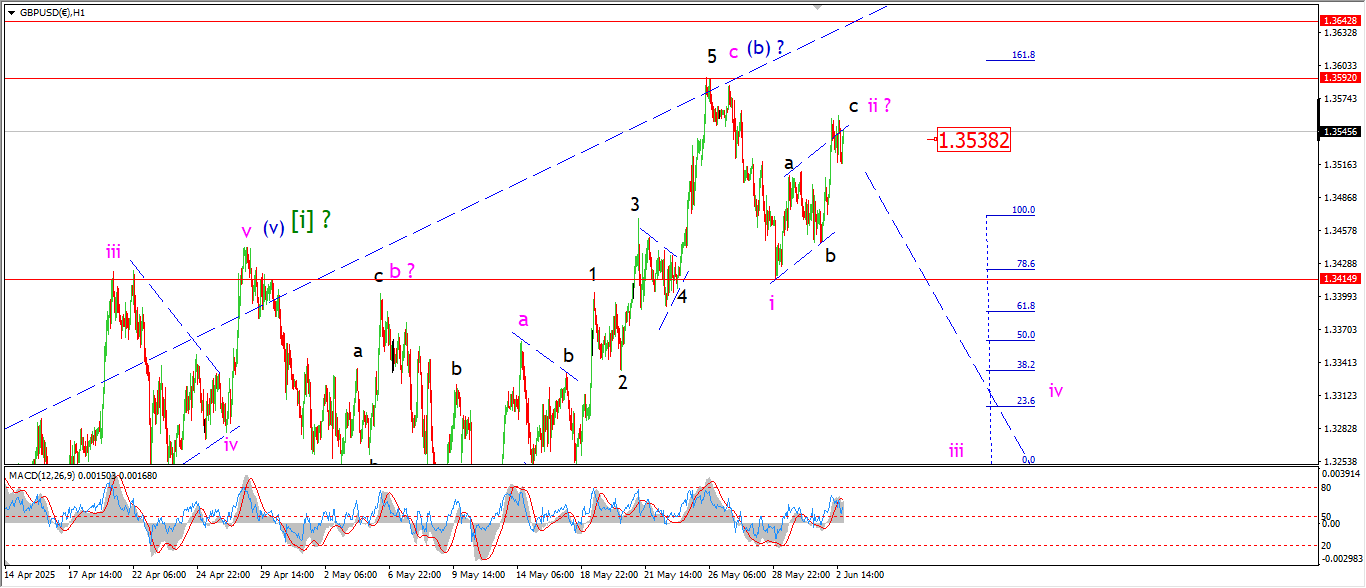
GBPUSD 1hr.
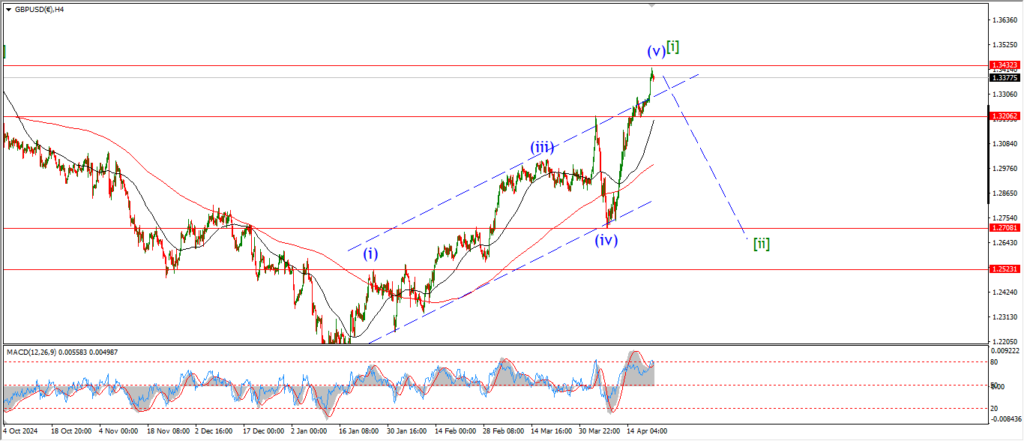
GBPUSD 4hr.
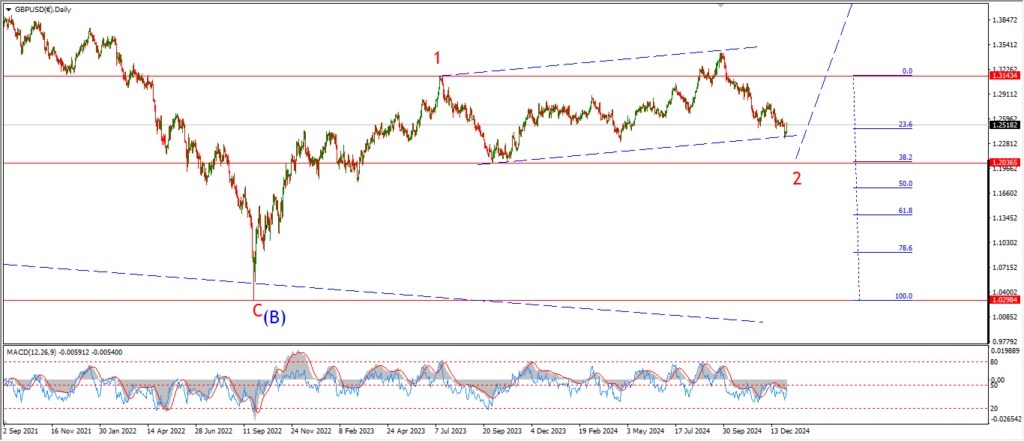
GBPUSD daily.
We have a three wave pattern higher into wave ‘ii’ now in place here also.
The internal pattern of wave ‘ii’ may still be in the process of closing,
but wave ‘c’ of ‘ii’ has already hit the upper channel line today,
so I am content with the idea that wave ‘ii’ is done here.
Tomorrow;
The pattern suggests that wave ‘iii’ should now begin off this general area.
A break of 1.43115 again will signal that wave ‘iii’ is underway.
The wave (b) high must hold at 1.3590.
USDJPY.
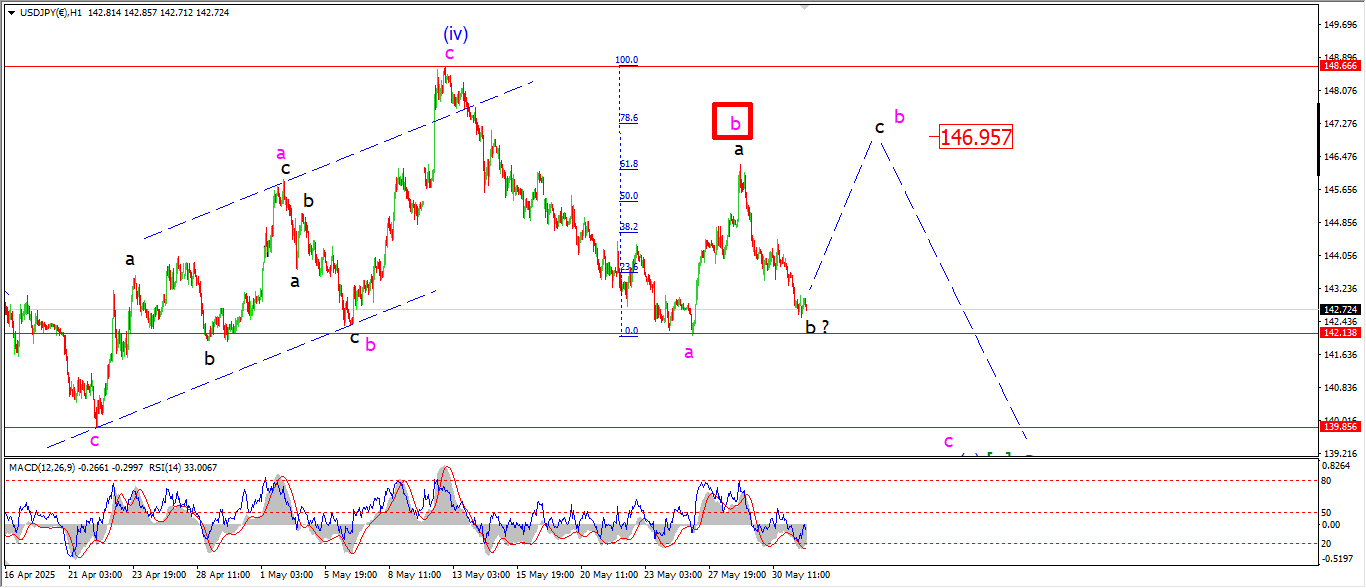
USDJPY 1hr.
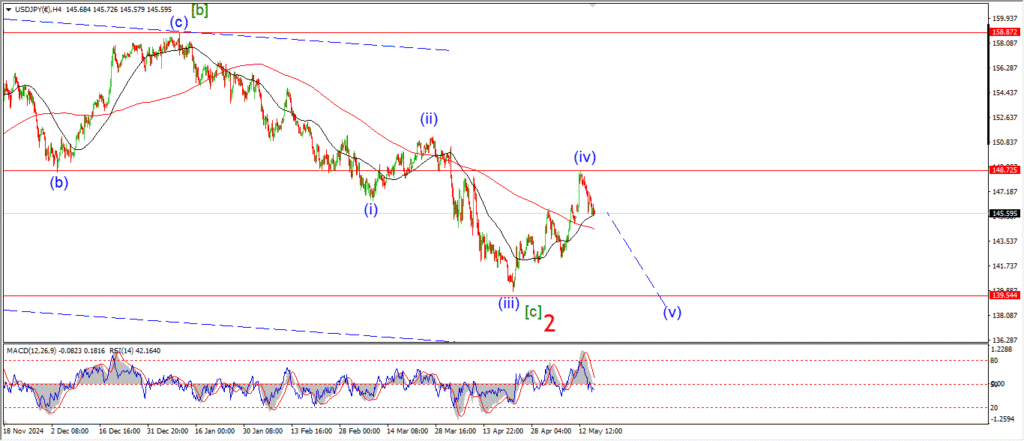
USDJPY 4hr.
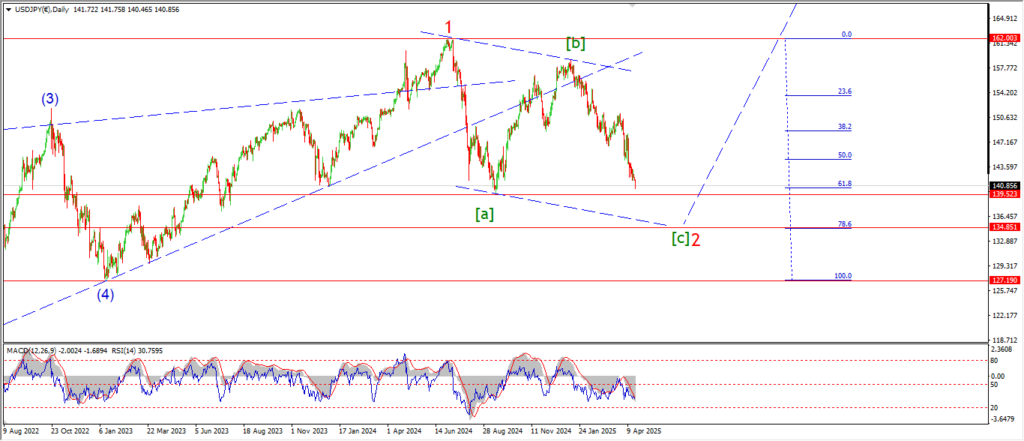
USDJPY daily.
The alternate count for wave ‘b’ of (v) is still in play after todays action.
The price dropped further without any attempt to begin wave ‘c’ of ‘b’.
But I can see a three wave pattern into todays lows,
and that pattern still counts as wave ‘b’ of ‘b’ at the moment.
So I will stick with this wave count for wave ‘b’ pink until proved wrong with a break of 142.13.
Tomorrow;
Watch for wave ‘b’ to hold above 142.13.
Wave ‘c’ of ‘b’ will turn higher in this scenario to hit a high near 147.00 again in wave ‘c’ of ‘b’.
DOW JONES.
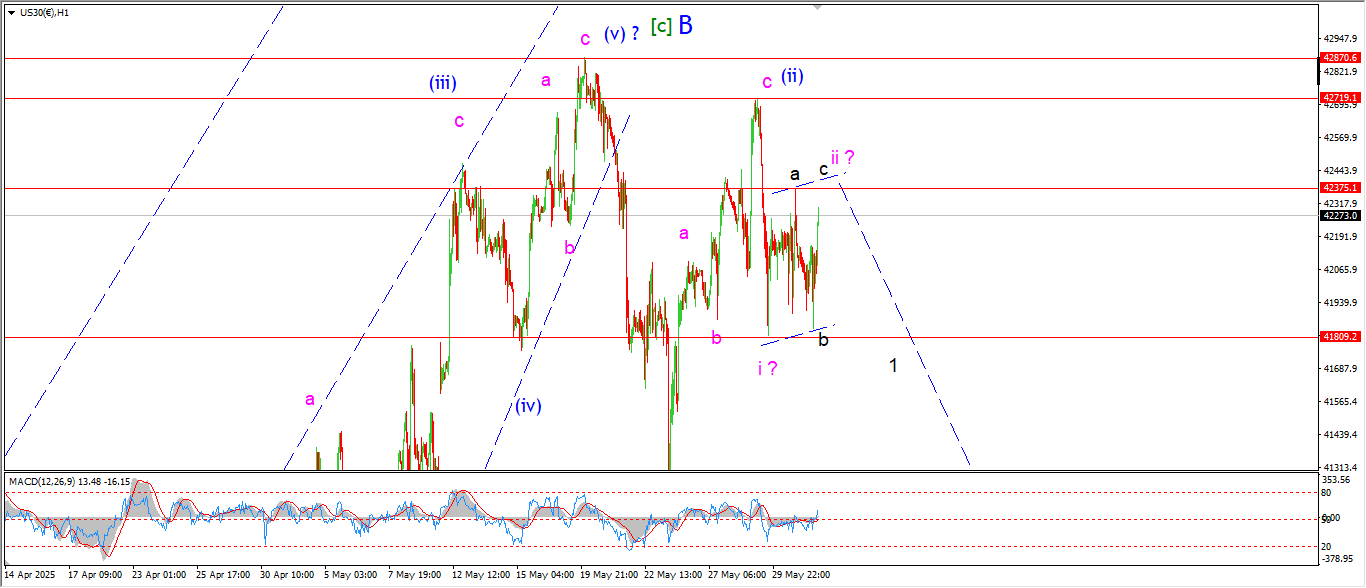
DOW 1hr.
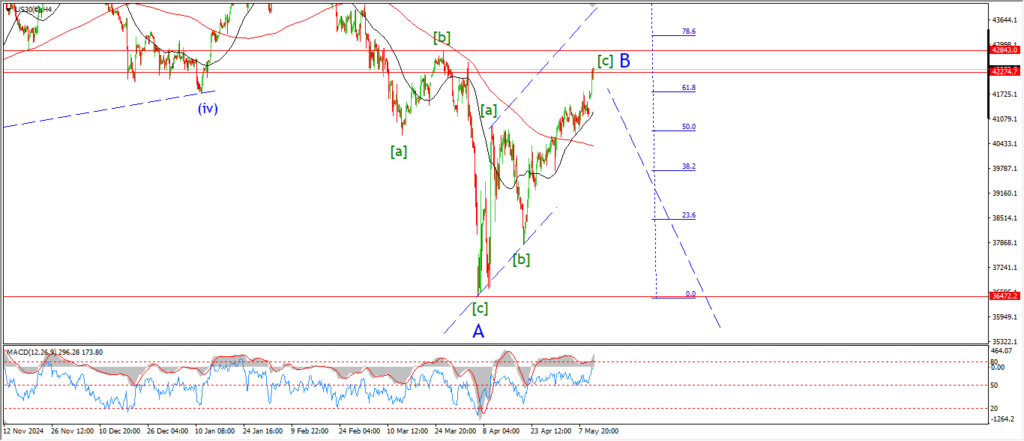
DOW 4hr
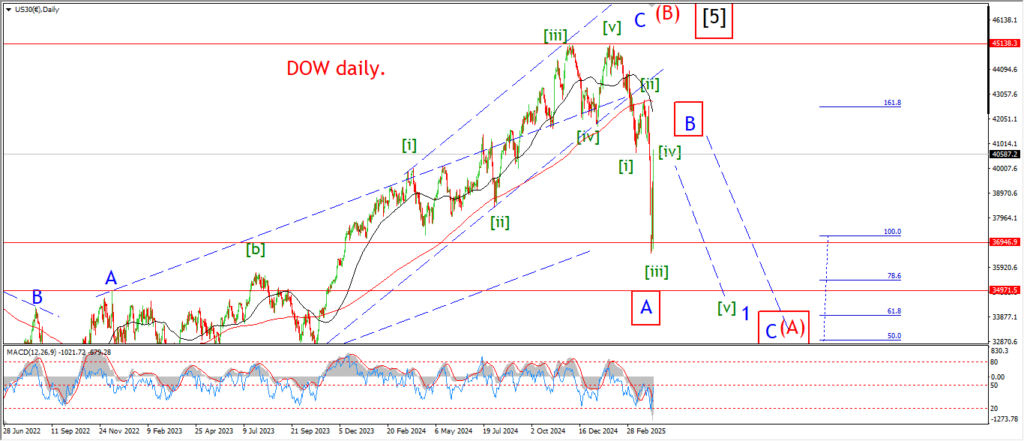
DOW daily.
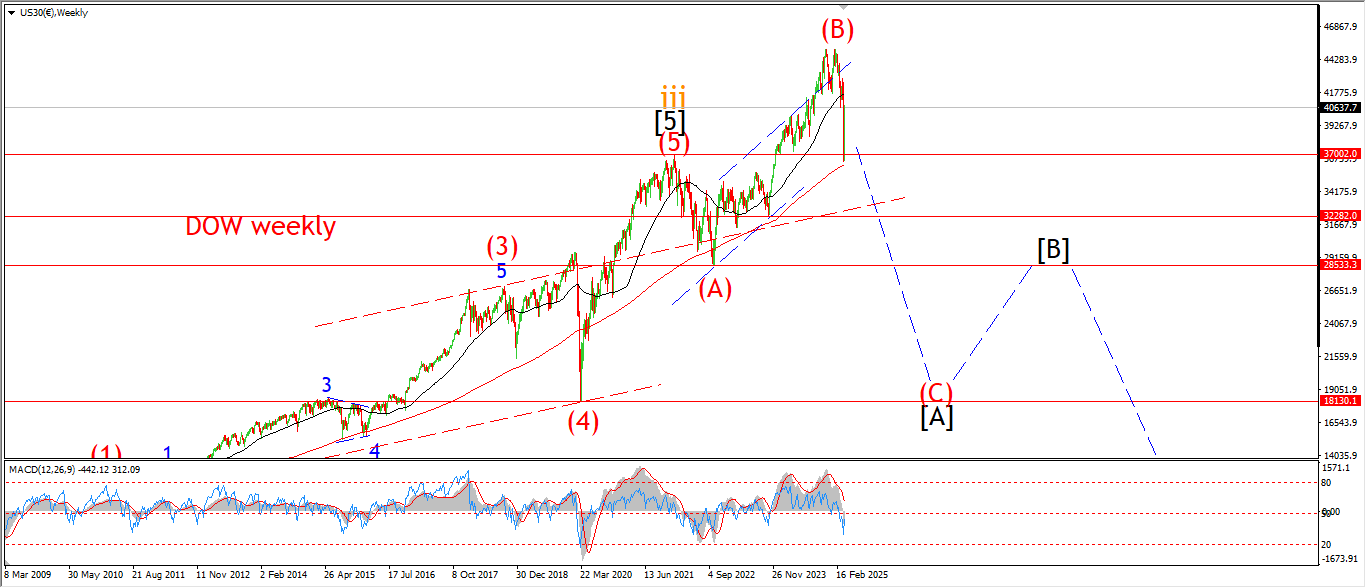
The market seems to be stuck in a corrective sideways move again today,
and I am suggesting that wave ‘ii’ is still underway here.
The rally this evening comes in wave ‘c’ of ‘ii’ again.
And wave ‘c’ will hit 42375 at the wave ‘a’ high in this scenario.
Wave ‘ii’ of (iii) will then be done with,
and wave ‘iii’ of (iii) should take over for the rest of the week.
Tomorrow;
If this count is correct,
then we are in for an exciting week.
Watch for wave ‘ii’ to close out a lower high beneath 42700.
And wave ‘1’ of (iii) must then drop sharply to break 41800 again.
GOLD
GOLD 1hr.
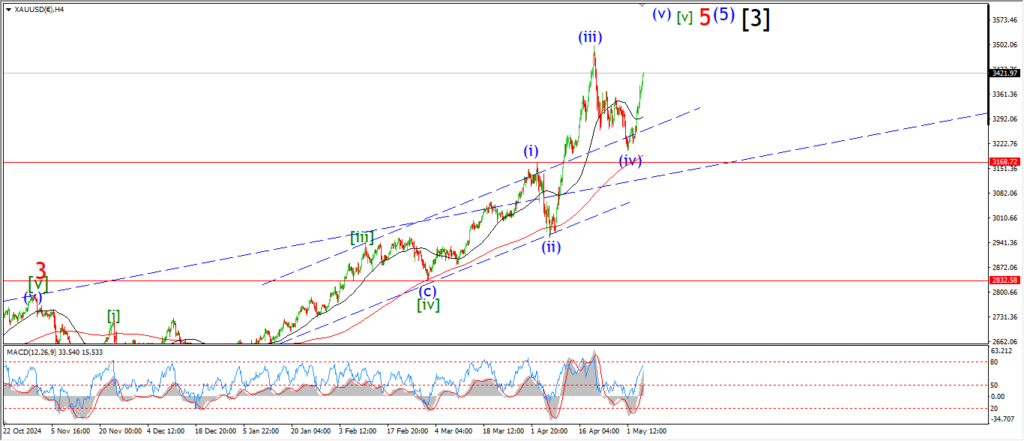
GOLD 4hr.
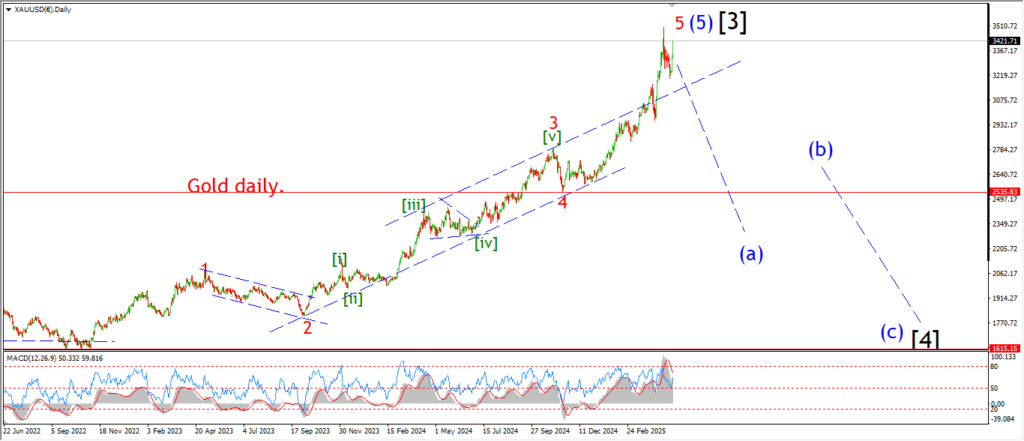
GOLD daily.
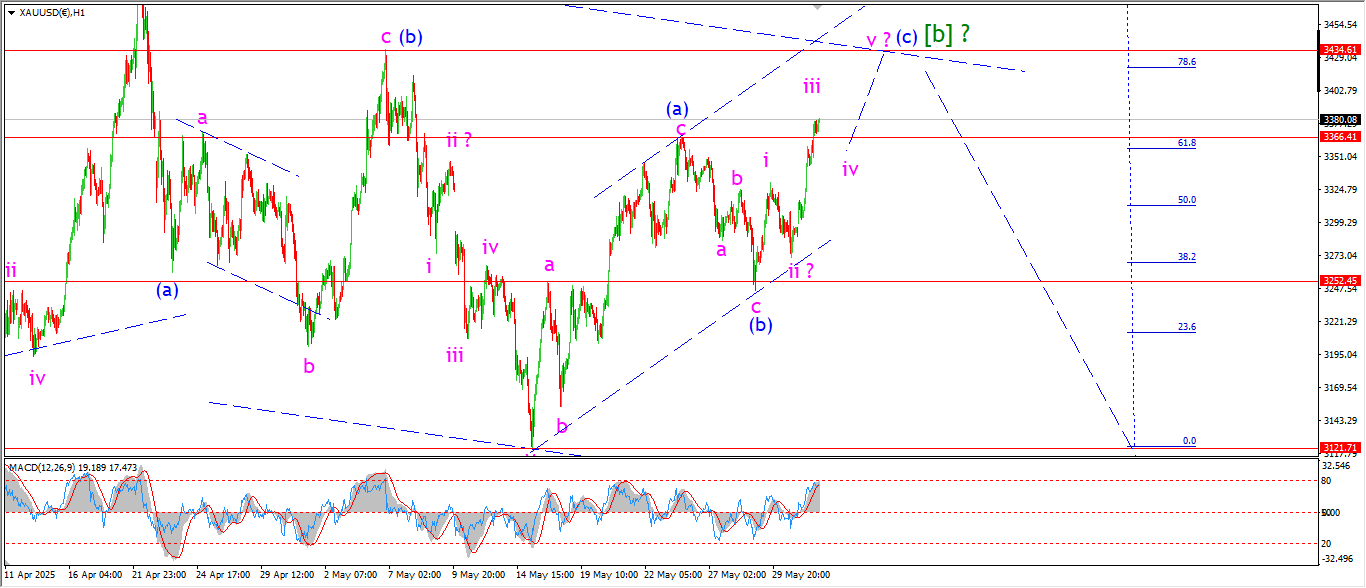
Gold is refusing to give up the ghost again today!
I am going back to the wave [b] idea again tonight with a large three wave rally underway.
Wave [b] should hit the previous wave (B) high at 3434 again.
and at the moment,
the price is moving higher in wave (c) of [b].
Wave ‘iii’ of (c) has broken out above last weeks high now.
and I am looking at a possible five wave pattern in play for wave (c) with the target at 3434.
Tomorrow;
Watch for wave (c) to complete five waves up near 3434 and from there I will look for another possible reversal.
CRUDE OIL.
CRUDE OIL 1hr.
CRUDE OIL 4hr.
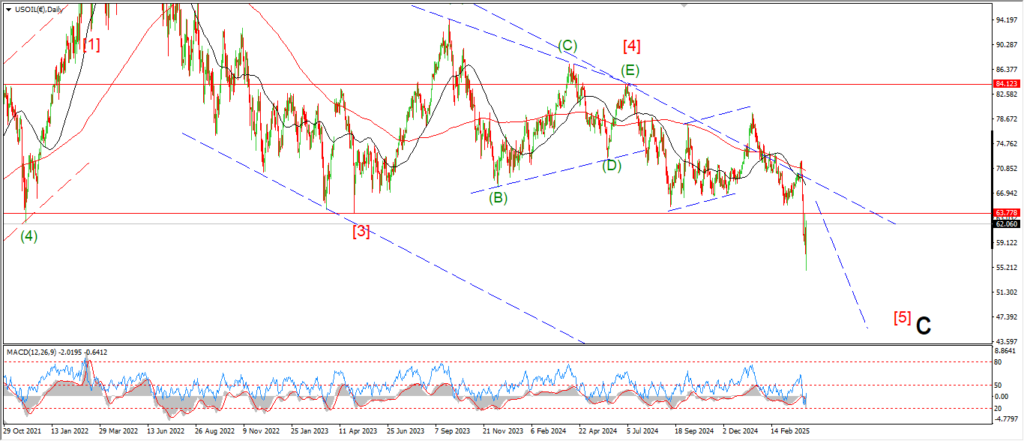
CRUDE OIL daily.
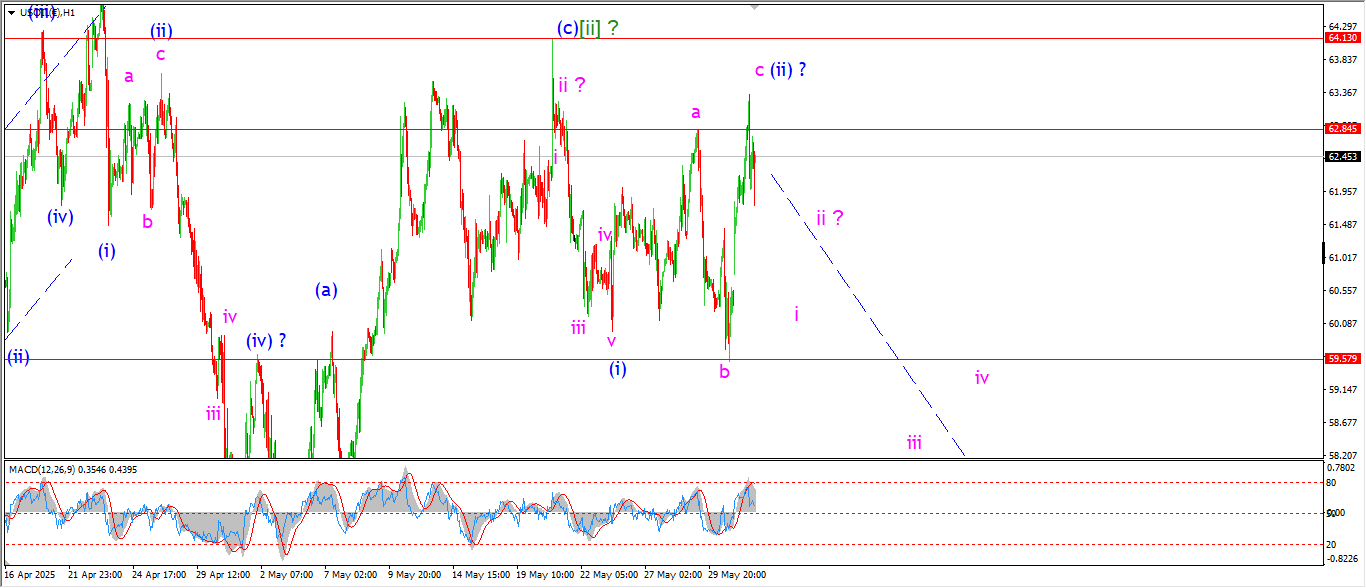
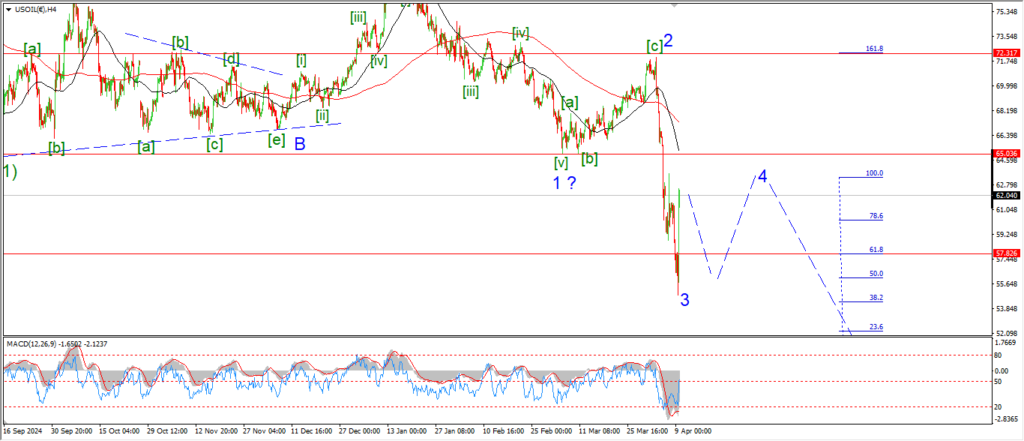
Last week I thought we had a perfect pattern in place for wave (ii) blue.
And then today that pattern got wiped out with a rally to a new lower high.
I am now looking at an expanded flat correction for wave (ii) complete at todays high.
From here we should see a drop into wave ‘i’ of (iii) over the coming few days.
Tomorrow;
Wave [ii] must hold at 64.13.
Wave ‘i’ of (iii) must now turn lower towards 60.00 again.
A break of 59.00 again will confirm wave (iii) is underway.
S&P 500.
S&P 500 1hr
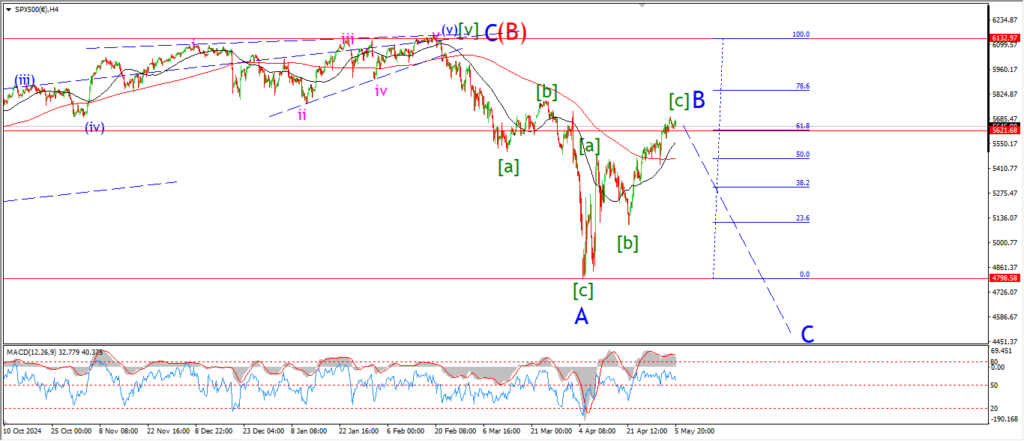
S&P 500 4hr
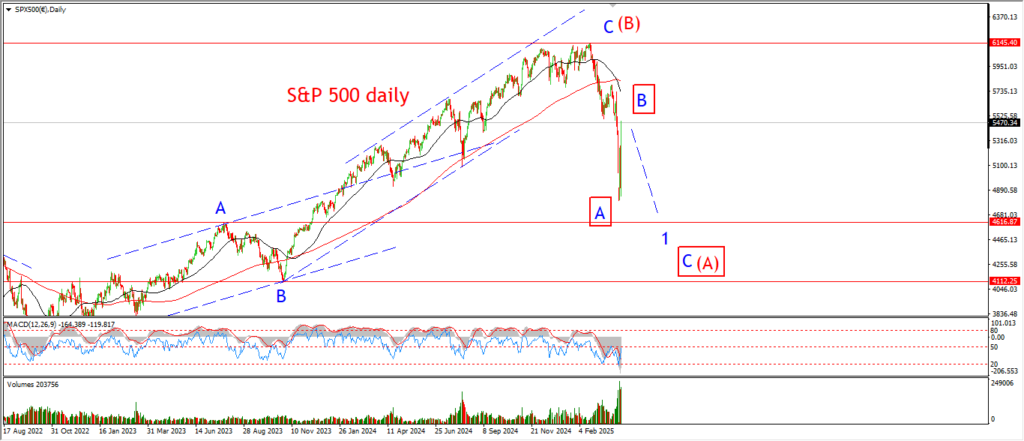
S&P 500 daily.
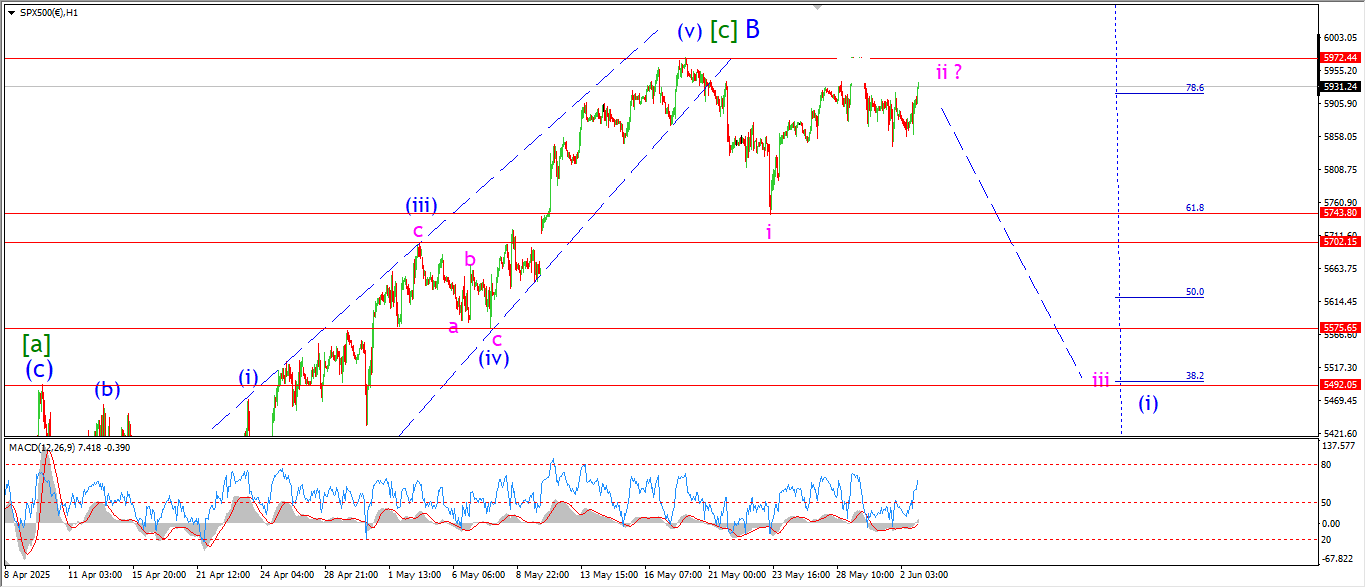
I am playing a waiting game tonight and the market seems to be doing the very same thing.
the price is flat this evening and we continue to hold a lower high below wave ‘B’ at 5970.
I can’t add mush to what I have already said here.
If the main pattern is correct,
and wave ‘B’ is done,
then it is time for the market to take the next step into wave ‘C’ as shown.
Tomorrow;
Watch for wave ‘B’ to continue to hold and wave (i) blue should turn down again from here.
SILVER.
SILVER 1hr
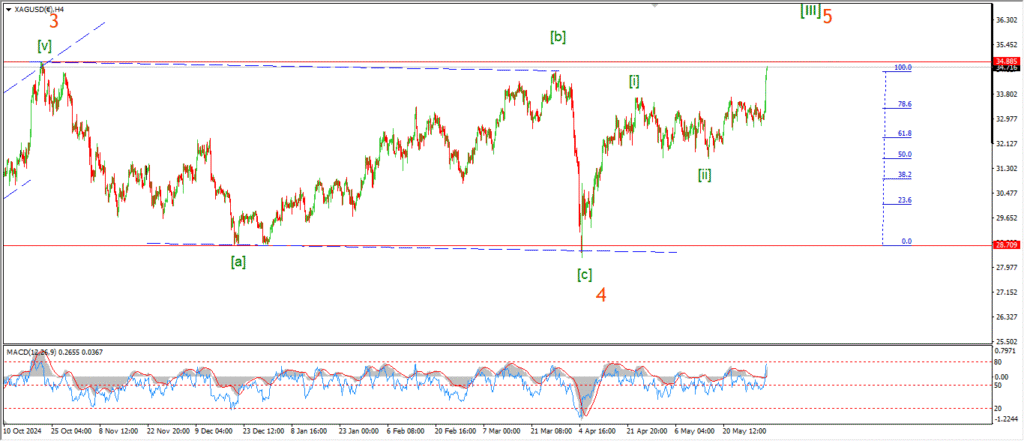
SILVER 4hr.

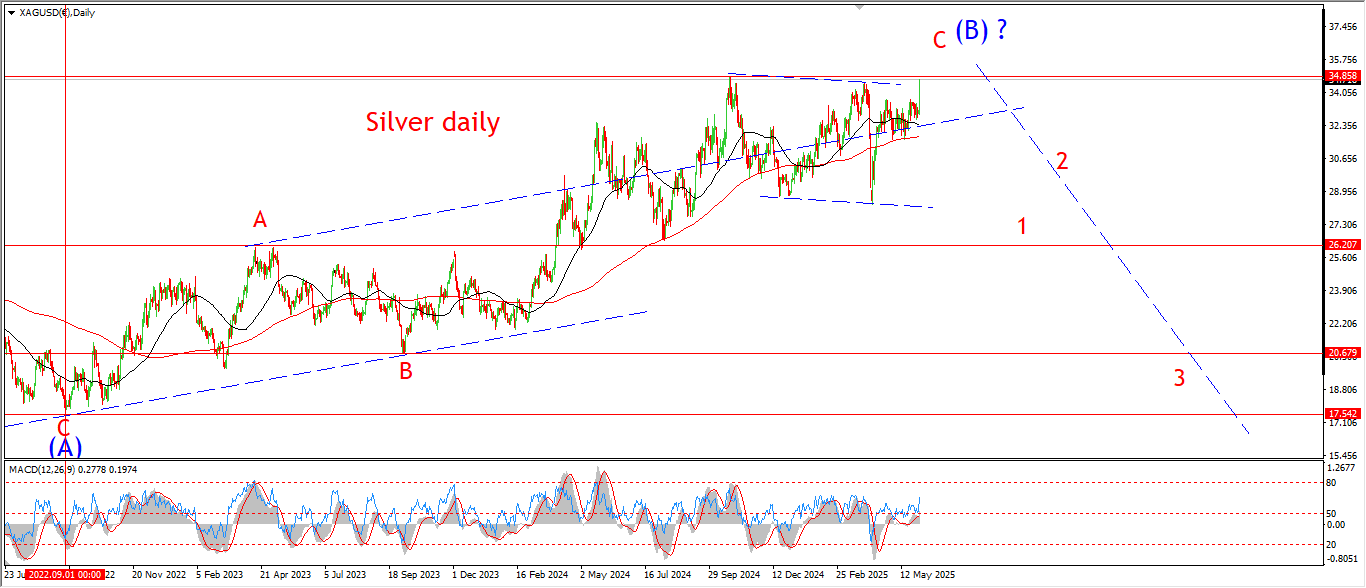
SILVER daily.
Well,
The rally came that I was looking for,
but the price has now blown out higher and invalidated my long suffering pattern.
The price ahs broken the previous wave ‘2’ high.
And now I am back to the drawing board for silver again.
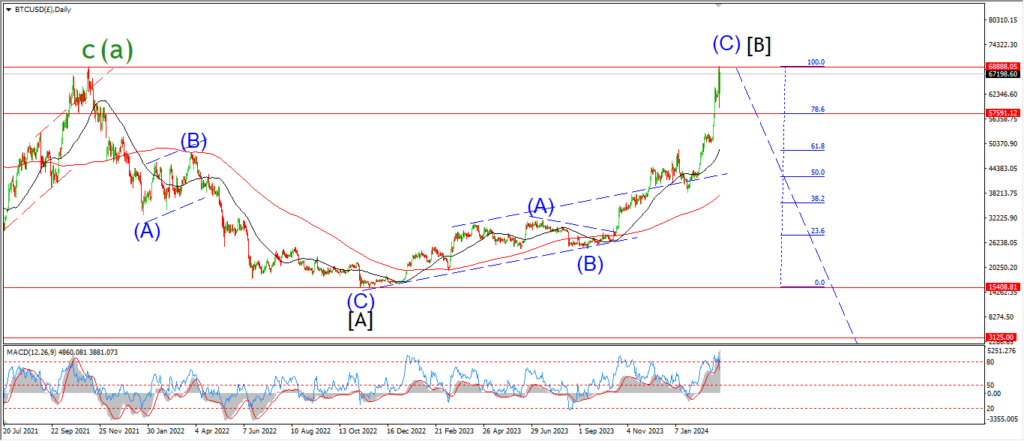
I am showing the daily timescale as the main chart tonight in order to put my thoughts together again in this market.
We are almost out to a new high above last Octobers top.
And I can only think that this is still part of the wave (B) top that I was long following.
The price has been supported by that upper trend channel line for over a year now.
In fact the price has been oscillating around that trend line all this time.
I look at this chart and I can almost see an inverse to the U.S treasury long bond.
this market is stretching for a top over the last 2 years,
and the treasury long bond is searching for a low over the same period.
Tomorrow;
I am going to let the market operate this week to see if I can make sense of this new situation as wave ‘C’ of (B) unfolds.
Todays move was reactionary in some way,
so I won’t be surprised to see an equal and opposite reaction over the coming days.
BITCOIN
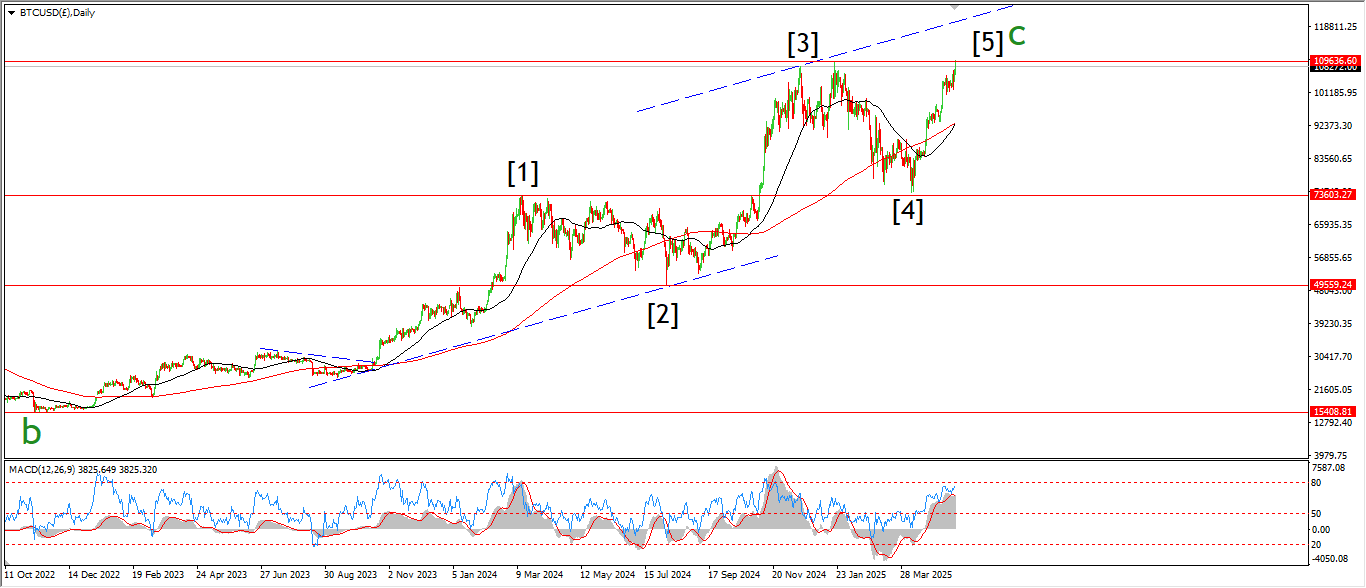
BITCOIN 1hr.
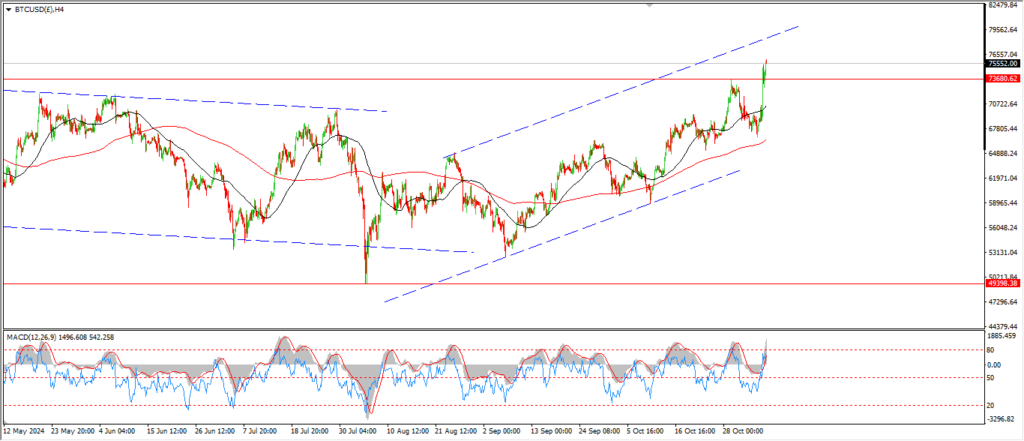
BITCOIN 4hr.
BITCOIN daily.
….
FTSE 100.
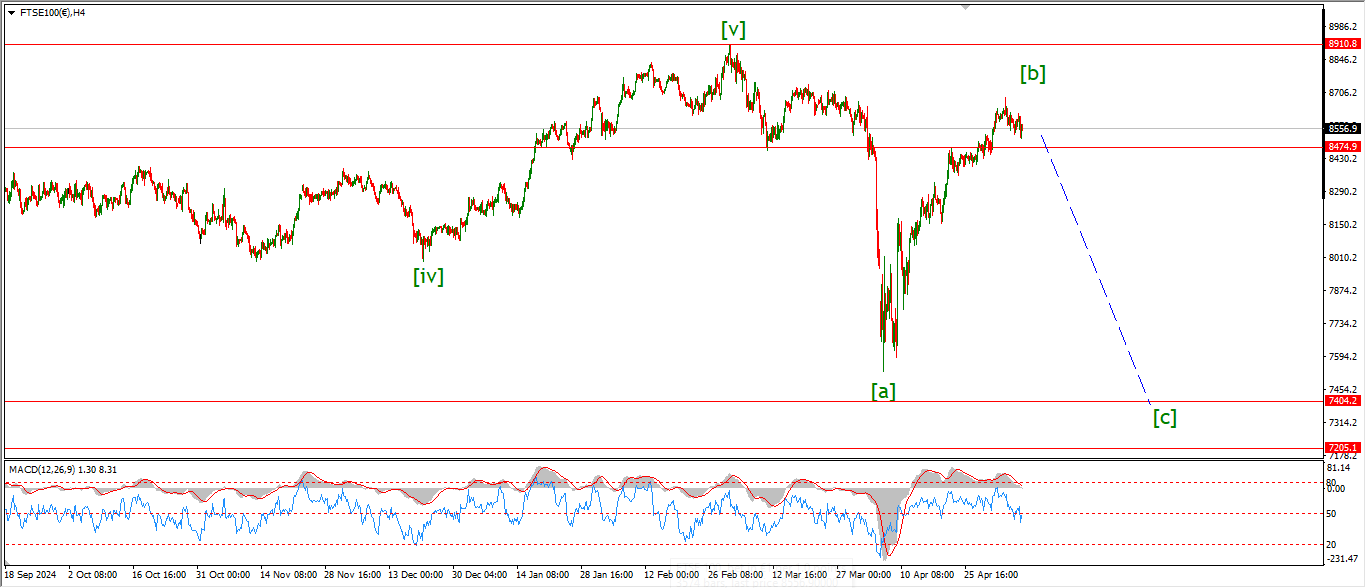
FTSE 100 1hr.
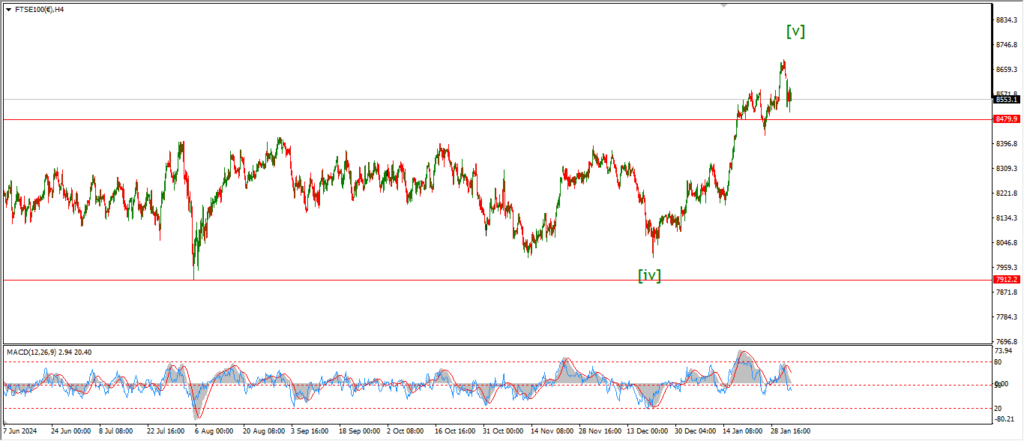
FTSE 100 4hr.
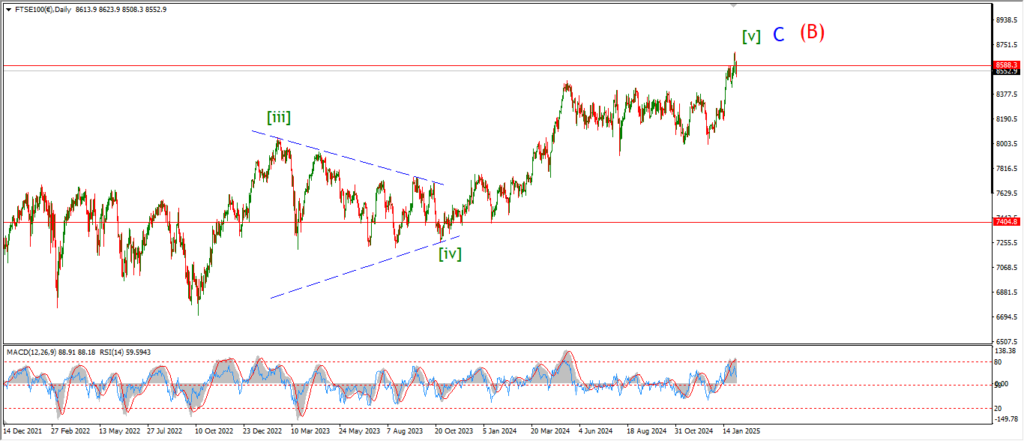
FTSE 100 daily.
….
DAX.
DAX 1hr
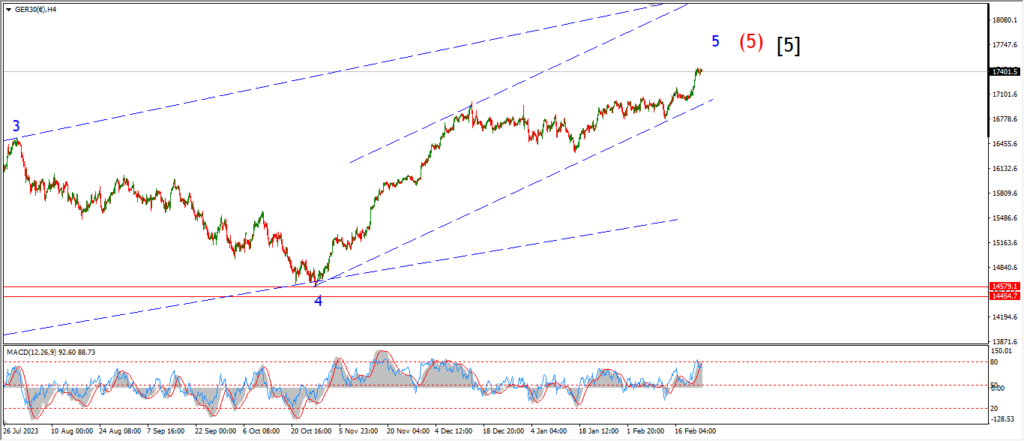
DAX 4hr

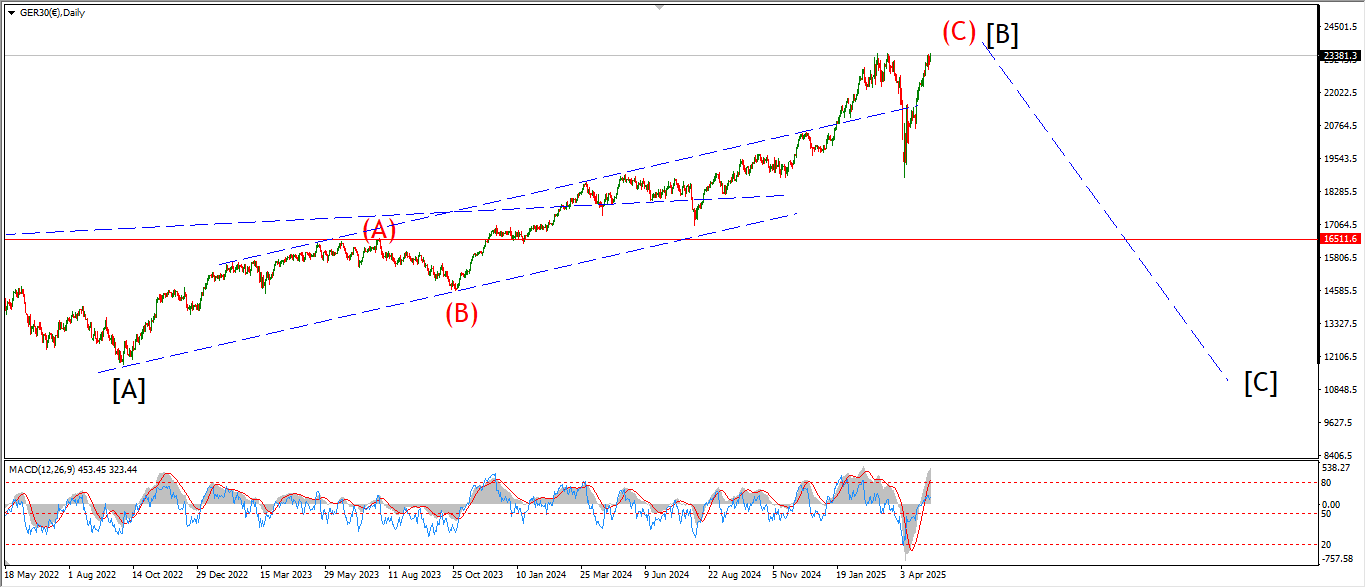
DAX daily.
….
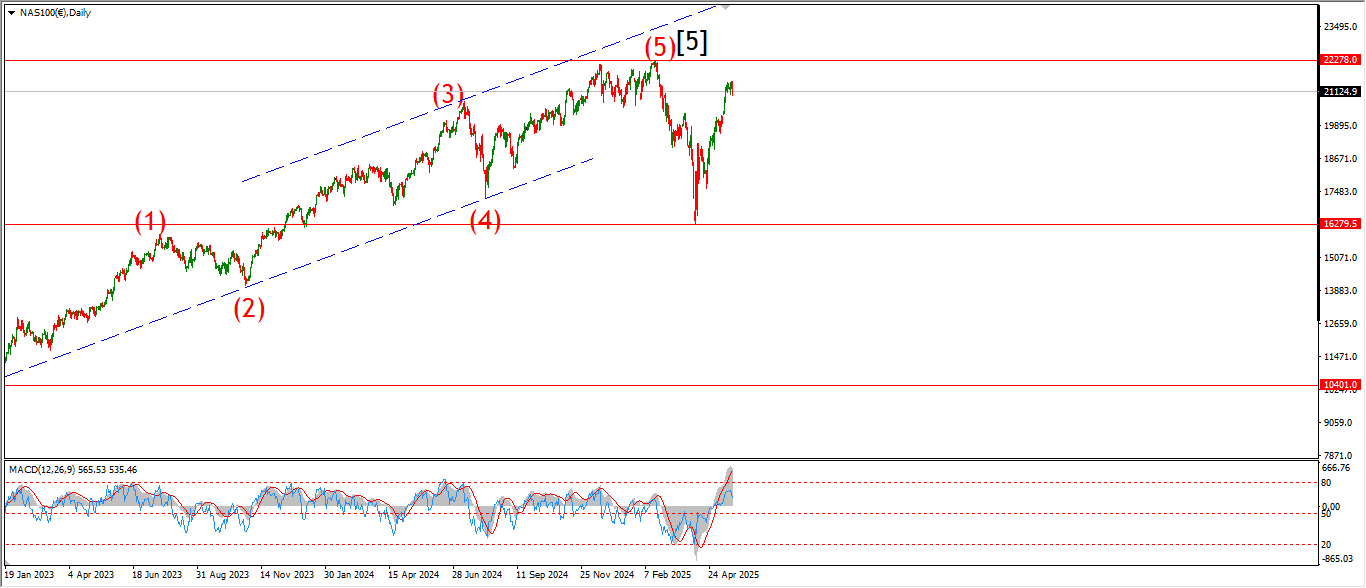
NASDAQ 100.
NASDAQ 1hr
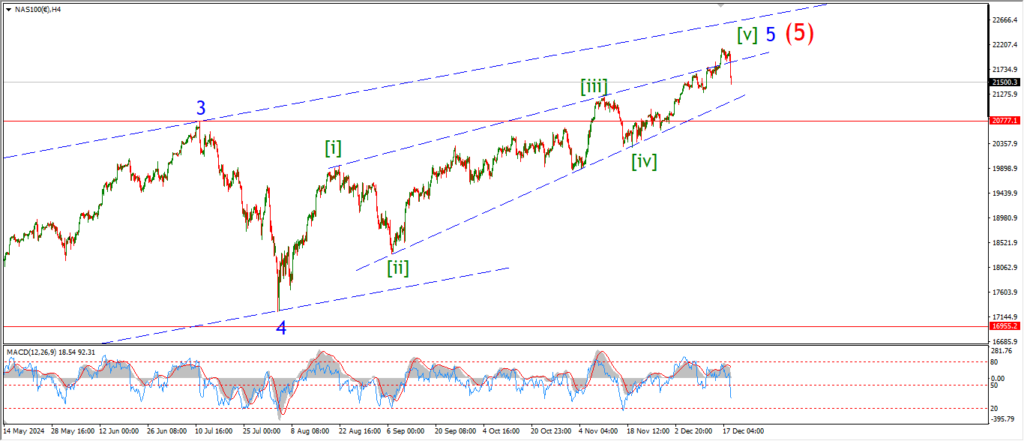
NASDAQ 4hr.
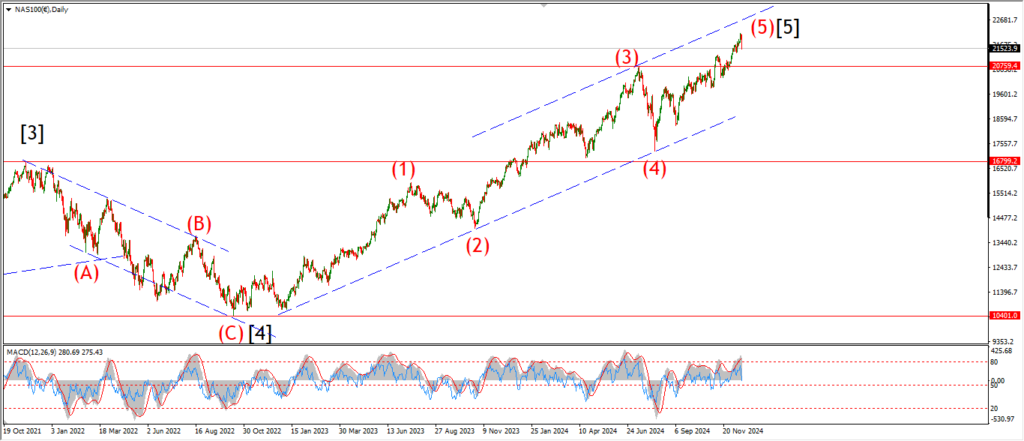
NASDAQ daily.
….