
Good evening folks and the Lord’s blessings to you.
EURUSD
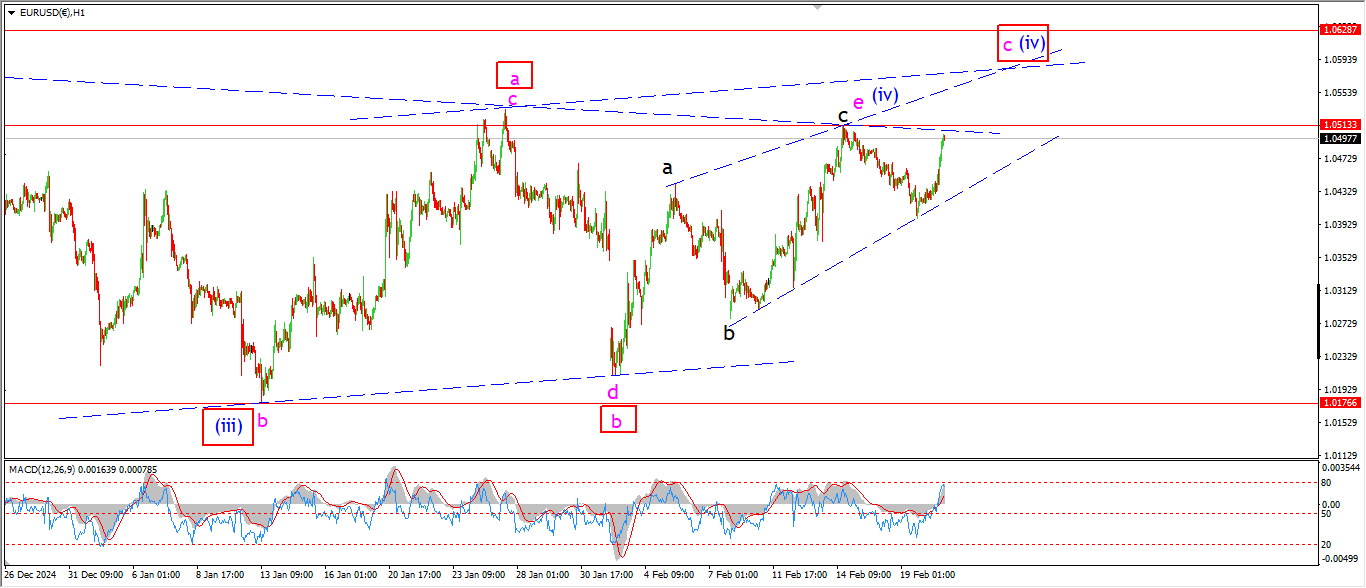
EURUSD 1hr.
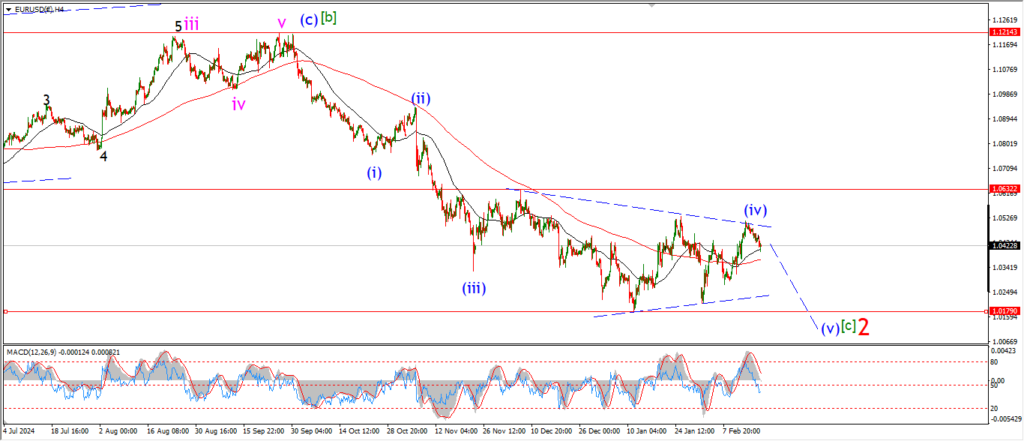
EURUSD 4hr.
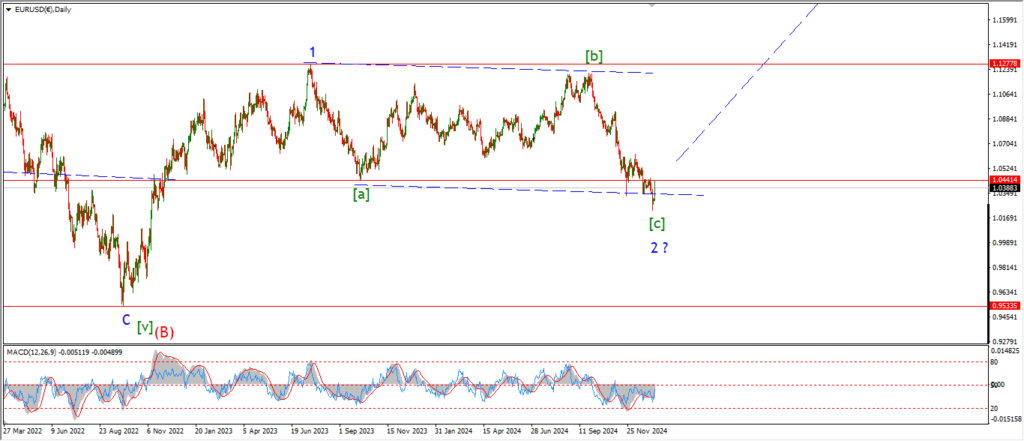
EURUSD daily.
The action in EURUSD this week has not followed any pattern that I have suggested.
The contracting triangle that I have shown for wave (iv) is close to breaking as I write tonight.
And with that I have to look at the next possibility for wave (iv).
The alternate count involves a straight forward three wave pattern higher into wave (iv) as shown.
Wave ‘c’ of (iv) will top out near 1.06 in this scenario.
Tomorrow;
A break above 1.0513 again will trigger this count.
And then wave ‘c’ will push up to the upper channel line at 1.0600.
GBPUSD
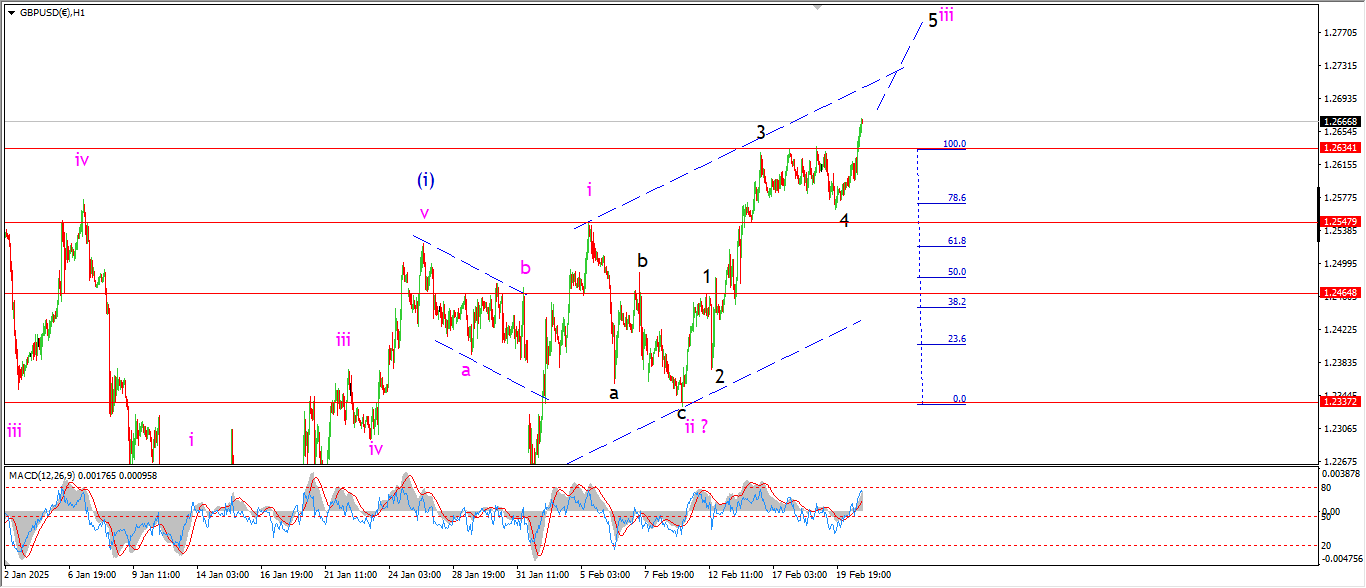
GBPUSD 1hr.
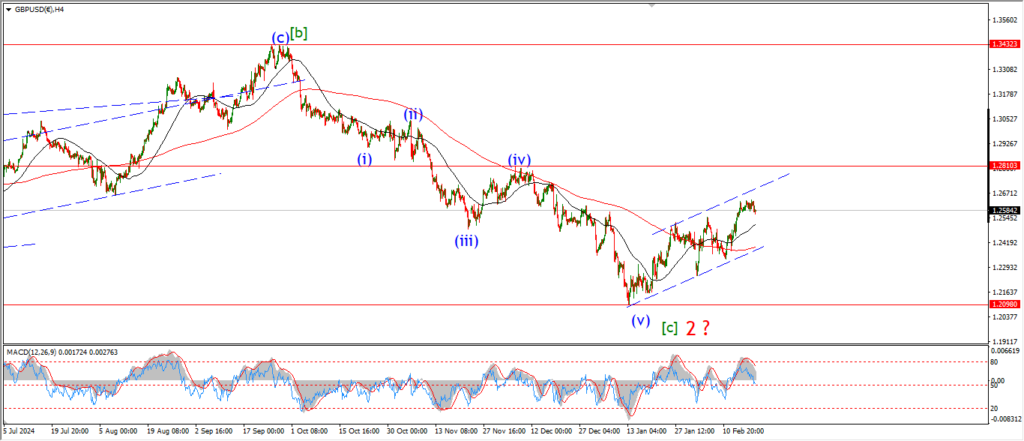
GBPUSD 4hr.
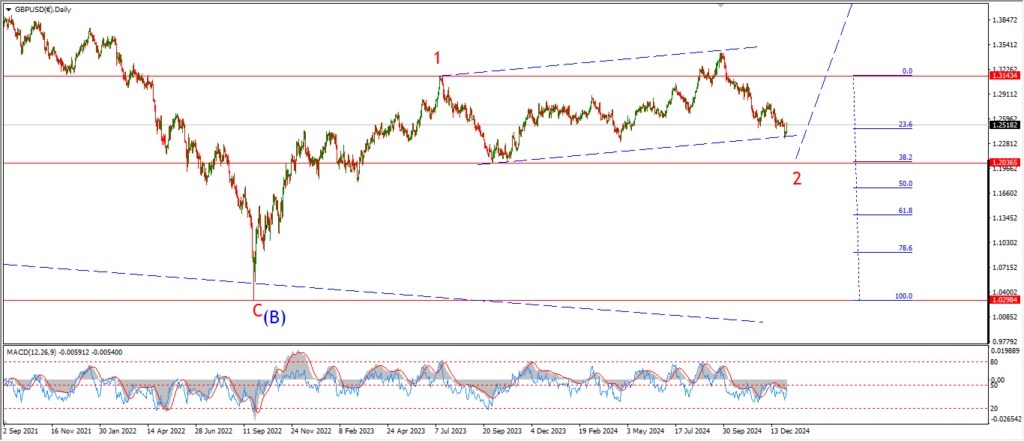
GBPUSD daily.
Cable has traced out a five wave rally higher in wave ‘iii’ of (iii) today.
The price has not accelerated into wave ‘5’ of ‘iii’ as expected.
But that may happen tomorrow.
A push up to the 1.2700 level again will bring the price action more in line with the wave count.
And from that level we can chart a way higher into the top of wave (iii) blue.
One step at a time.
Tomorrow;
Watch for wave ‘4’ to hold and wave ‘5’ of ‘iii’ to continue higher to hit the 1.2700 area again.
USDJPY.
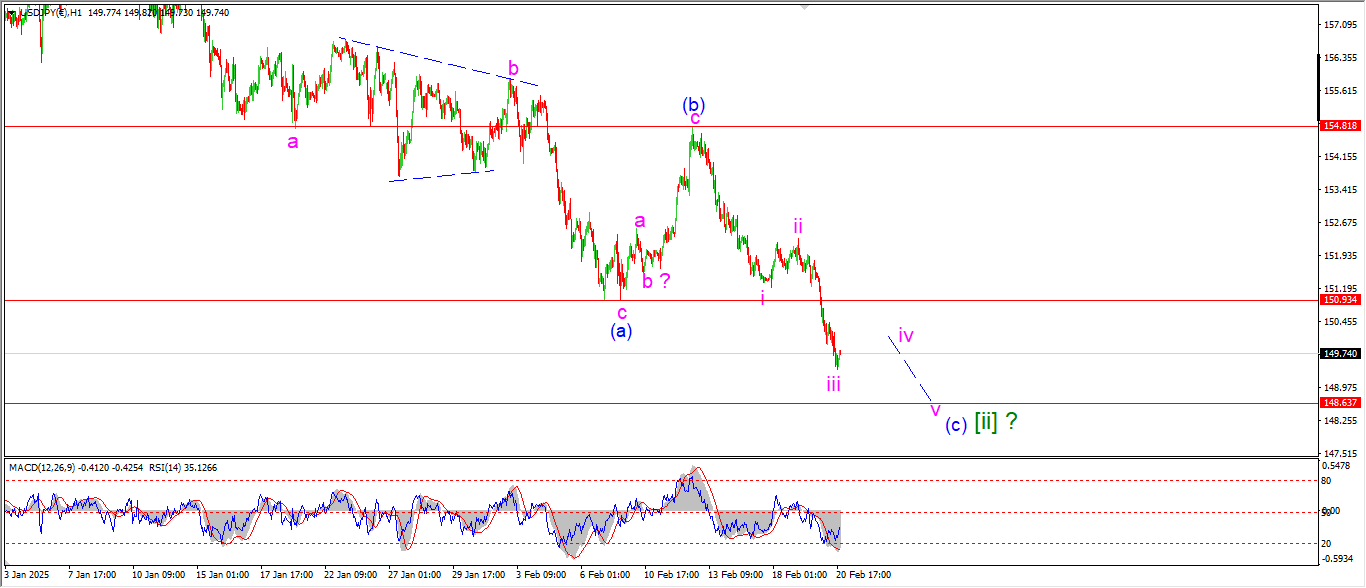
USDJPY 1hr.
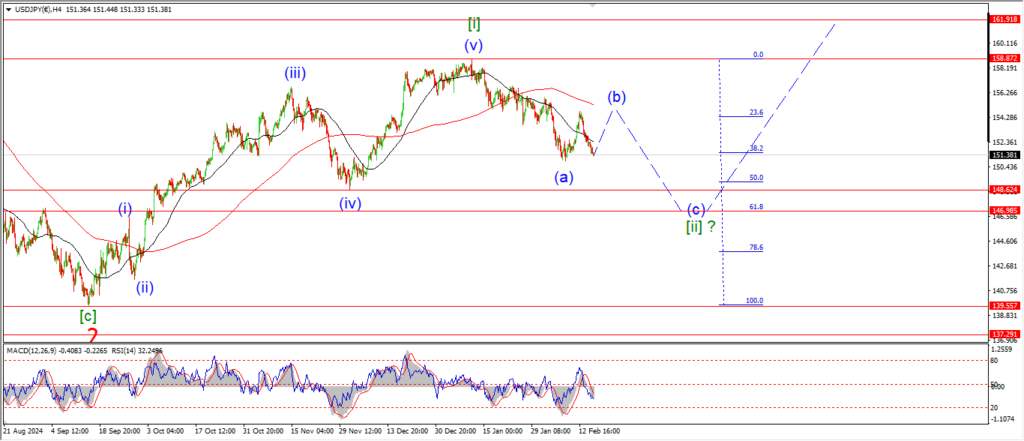
USDJPY 4hr.
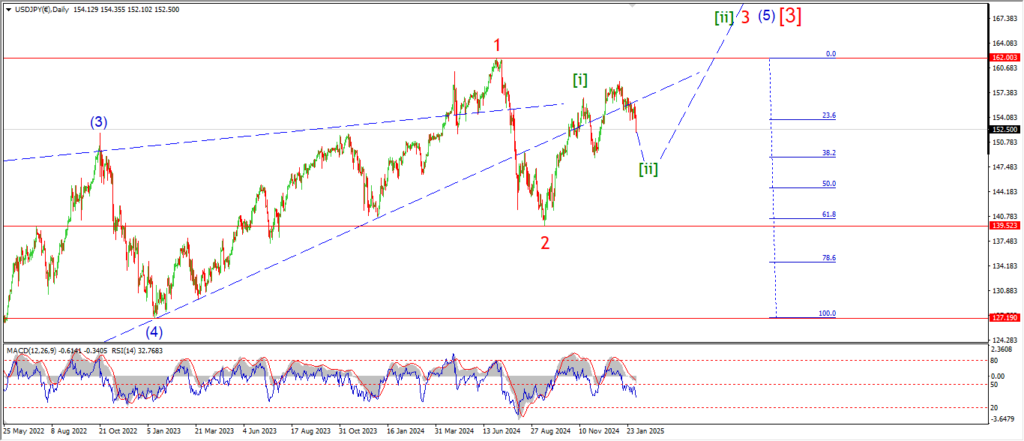
USDJPY daily.
Another drop in USDJPY today has brought forward the wave (c) decline sooner than expected.
The price has dropped in three waves off the wave (b) high so far,
todays low is labelled wave ‘iii’ of (c) of [ii].
Wave ‘iv’ and ‘v’ will take another few days to complete.
the 4hr chart suggests that wave [ii] will find a low at 147.00 where the 62% retracement lies.
Tomorrow;
watch for wave (c) of [ii] to complete five waves down near the 147.00 level over the next few days.
From there I will look higher into wave [iii].
DOW JONES.
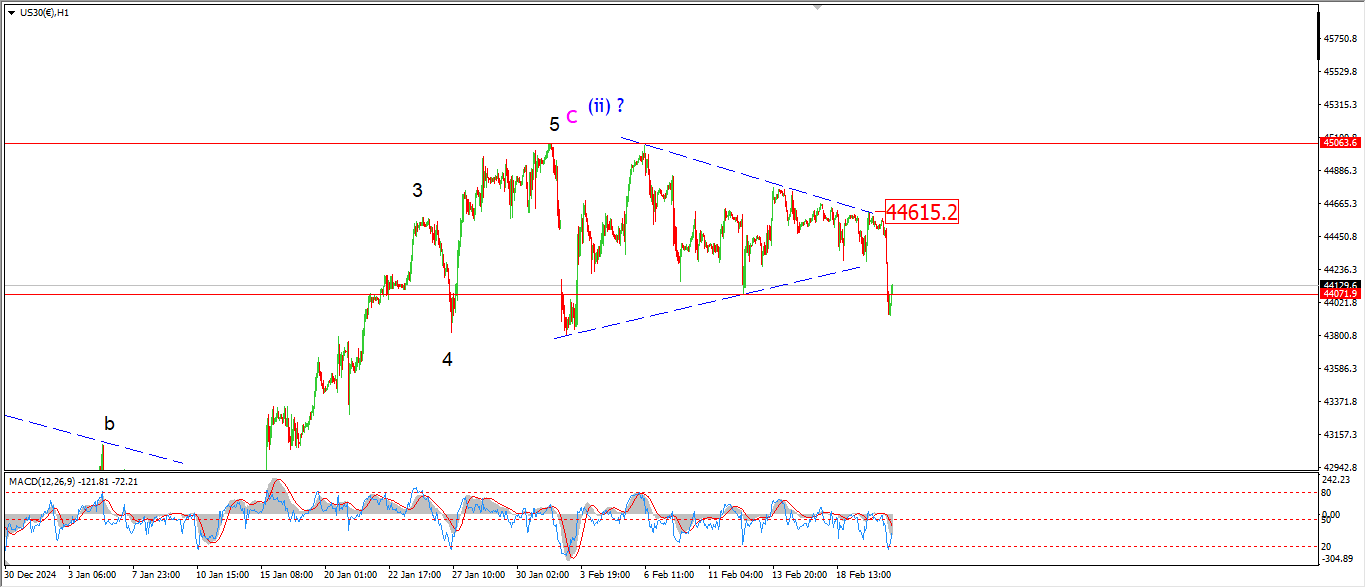
DOW 1hr.
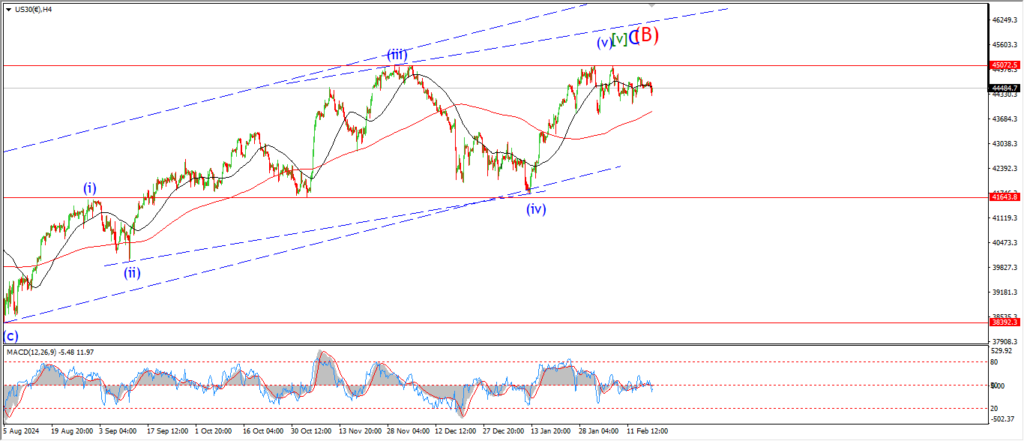
DOW 4hr
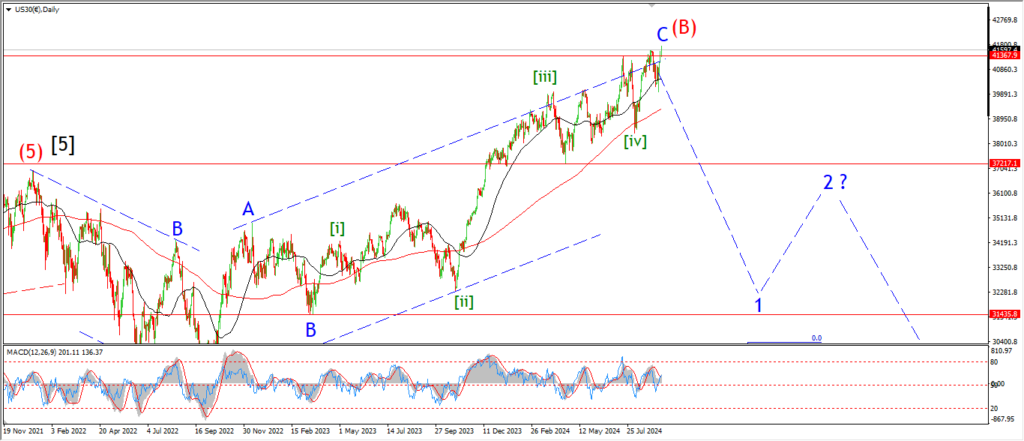
DOW daily.
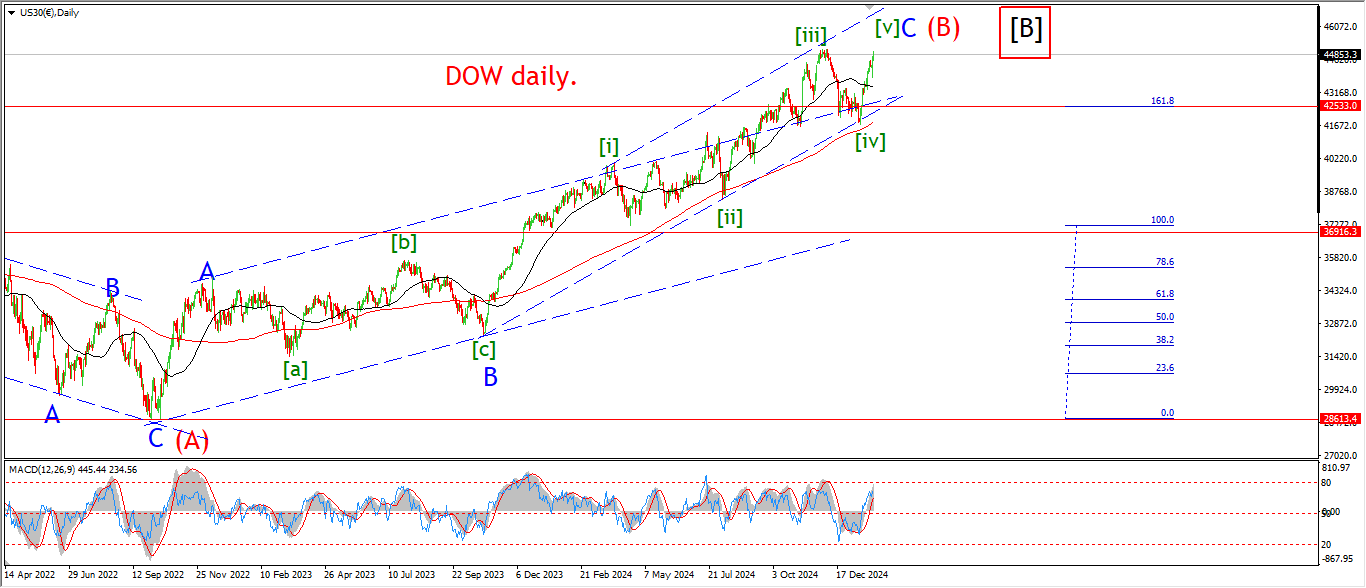
Well the DOW is playing with me this week without a doubt!
The market turned sharply lower today to break out of the triangle pattern below 44000.
This action can still be viewed as part of a larger corrective move within wave [v] up.
but it is interesting to say the least that the market is failing below the highs for a third time now.
So there is still hope alive that the wave (ii) high is correct.
However small that hope might be!
Tomorrow;
I am going to let the week play out and see if we get a sharp move lower to confirm wave (iii) down or not.
GOLD
GOLD 1hr.
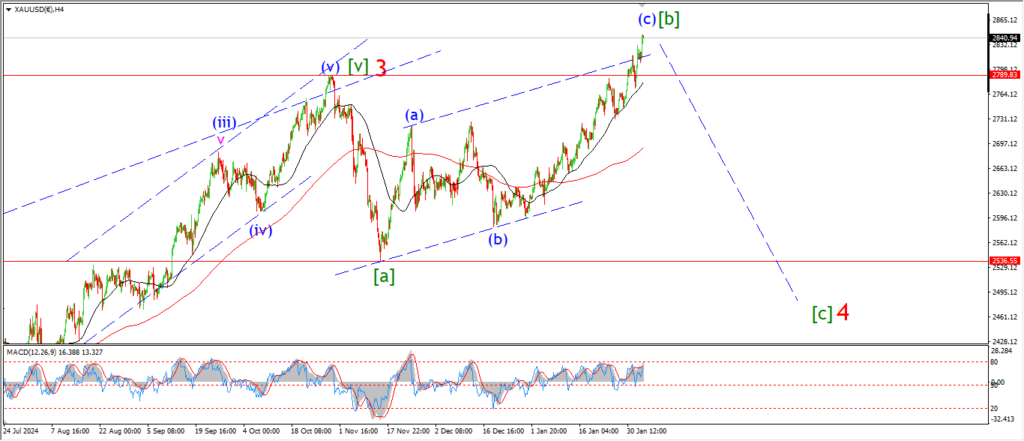
GOLD 4hr.
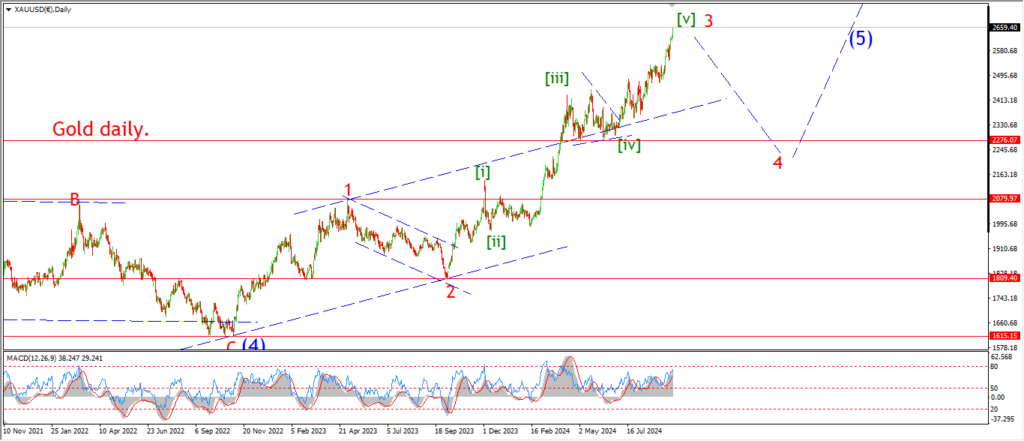
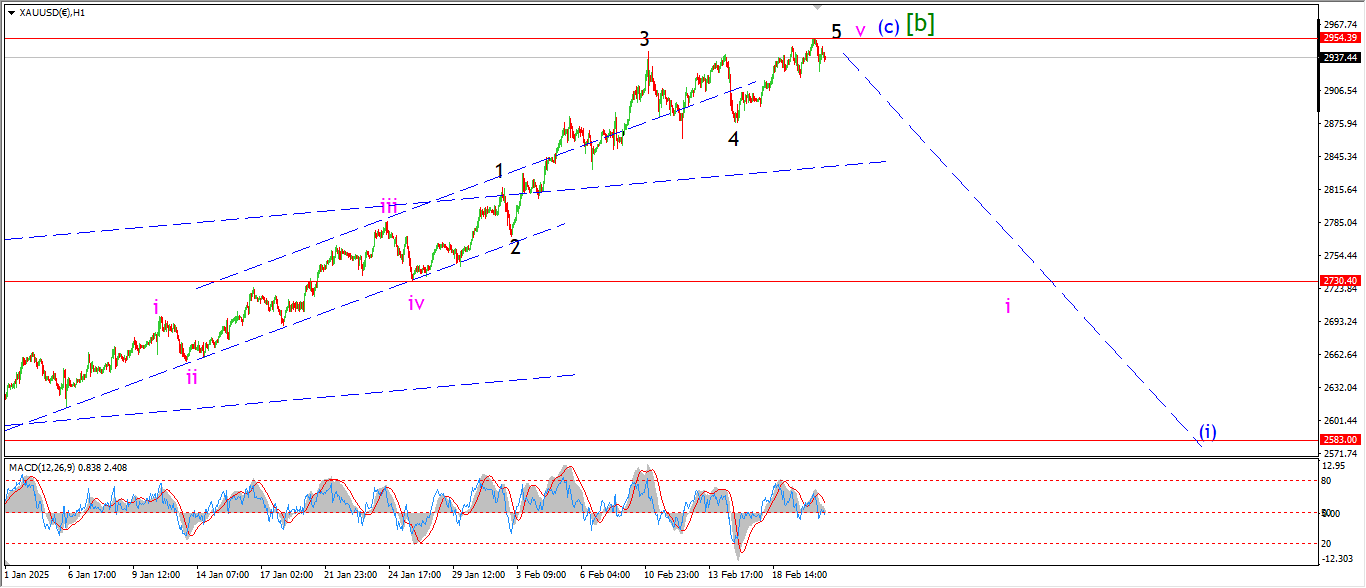
GOLD daily.
Gold is stuck in that sideways pattern at the highs again today.
I can only suggest that wave ‘4’ and ‘5’ have shifted form,
and the top is delayed again.
The only thing left to do here is to roll over off that top.
And if that does not happen soon,
then I will revisit the larger pattern again to see if the wave ‘3’ rally is actually still in play here.
In that case wave ‘4’ will begin soon anyway,
but the pattern will be much different.
So I am expecting this week to clear up the internal dilemma I am grappling with!
tomorrow;
Watch for wave (c) of [b] to make good on its promise and turn this price lower again to begin wave (i) of [c] by the end of this week.
CRUDE OIL.
CRUDE OIL 1hr.
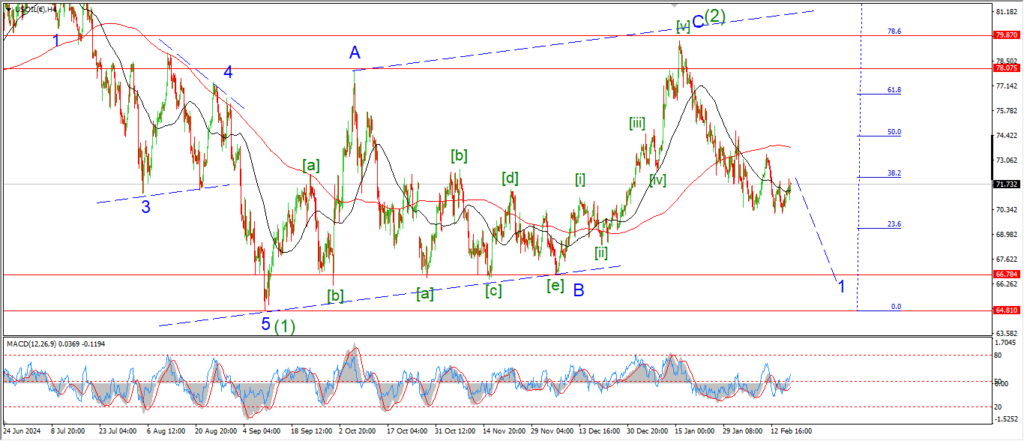
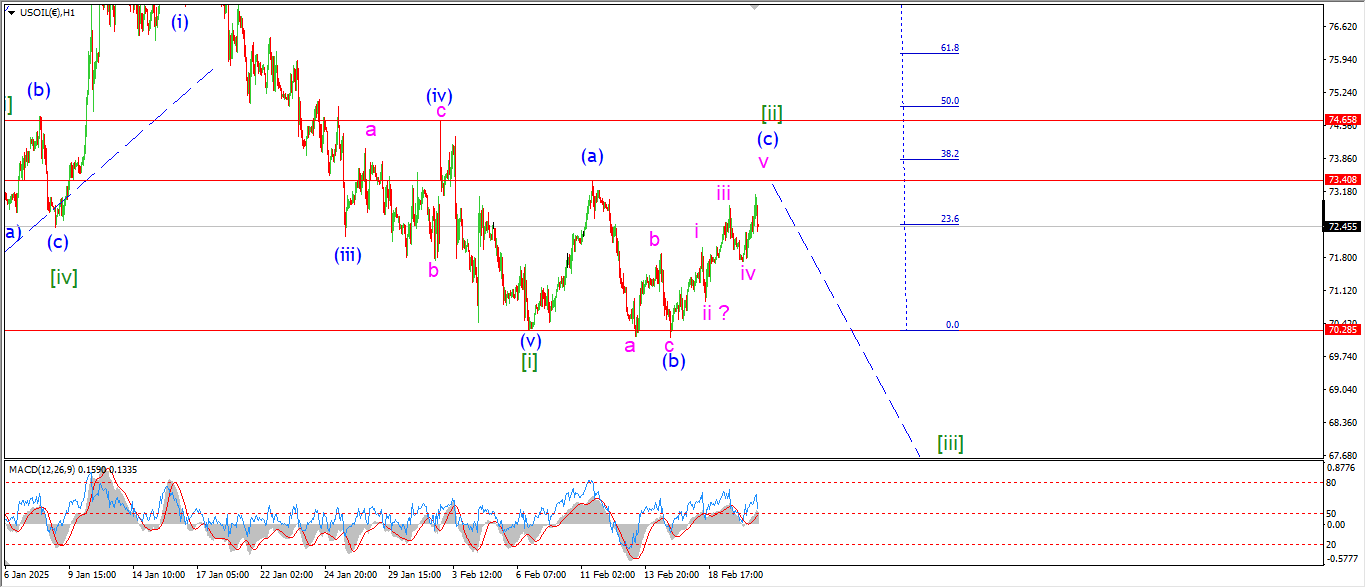
CRUDE OIL 4hr.
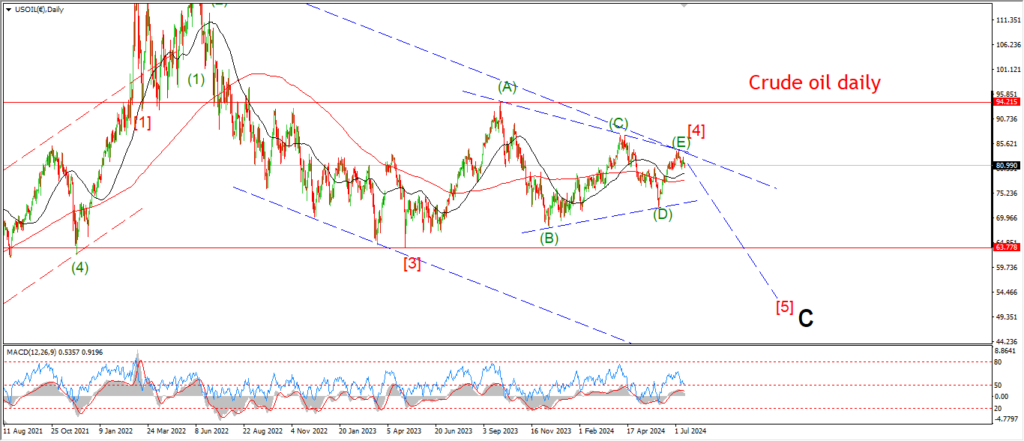
CRUDE OIL daily.
The action in crude moved against the pattern that I was working with today.
This action suggests a larger wave [ii] is actually in play here.
I have switched to that idea now,
and it may be that wave (c) of [ii] is topping as I write tonight.
the price has traced out a five wave rally this week in wave (c),
however the pattern of wave (c) is an ending diagonal or wedge,
This pattern involves an overlap of the internal waves,
and more often than not,
this wave can be confused with a standard correction higher.
If this new pattern is correct,
then wave [ii] of ‘3’ is topping now.
And wave [iii] down should get underway before the end of this week.
Tomorrow;
watch for wave (c) to top out and complete wave [ii] as shown.
A break of 70.00 again will signal wave [iii] is underway.
S&P 500.
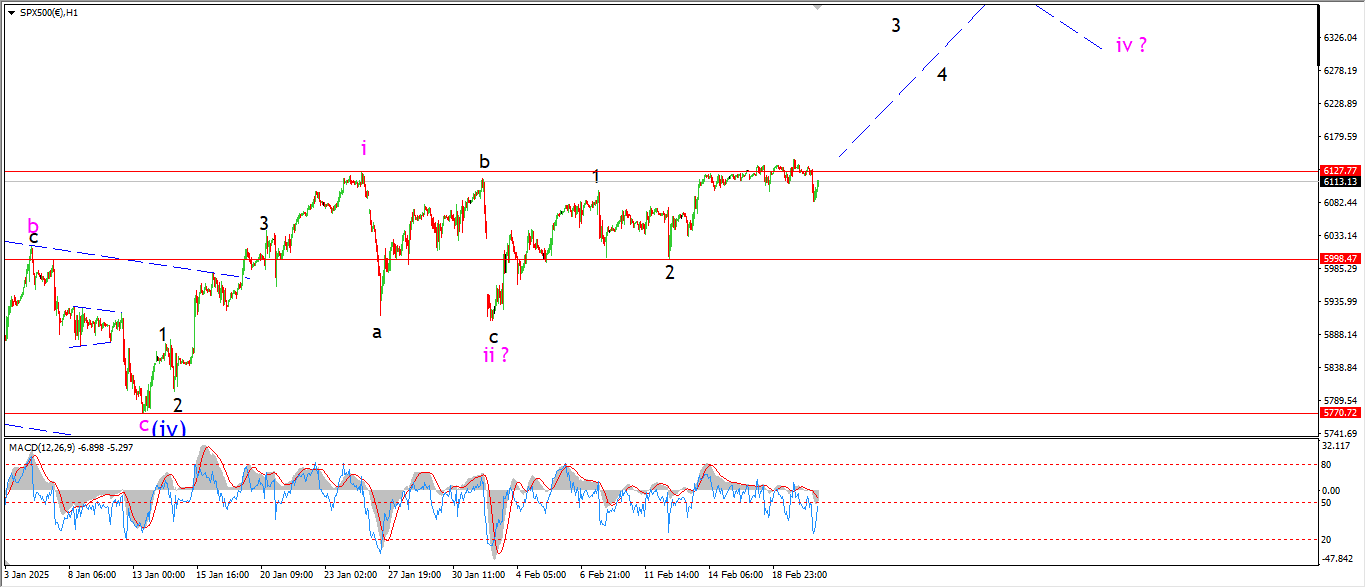
S&P 500 1hr
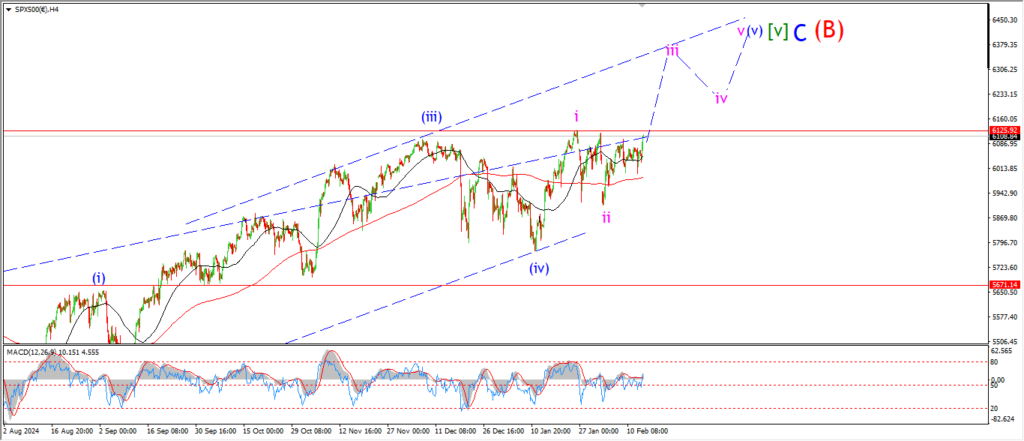
S&P 500 4hr
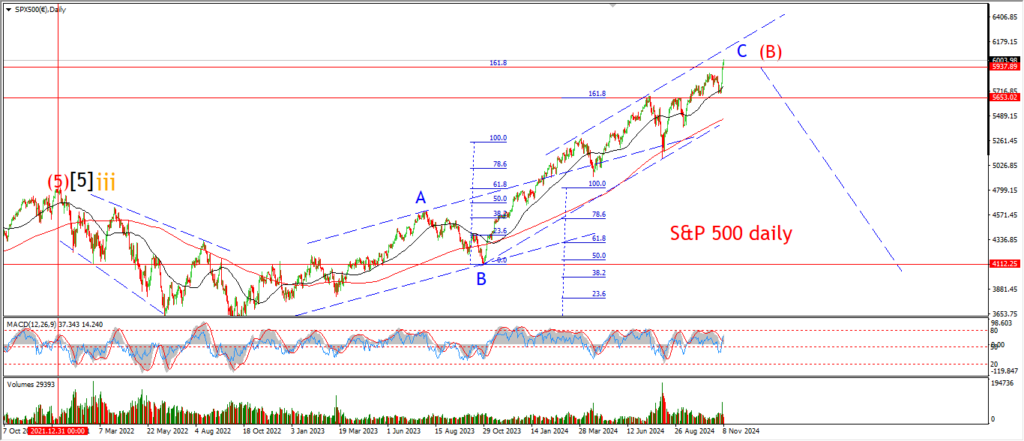
S&P 500 daily.
Another day without confirmation of this pattern in wave ‘iii’.
an extended failure like this always adds raises the question of validity for the main count.
So I am just going to let this market prove itself from here,
without making any predictions outside of what the pattern shows.
Wave ‘iii’ pink must carry this market higher if it is correct,
if that does not happen,
then the pattern is wrong.
Tomorrow;
Watch for wave ‘2’ of ‘iii’ to hold and wave ‘3’ up to continue higher to confirm the pattern.
SILVER.
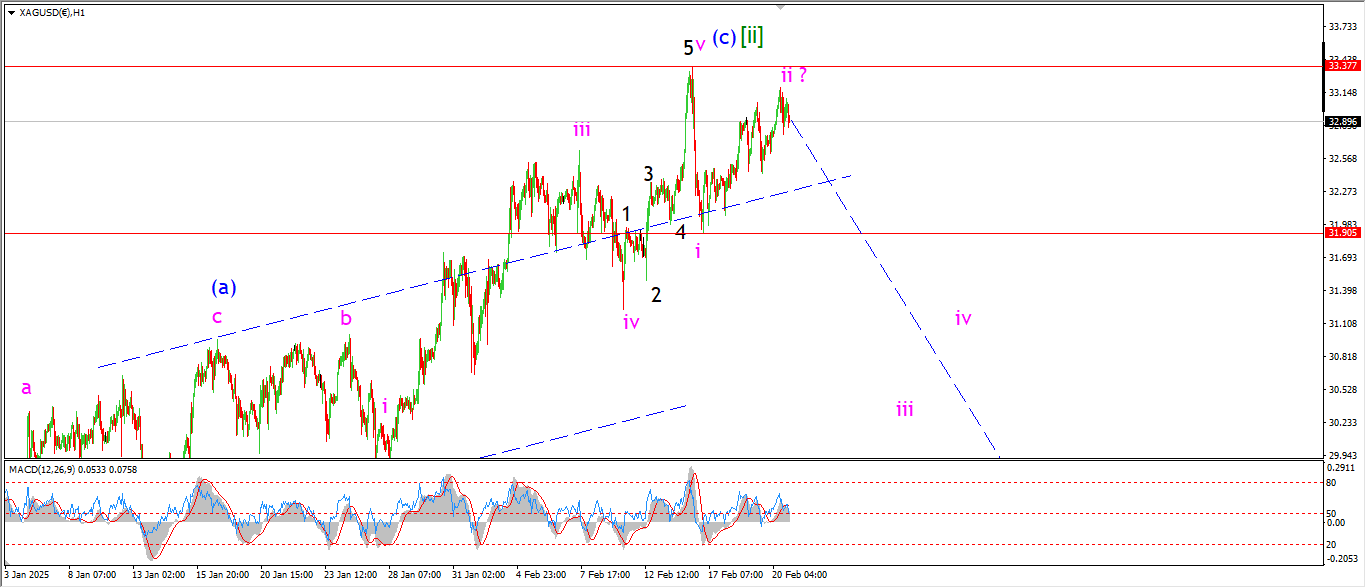
SILVER 1hr
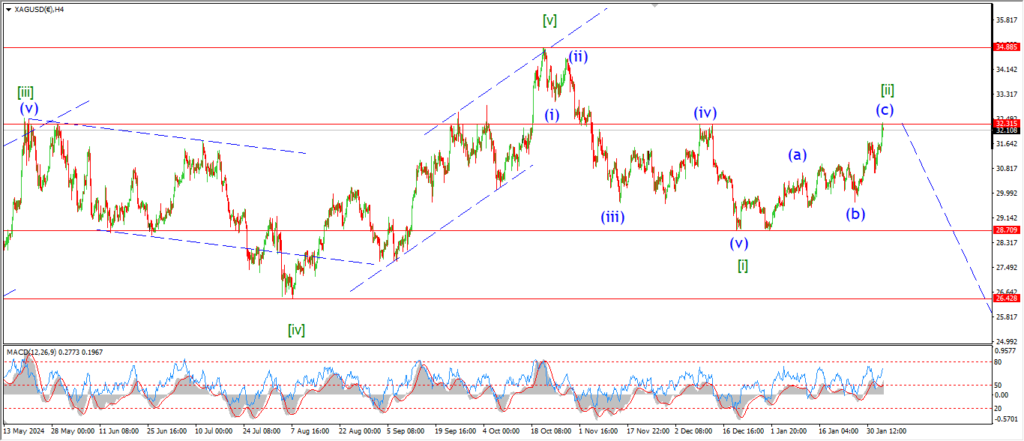
SILVER 4hr.
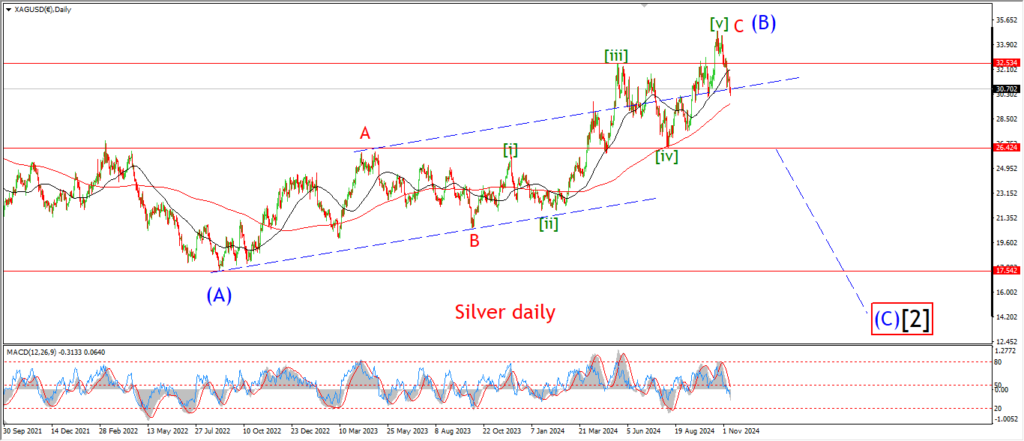
SILVER daily.
Silver is holding the lower high in wave ‘ii’ again today.
the price has not dropped into wave ‘iii’ yet.
But there is room to move here as long as that high holds at wave (c).
The next leg in this pattern is wave [iii] down,
and that wave will be confirmed with a break below the wave [i] low at 28.70.
So there is a significant move lower required here overall.
That may explain the delay!
Tomorrow;
Watch for wave [ii] to hold at 33.37.
Wave ‘iii’ of (i) must now fall back to break 31.90 to signal the turn down has begun.
BITCOIN
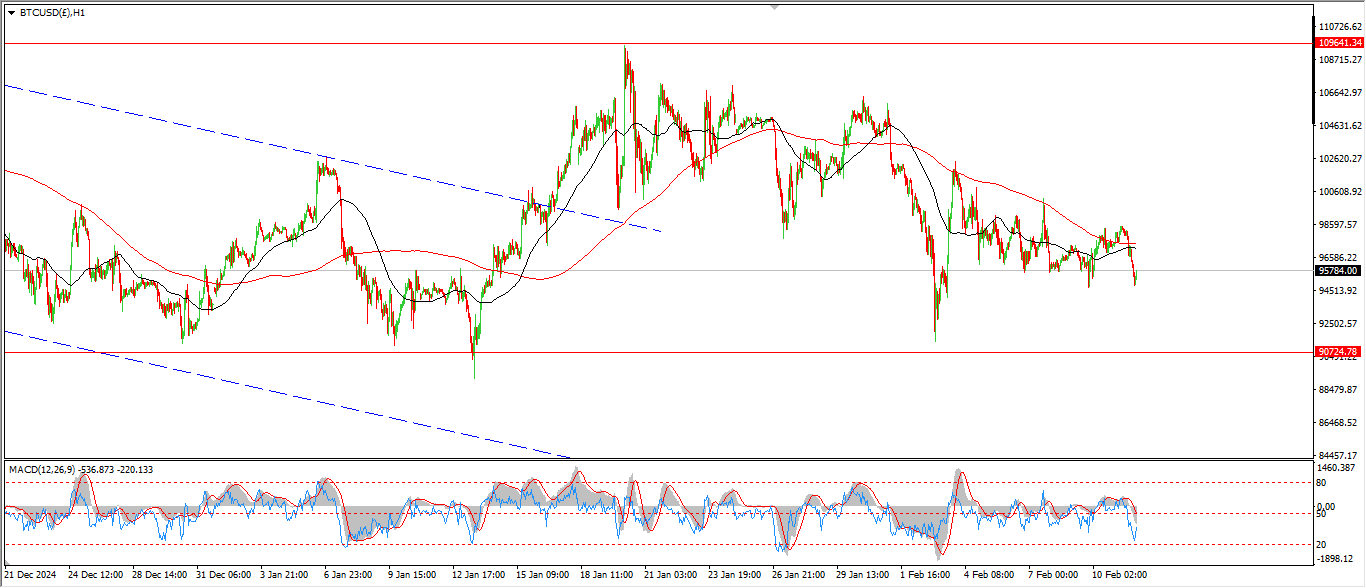
BITCOIN 1hr.
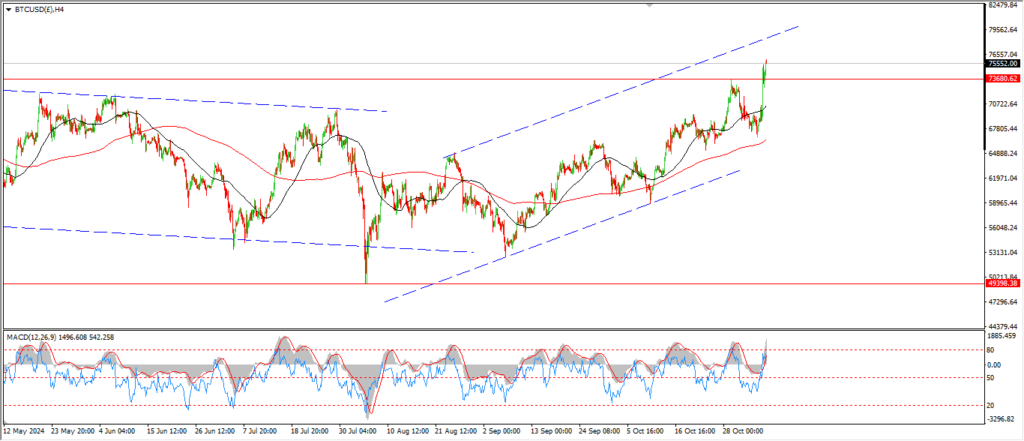
BITCOIN 4hr.
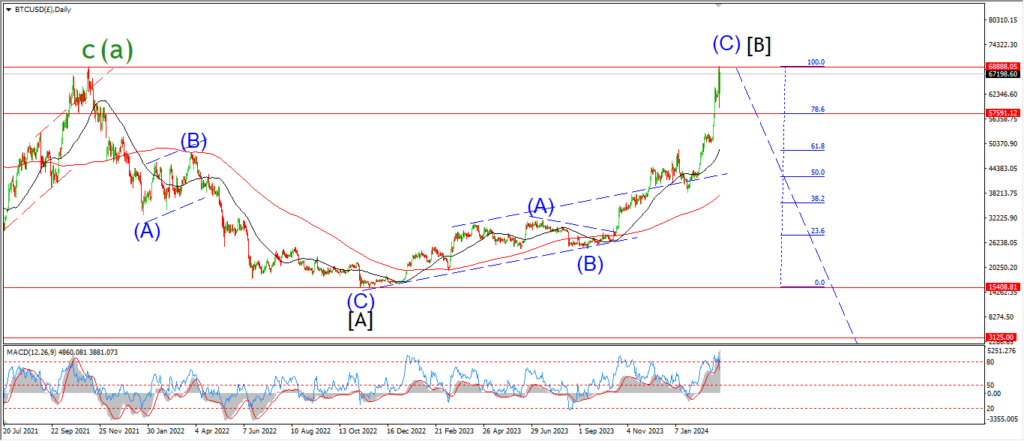
BITCOIN daily.
….
FTSE 100.

FTSE 100 1hr.
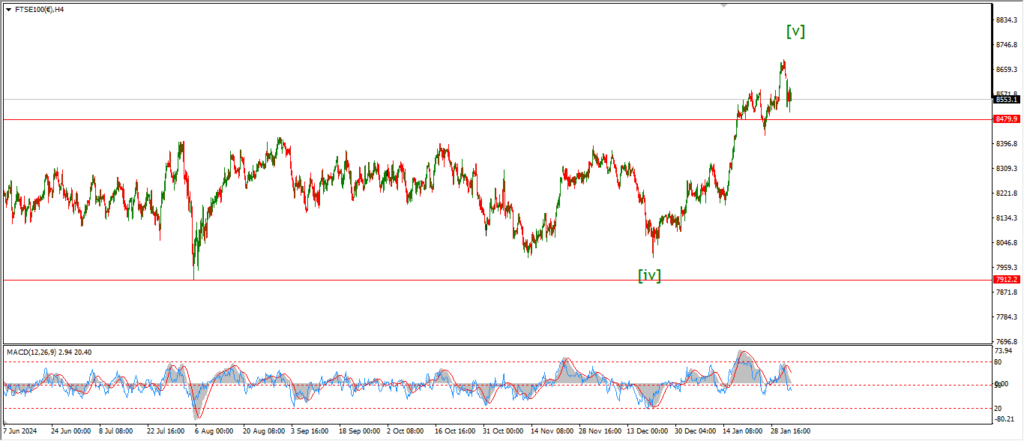
FTSE 100 4hr.
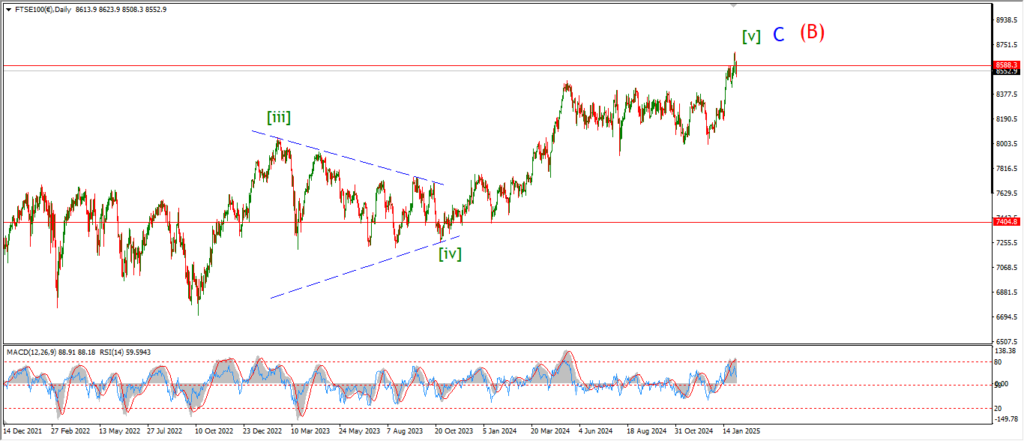
FTSE 100 daily.
….
DAX.
DAX 1hr
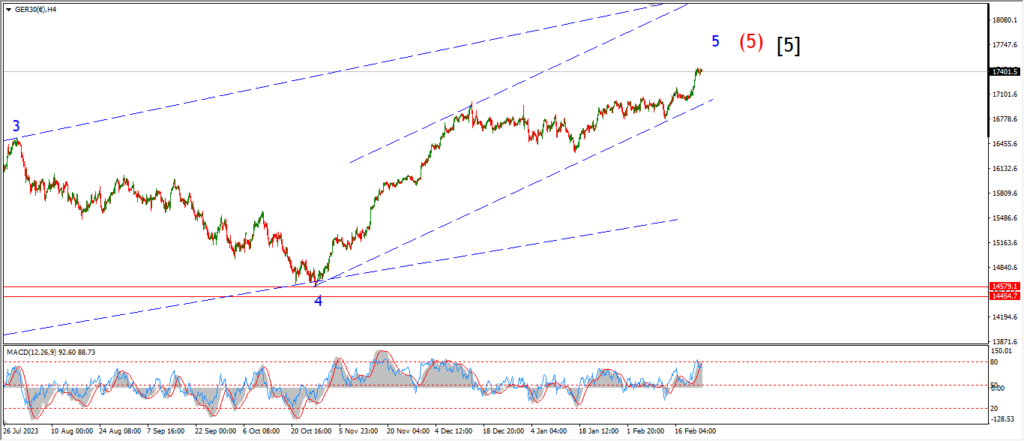
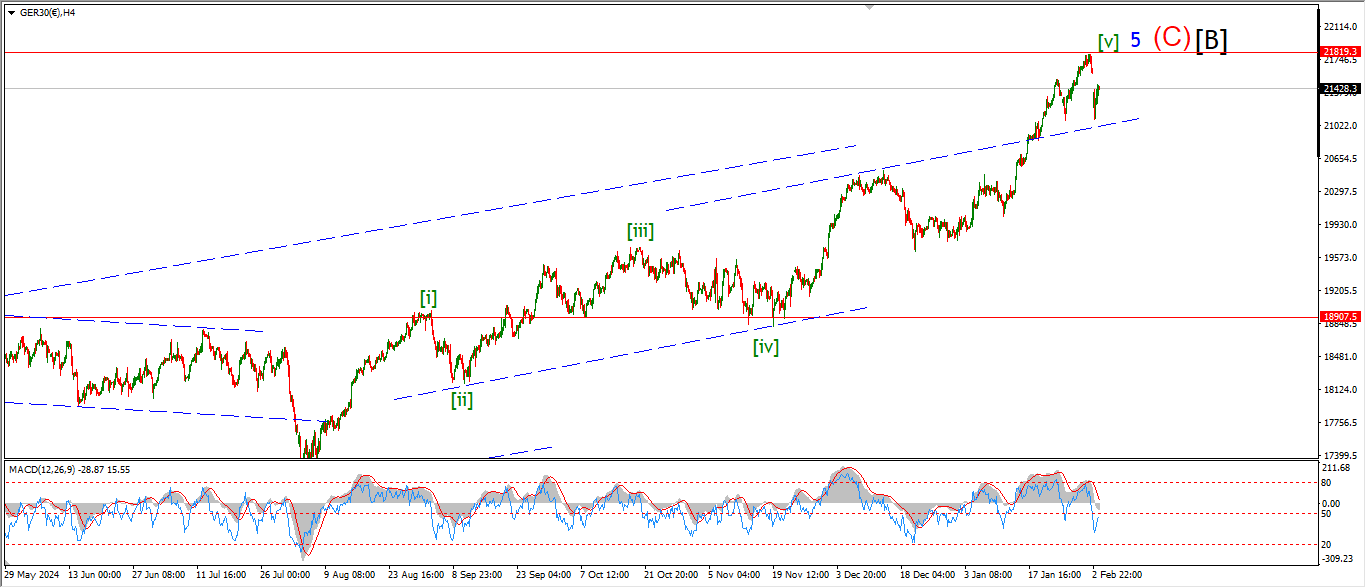
DAX 4hr

DAX daily.
….
NASDAQ 100.
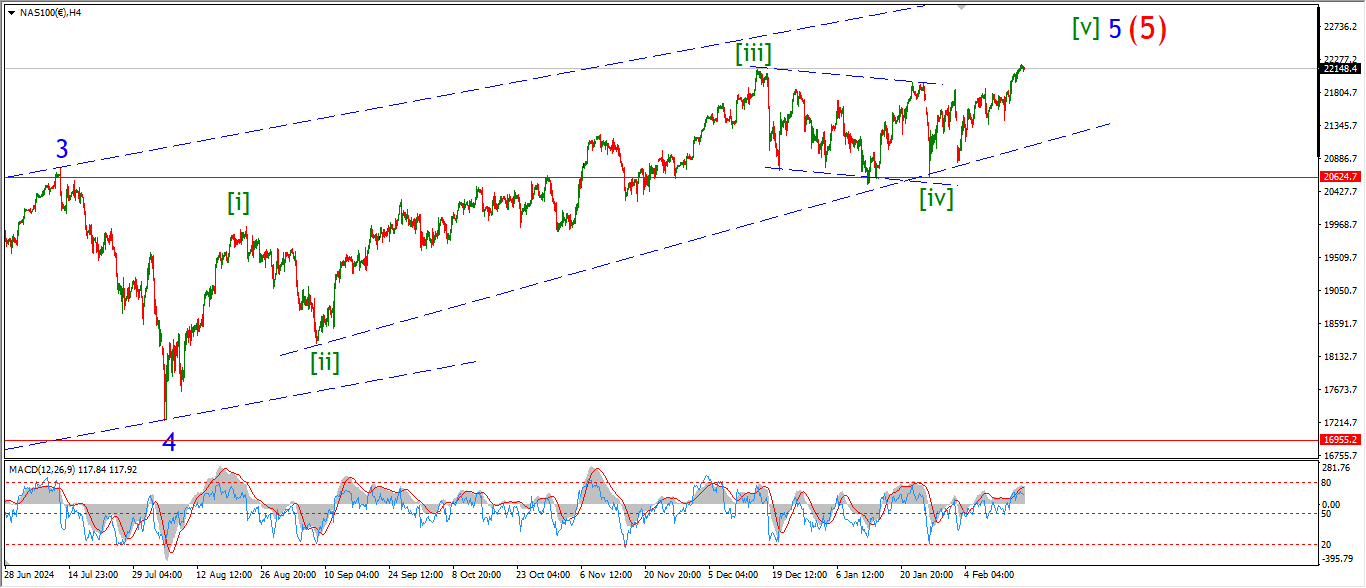
NASDAQ 1hr
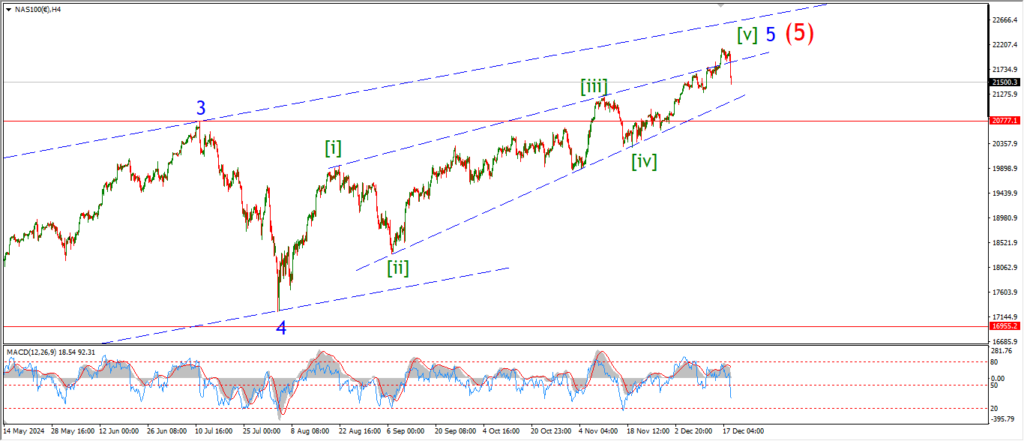
NASDAQ 4hr.
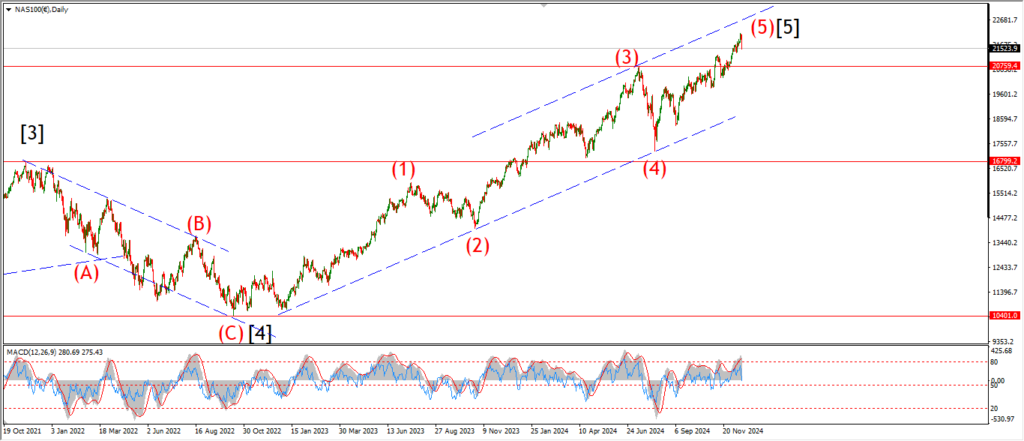
NASDAQ daily.
….