
Good evening folks and the Lord’s blessings to you.
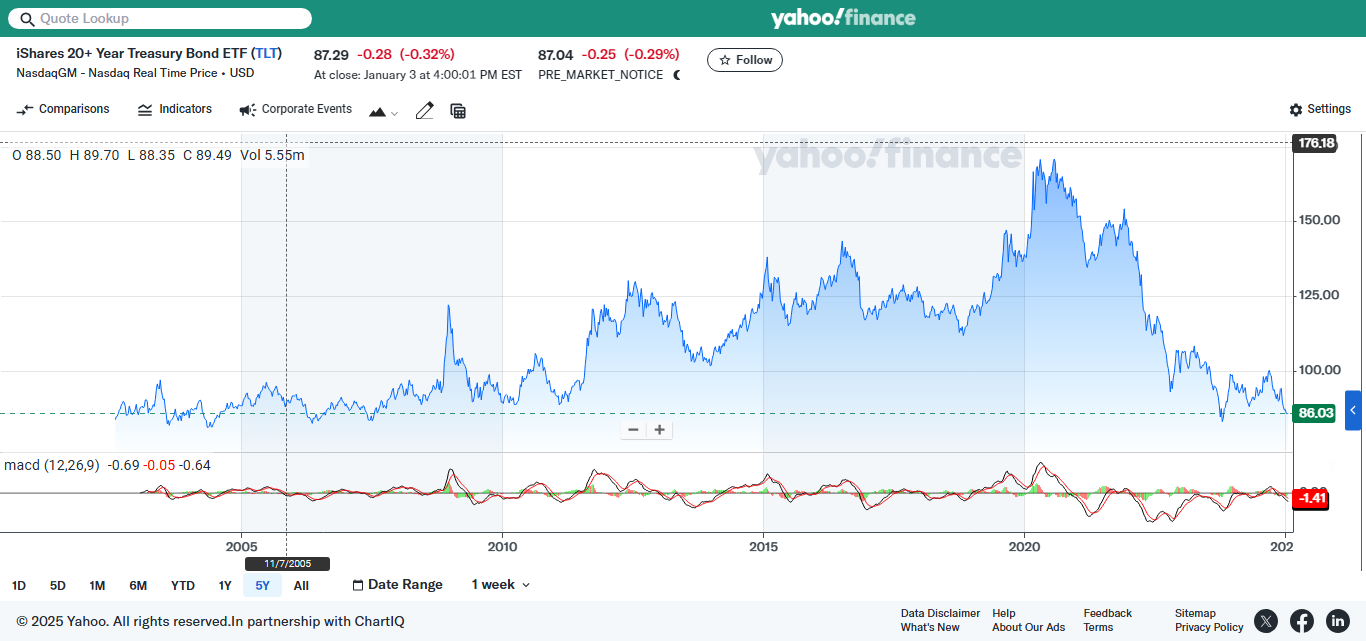
I didn’t comment on the this TLT chart last night because I thought it had shock value all on its own!
but I realise now that some context is needed here.
I have mentioned that I am looking at TLT building a possible second wave higher low at this very moment.
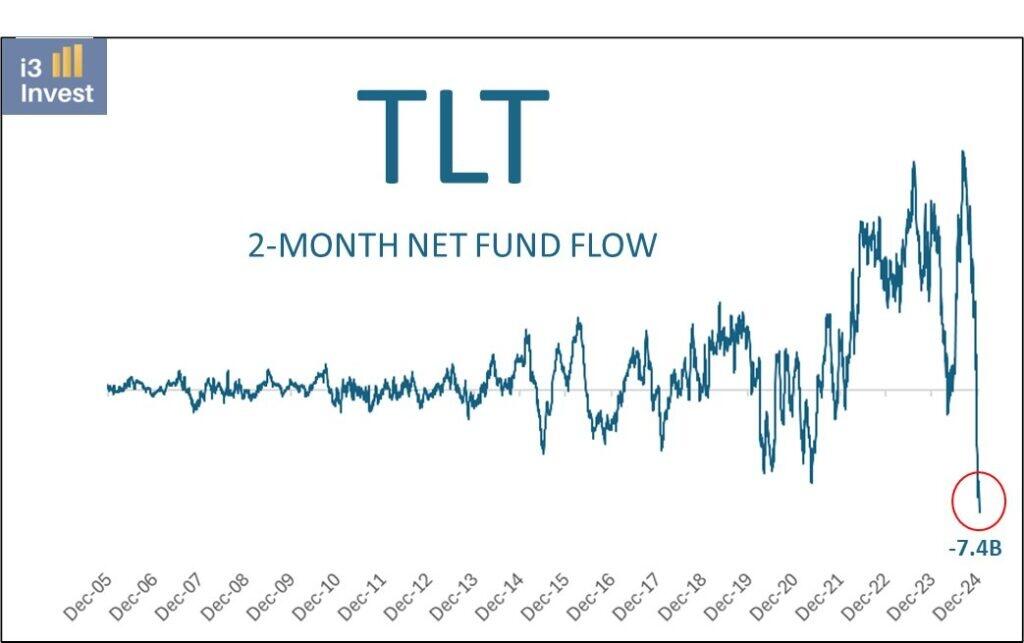
And now we learn that this fund has suffered the largest outflows in its history in the last 2 months!
I dont know that the current lows will hold, but I do know that a perfect setup is building here.
EVERYONE HATES BONDS!!!!
TLT is sitting near 20yr lows.
It just seems like the selling is all but done here, we are at peak negative sentiment, and it looks stupid cheap at the moment!
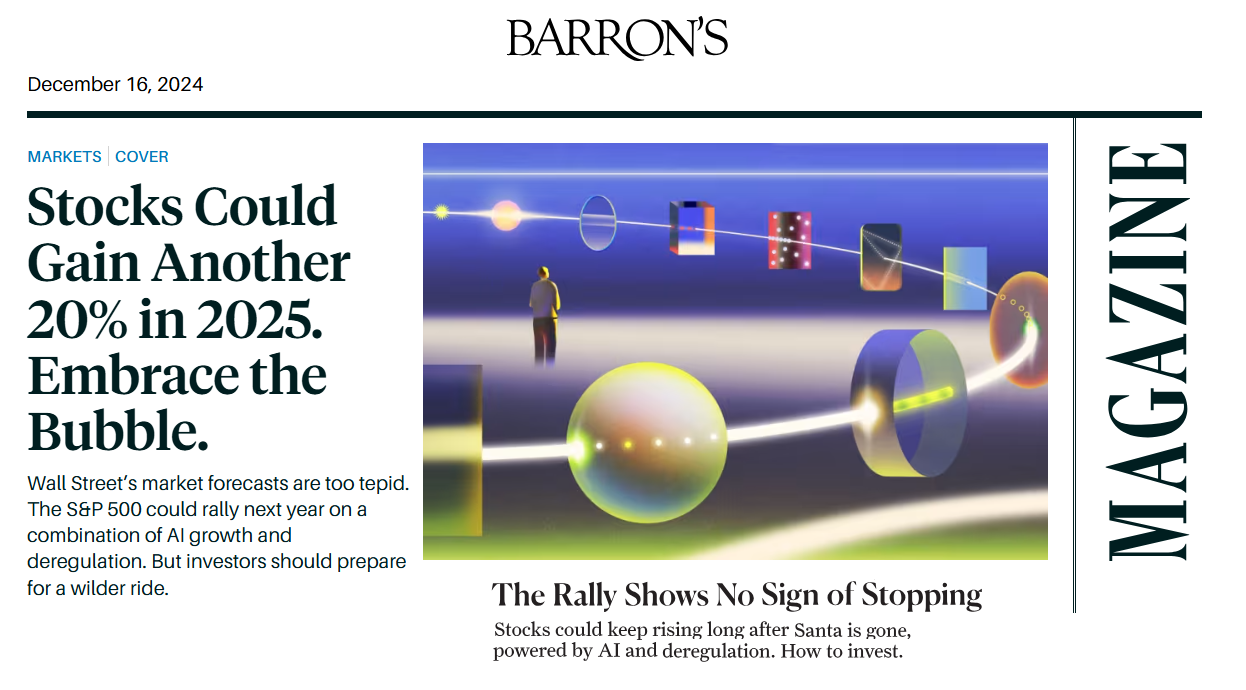
on the flip side the headlines for the stock market seem otherworldly, straight outta 1929, ‘ permanent plateau’ mindset.
Not investment advice, just saying!
EURUSD.
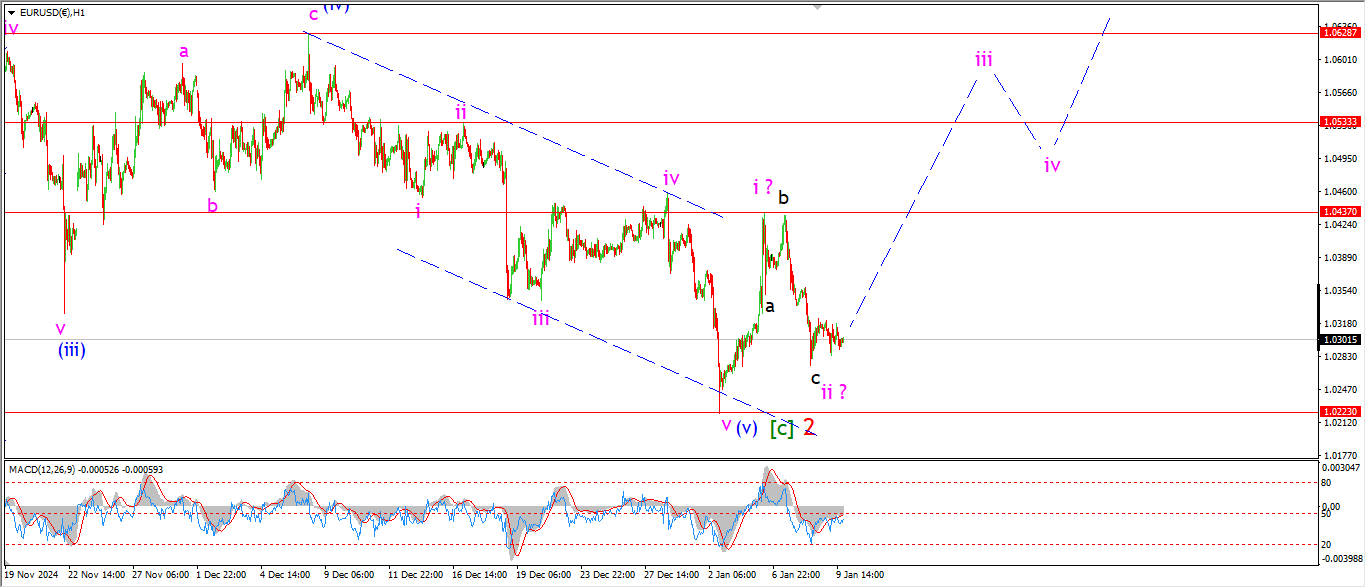
EURUSD 1hr.
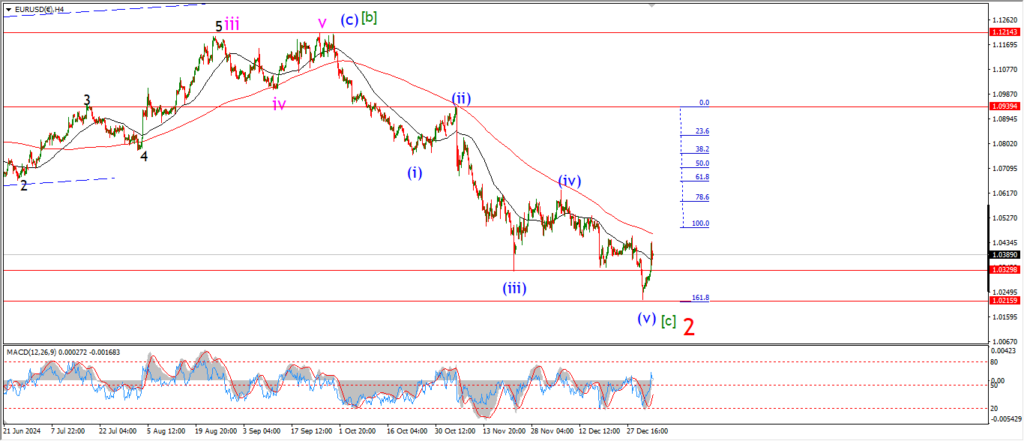
EURUSD 4hr.
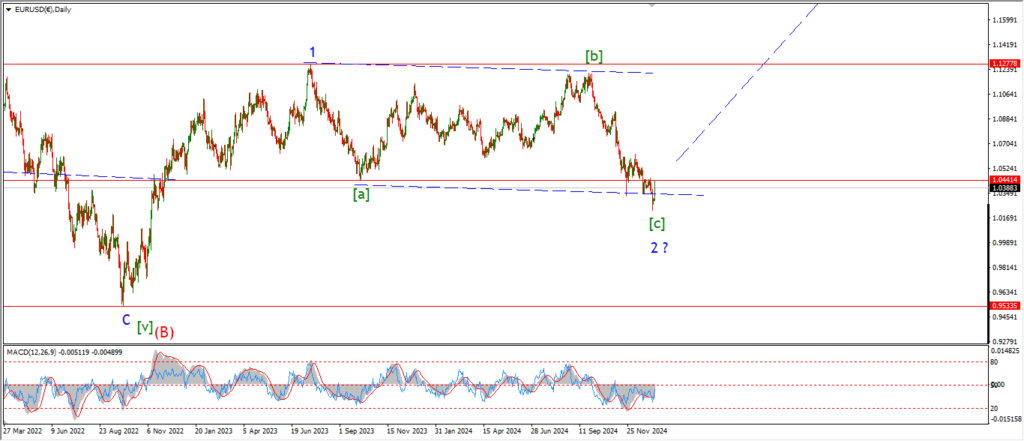
EURUSD daily.
EURUSD moved sideways in a pretty corrective manner today which may point to wave ‘ii’ still in charge here.
Overall, I am still looking for that initial move higher into wave ‘iii’ of (i).
That has not happened yet.
So we are in a danger zone at the moment as the price holds very close above the wave ‘2’ low.
Tomorrow;
Watch for wave ‘ii’ to hold above 1.0223.
Wave ‘iii’ up will move back above 1.0437 again to confirm the pattern.
until that happens,
this count is vulnerable.
GBPUSD
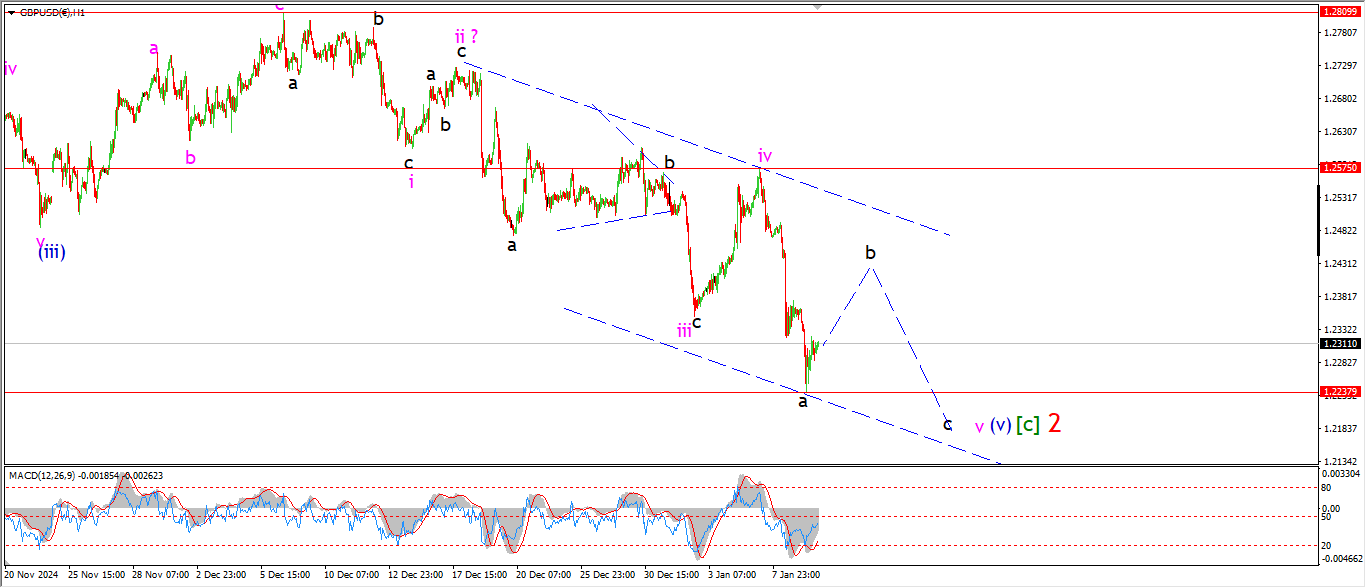
GBPUSD 1hr.
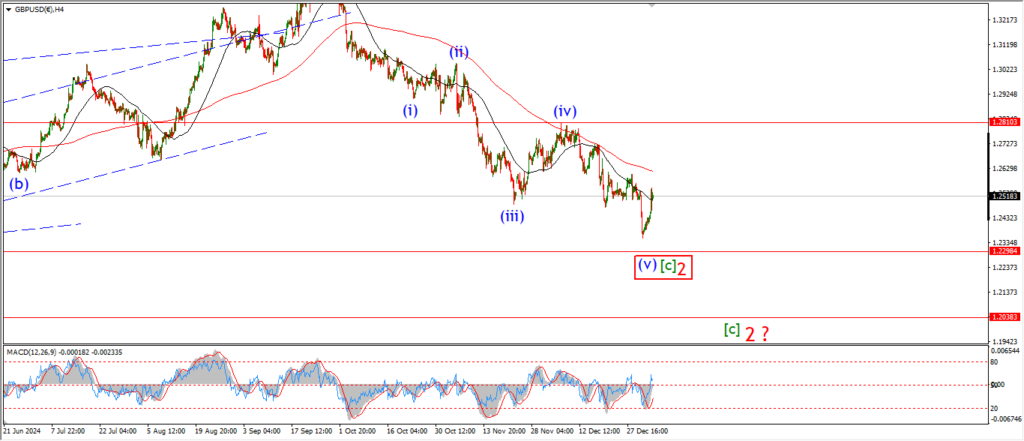
GBPUSD 4hr.
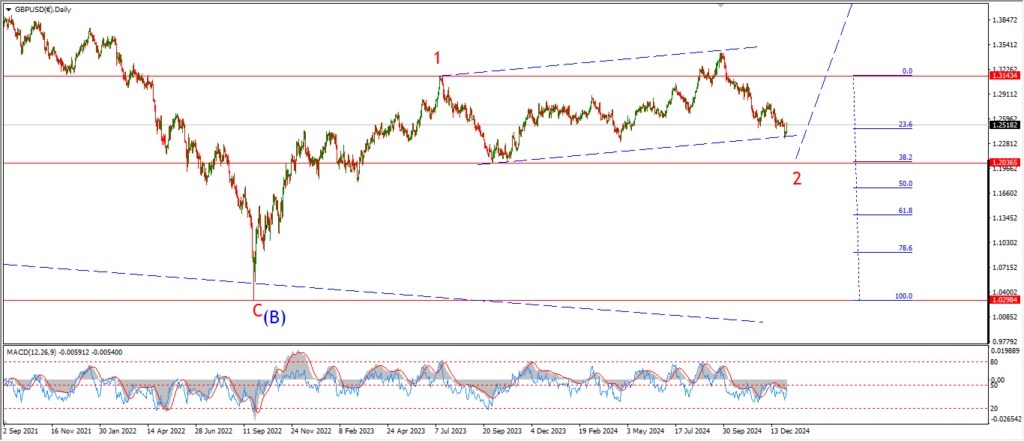
GBPUSD daily.
The count in cable is quite complicated at the moment with a possible expanding wedge in play here for wave (v) blue.
The price hit a new low for wave ‘2’ today at 1.2238.
And if this pattern for wave (v) is correct,
then we should see one more step lower to complete wave ‘c’ of ‘v’.
This pattern will allow for a correction higher into wave ‘b’ over the next few days.
and then wave ‘c’ can wait until next week to make its final low.
Tomorrow;
Watch for wave ‘b’ to move higher in three waves as shown.
We will have to wait until the middle of next week for this pattern to complete.
USDJPY.
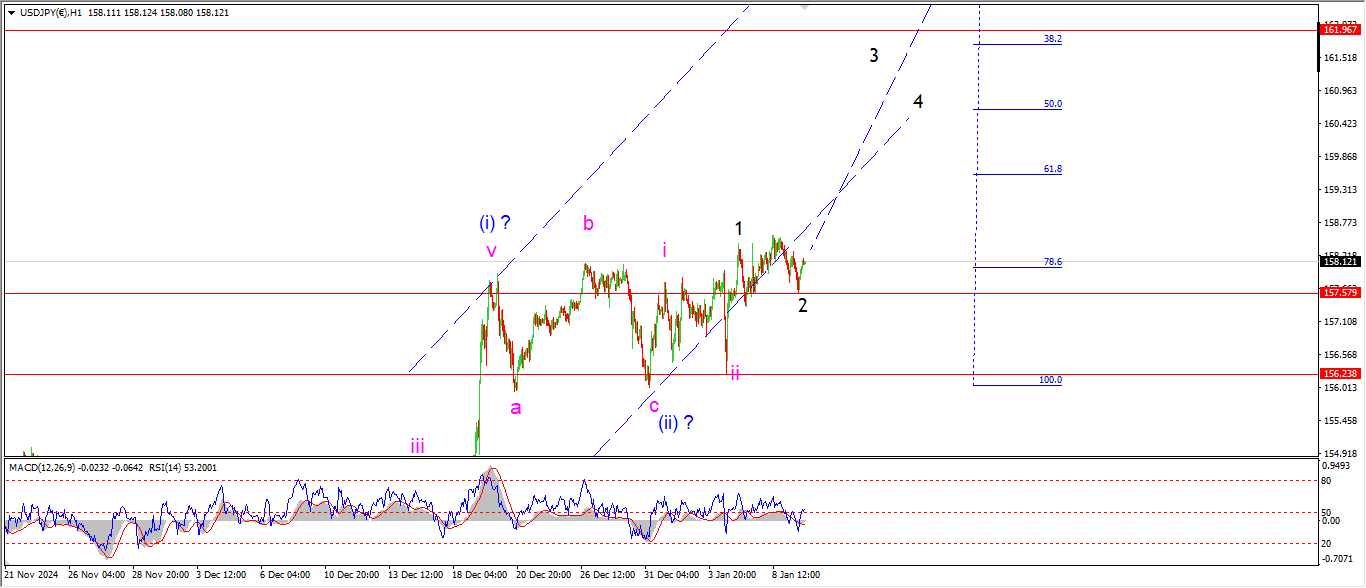
USDJPY 1hr.
USDJPY 4hr.
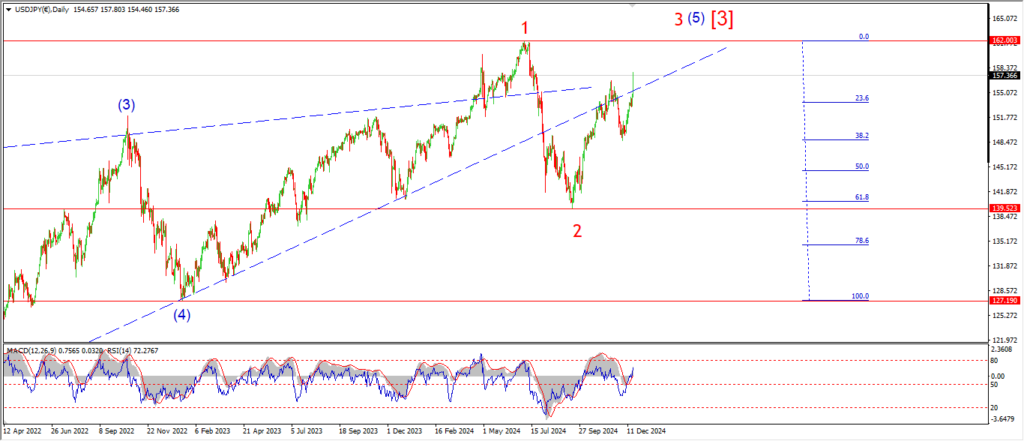
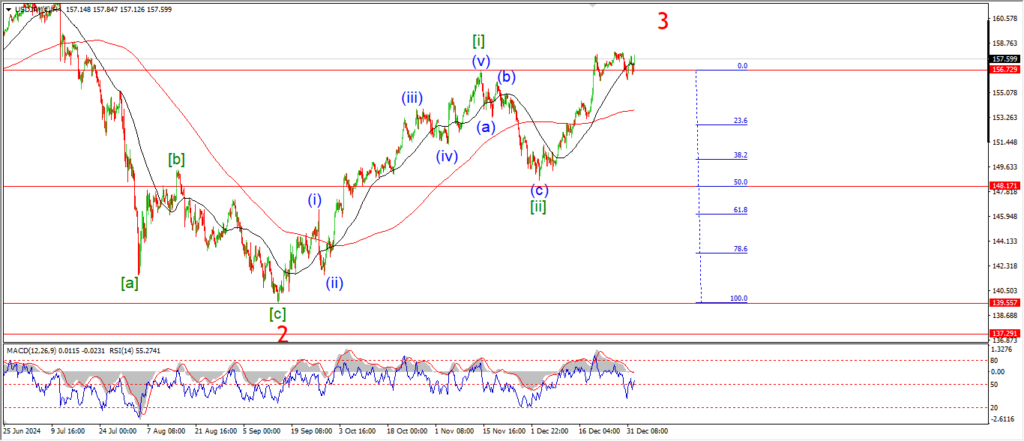
USDJPY daily.
Wave ‘2’ did fall today to complete a running flat correction at 157.58.
Wave ‘3’ of ‘iii’ will move higher again tomorrow if this count is correct.
and from there we should see an acceleration higher next week.
This wave count really must make progress higher soon if I am on the right track here.
and I am acutely aware of the fact that the Atlantic pairs do contradict this count for USDJPY!
Usually we would not see a rally across all three pairs at the same time!
So I may well be proved wrong soon in USDJPY or the previous pairs to bring the wave counts back into line again.
Tomorrow;
Watch for wave ‘ii’ pink to hold at 156.23.
Wave ‘3’ of ‘iii’ must continue higher as shown to prove this count correct.
DOW JONES.
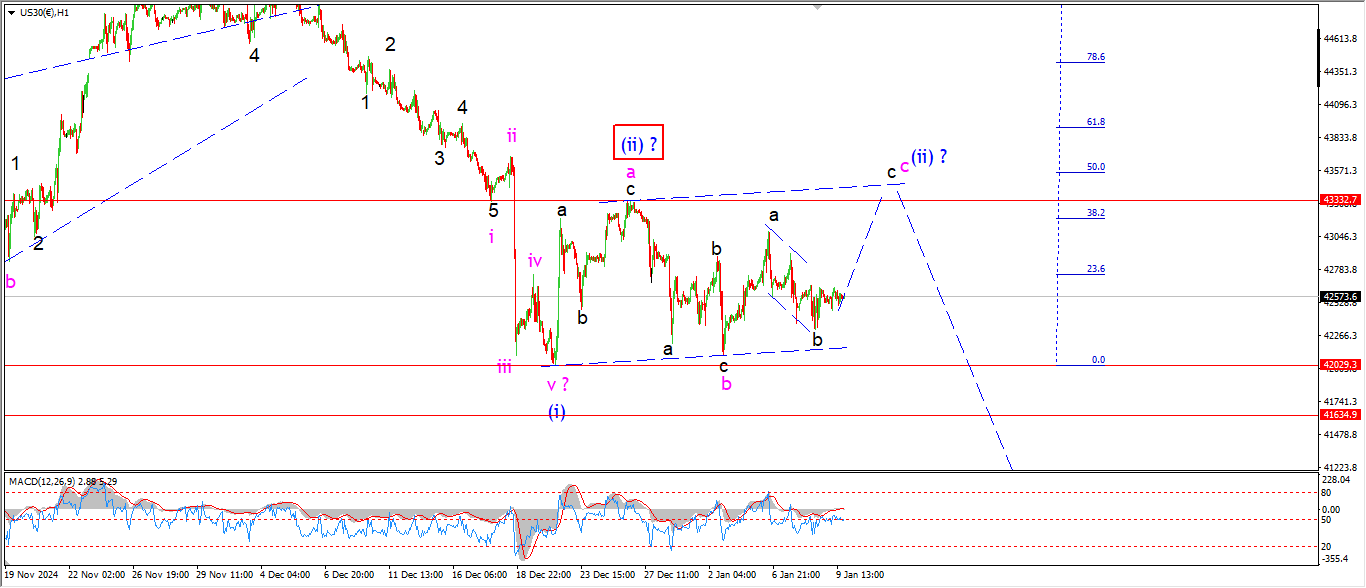
DOW 1hr.
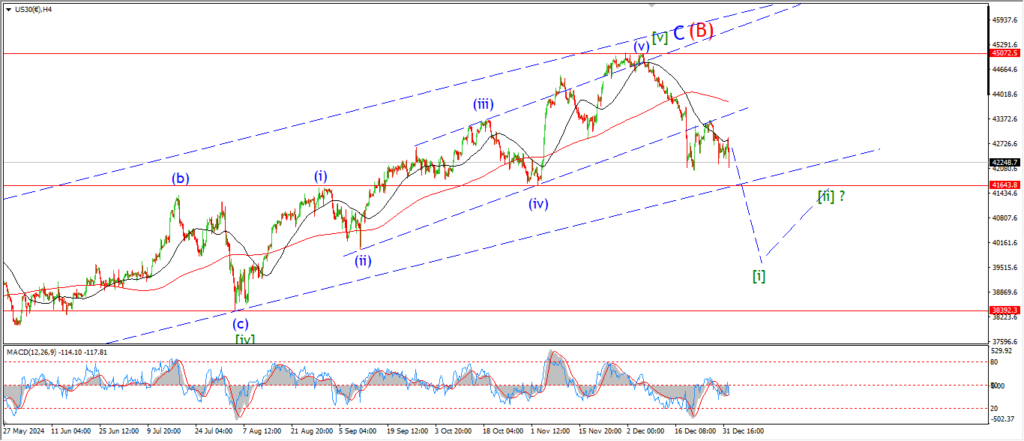
DOW 4hr
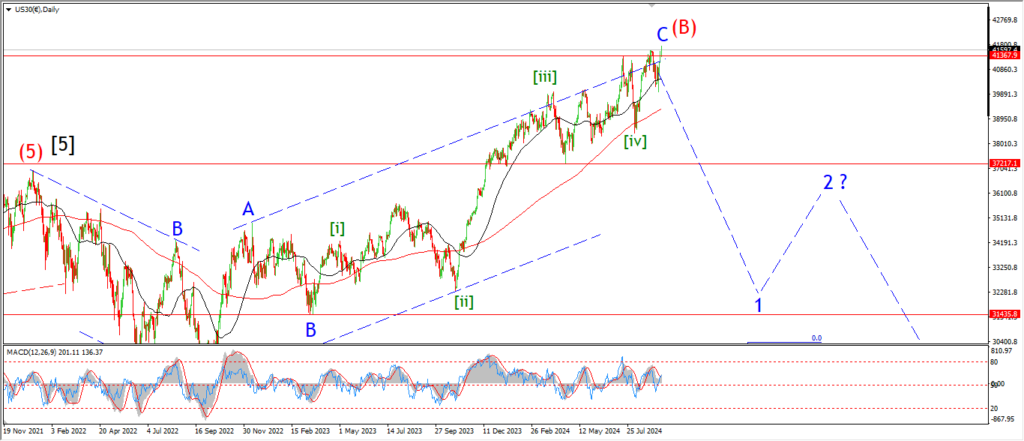
DOW daily.
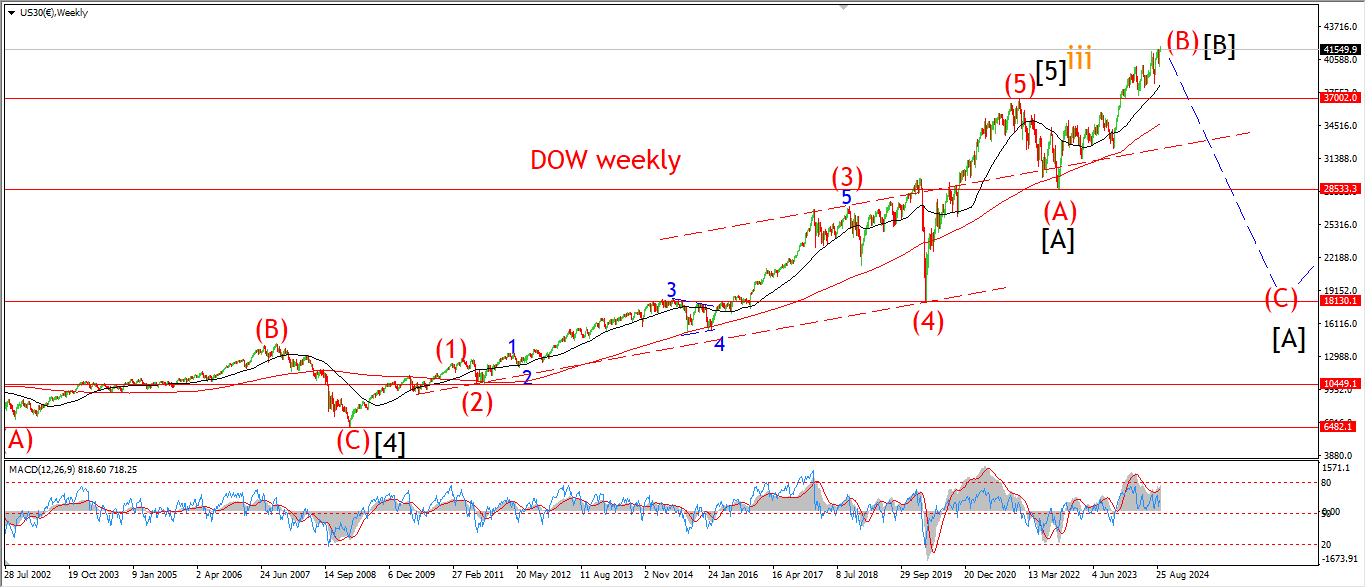
The correction in wave (ii) is shown as a series of threes tonight.
this correction is called a complex combination wave.
Each internal wave completes a standard corrective pattern itself.
Wave ‘a’ is a 5,3,5 zigzag correction.
wave ‘b’ is a 3,3,5 flat,
and wave ‘c’ will be a 5,3,5, also.
If this pattern is correct then we will see a top at above 43500,
and then a major turn lower into wave (iii) next week.
The only problem here is that wave ‘c’ of (ii) is taking its sweet time!
Tomorrow;
Watch for wave ‘c’ of (ii) to run higher to complete the larger corrective pattern.
then it will be time to buckle up for wave (iii) next week.
GOLD
GOLD 1hr.
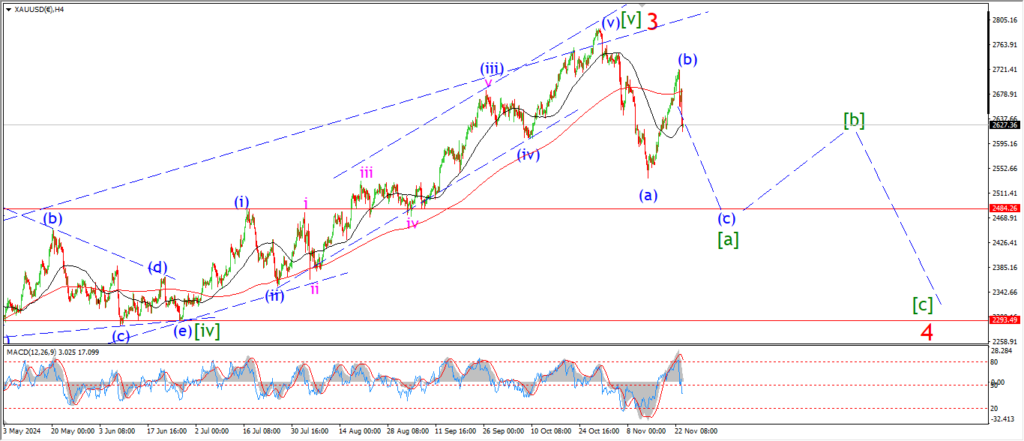
GOLD 4hr.
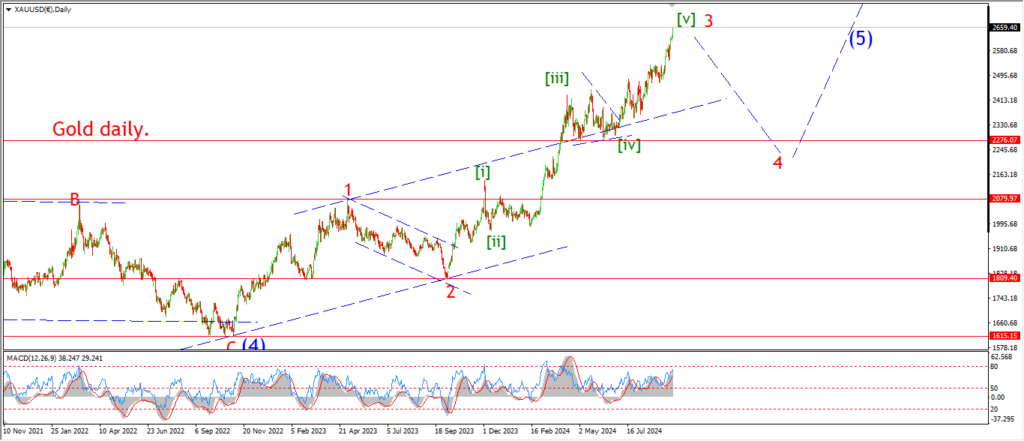
GOLD daily.
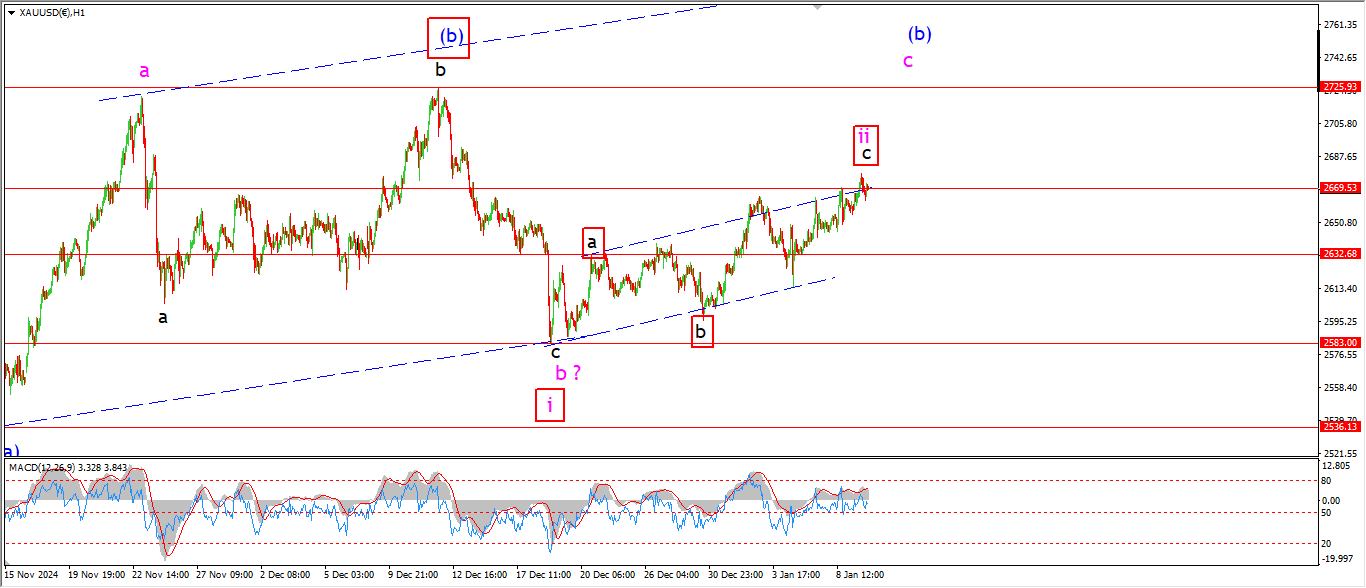
I have labelled the internal waves for the alternate count tonight.
Wave ‘ii’ pink can be broken into a complex correction also.
and at this point the final wave up in wave ‘c’ of ‘ii’ has completed at the upper trend channel line.
The overall action this week has been corrective to the upside,
and the main count has not taken over in an impulsive rally in wave ‘c’ of (b).
So,
I think it is at lesat worth considering the alternate with a little more seriousness.
Tomorrow;
If the price drop back below 2630 again at the wave ‘a’ higher,
then I will trigger this alternate count.
CRUDE OIL.
CRUDE OIL 1hr.
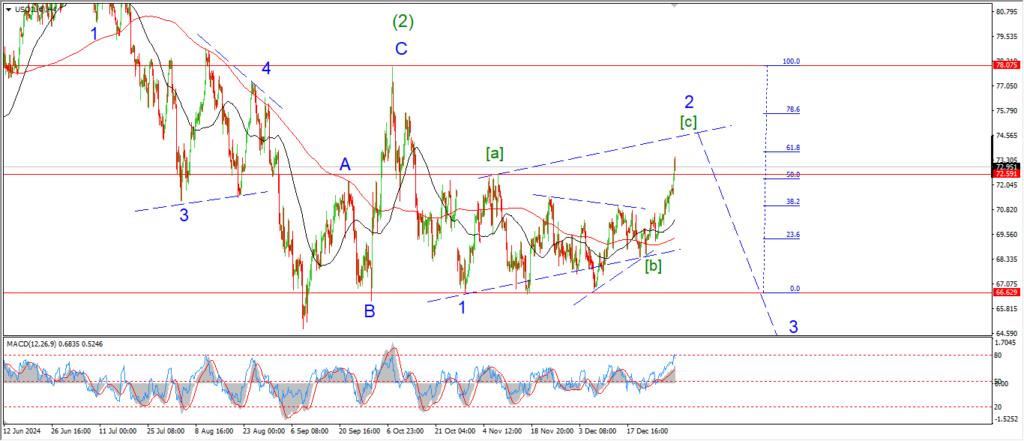
CRUDE OIL 4hr.
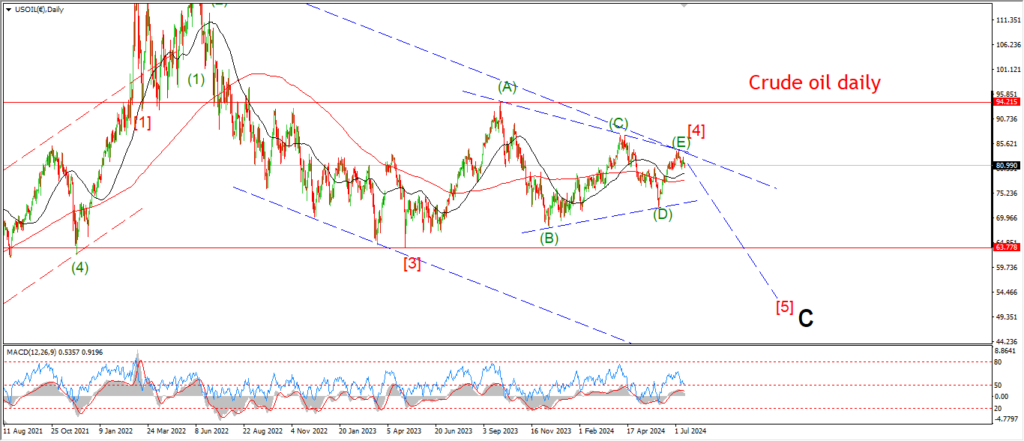
CRUDE OIL daily.
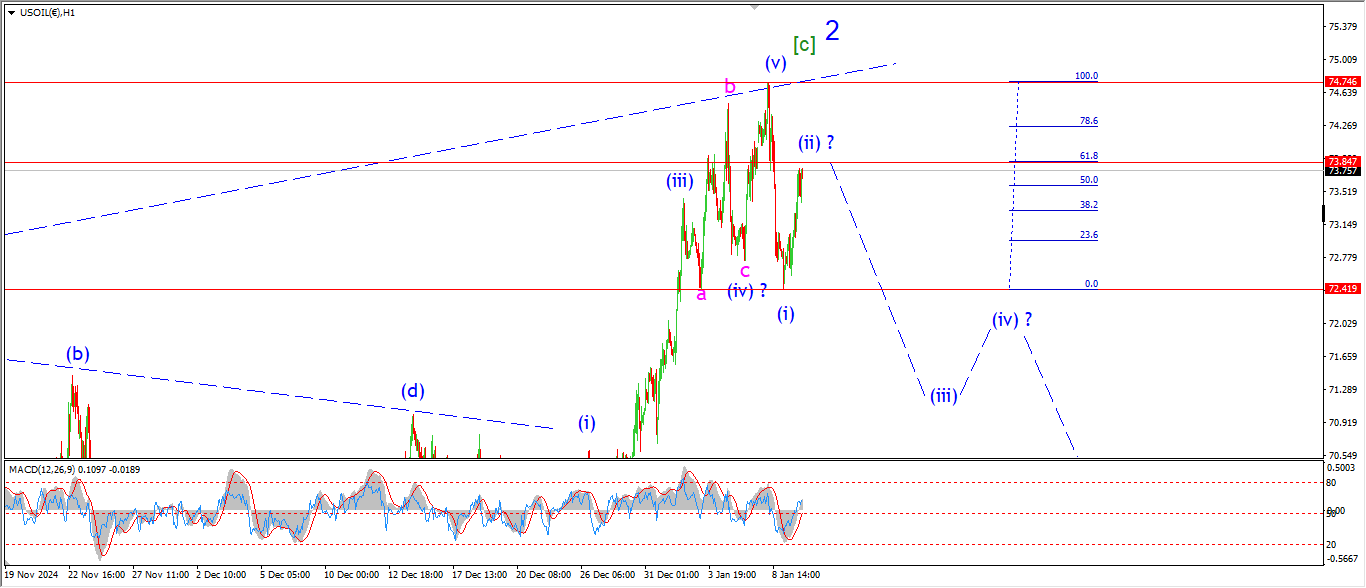
The rebound into wave (ii) came quick!
The price has already reached a point which satisfies a second wave rally.
the price has hit the 62% retracement of the wave (i) decline at todays highs.
so,
if this count is correct,
then we should see another reversal into wave (iii) of [i] starting soon.
Tomorrow;
Watch for wave ‘2’ to hold at 74.75.
Wave (ii) must complete below that level.
And if we see a break of 72.40 again that will signal wave (iii) is underway.
S&P 500.
S&P 500 1hr
S&P 500 4hr
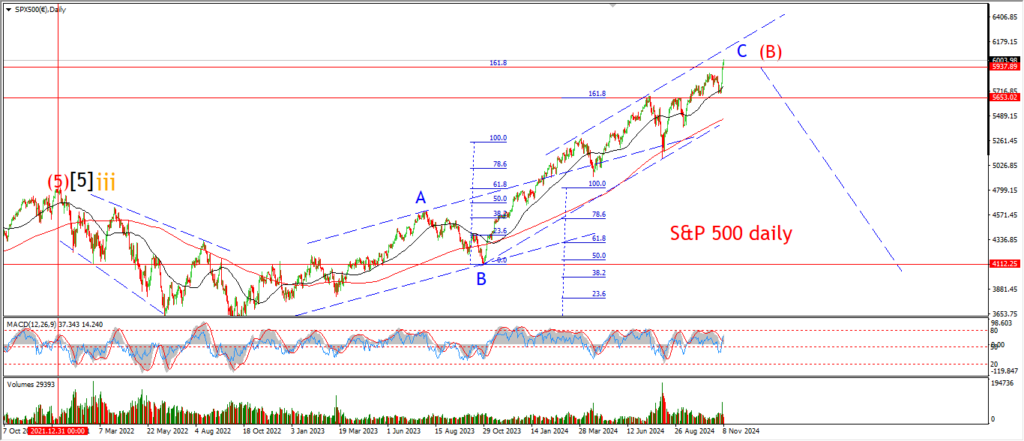
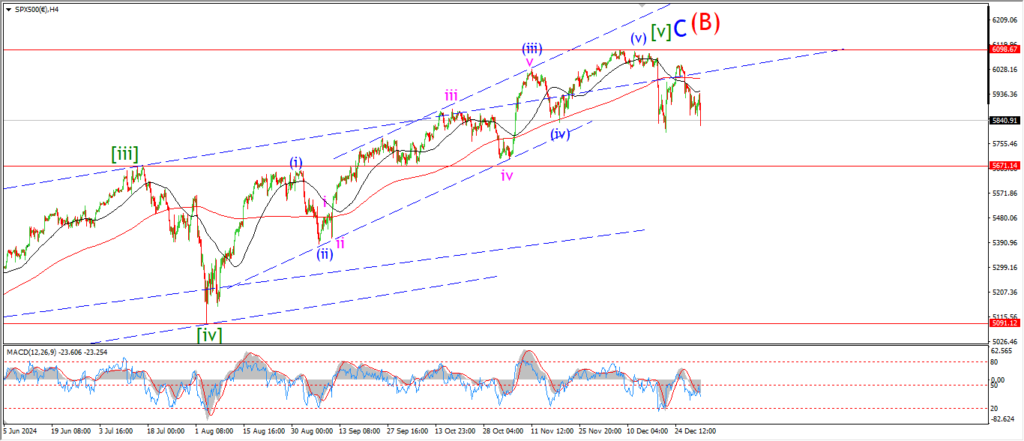
S&P 500 daily.
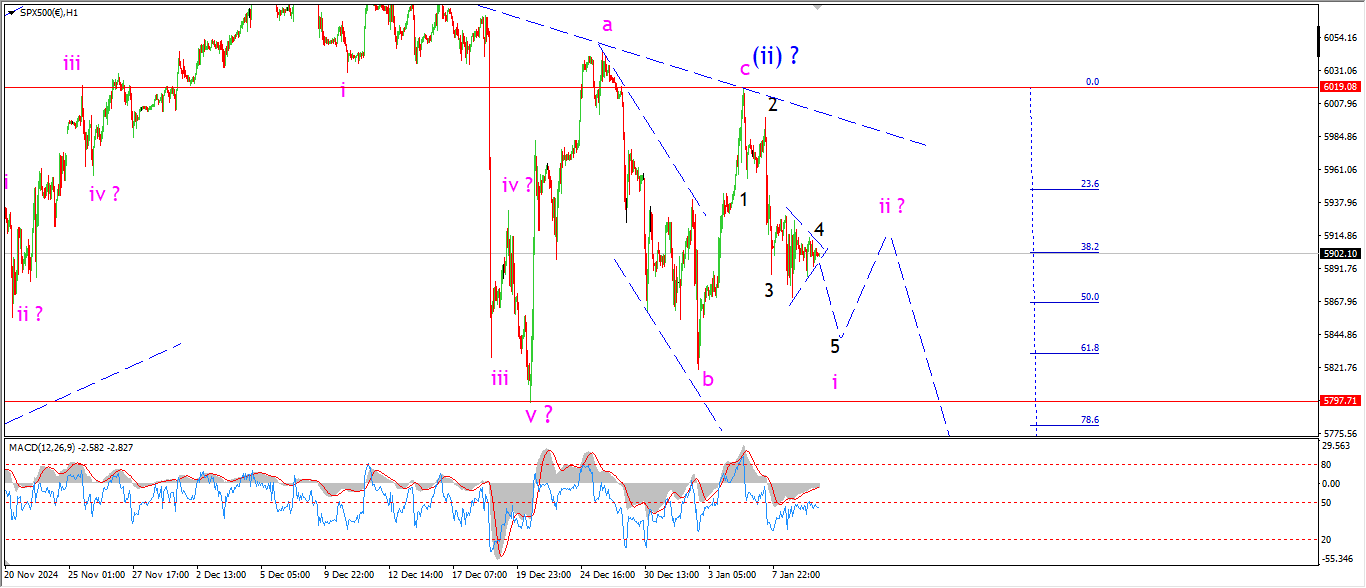
The action in the S&P today is also quite corrective looking now.
The market basically did nothing all day.
and I am suggesting that we have a triangle correction in wave ‘4’ of ‘i’ in play here.
The market should drop again tomorrow to complete wave ‘5’ of ‘i’ in this scenario.
and then I will look for a small correction higher into wave ‘ii’ beginning early next week.
Tomorrow;
Watch for wave ‘i’ to complete with one more step lower towards 5850.
SILVER.
SILVER 1hr

SILVER 4hr.
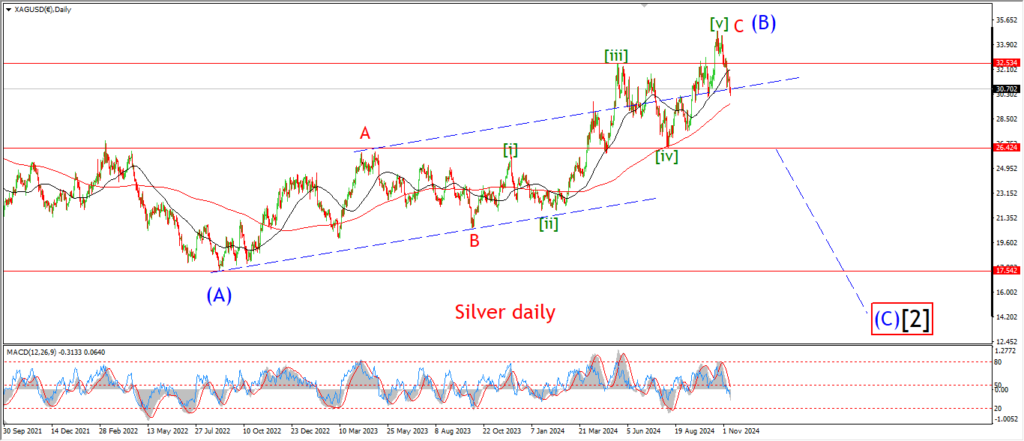
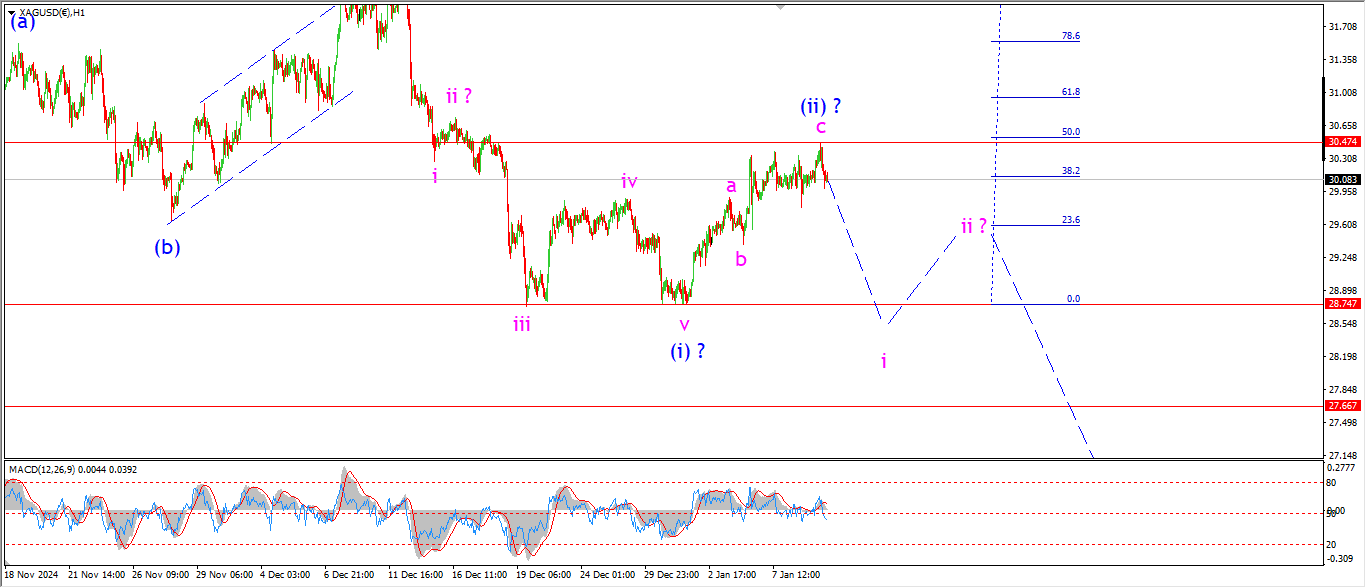
SILVER daily.
Another flat day in Silver which does not help this wave count to be honest.
This sideways action is starting to look more and more like a correction within a wave to the upside.
So,
unless we see a sharp move lower soon,
I think I will be forced to rethink this wave count for wave (ii).
At the moment this count for wave (ii) fits,
but I do not want to see another move higher tomorrow!
Tomorrow;
Watch for wave ‘i’ to finally move lower in an impulsive manner.
A break of 28.74 will signal wave (iii) is underway.
BITCOIN
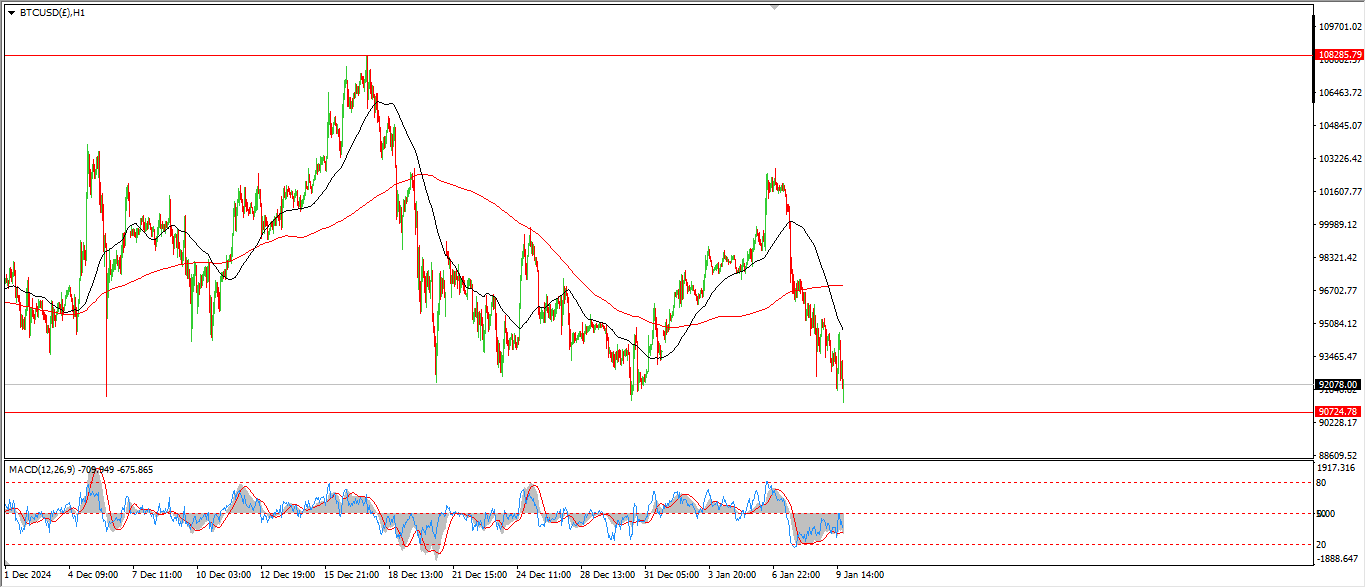
BITCOIN 1hr.
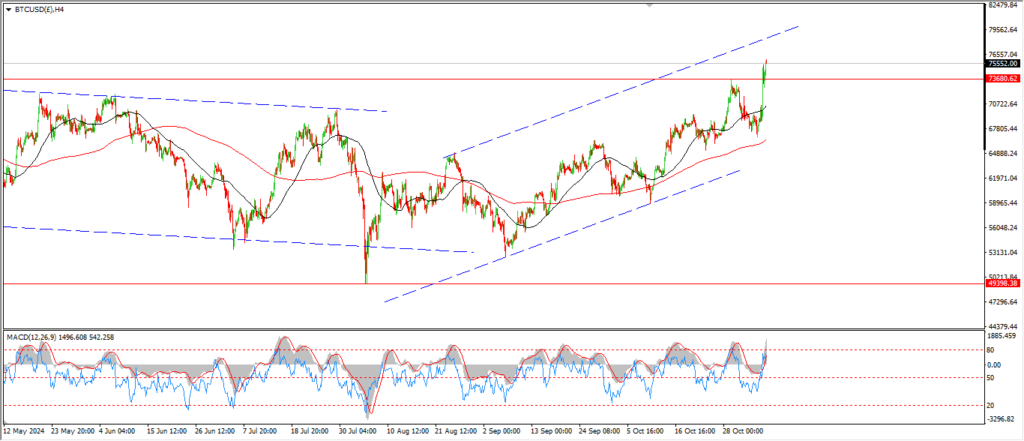
BITCOIN 4hr.
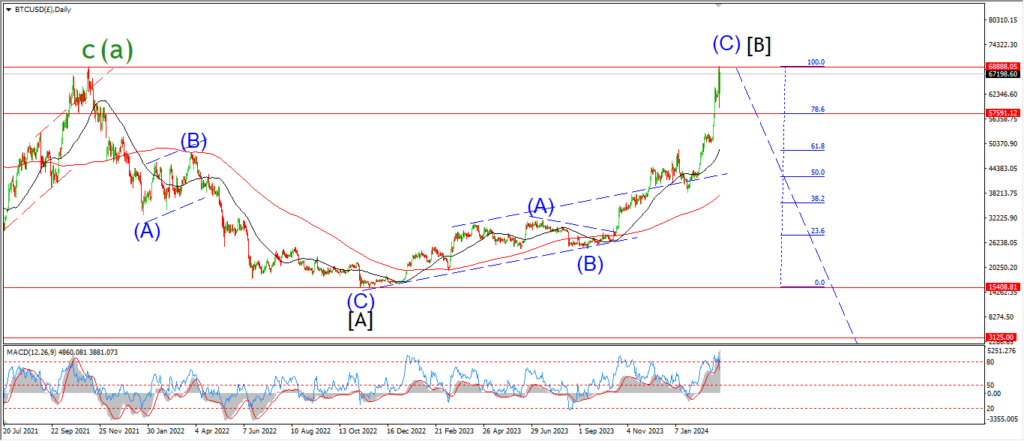
BITCOIN daily.
….
FTSE 100.
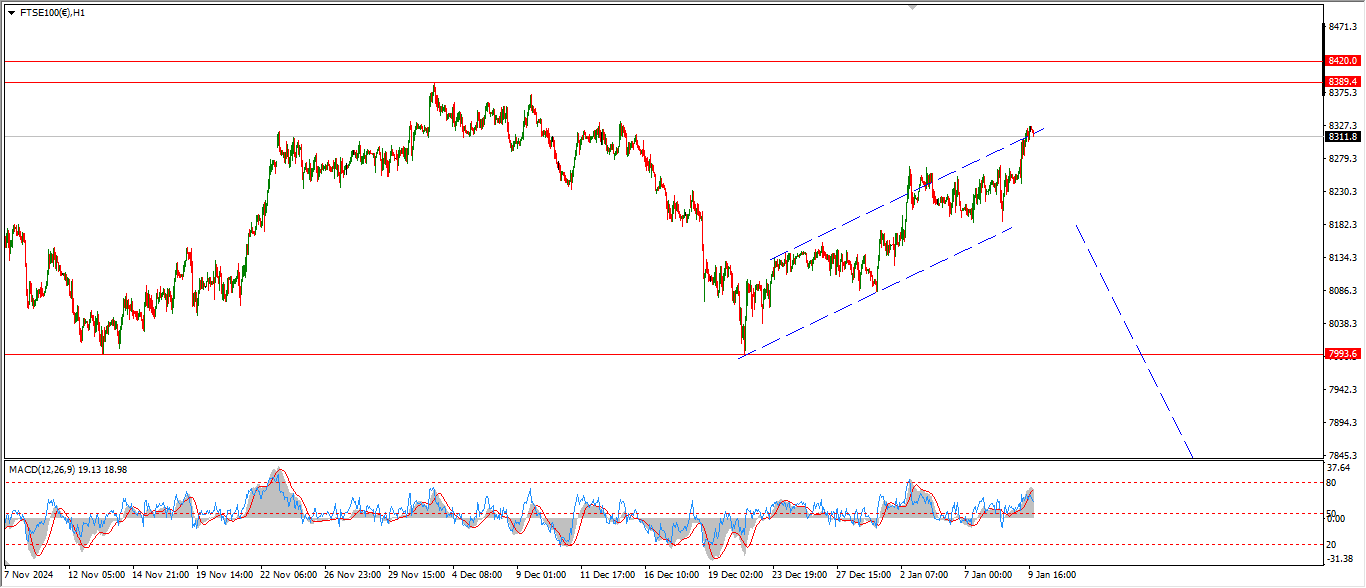
FTSE 100 1hr.
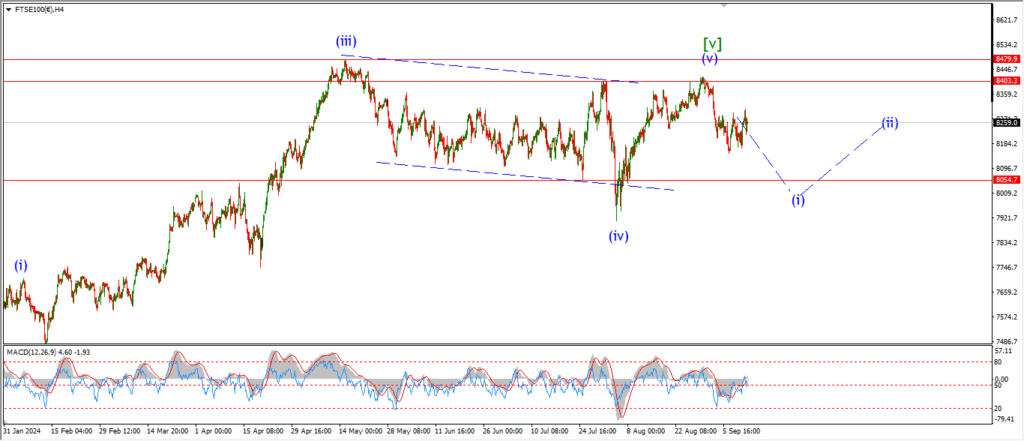
FTSE 100 4hr.

FTSE 100 daily.
….
DAX.
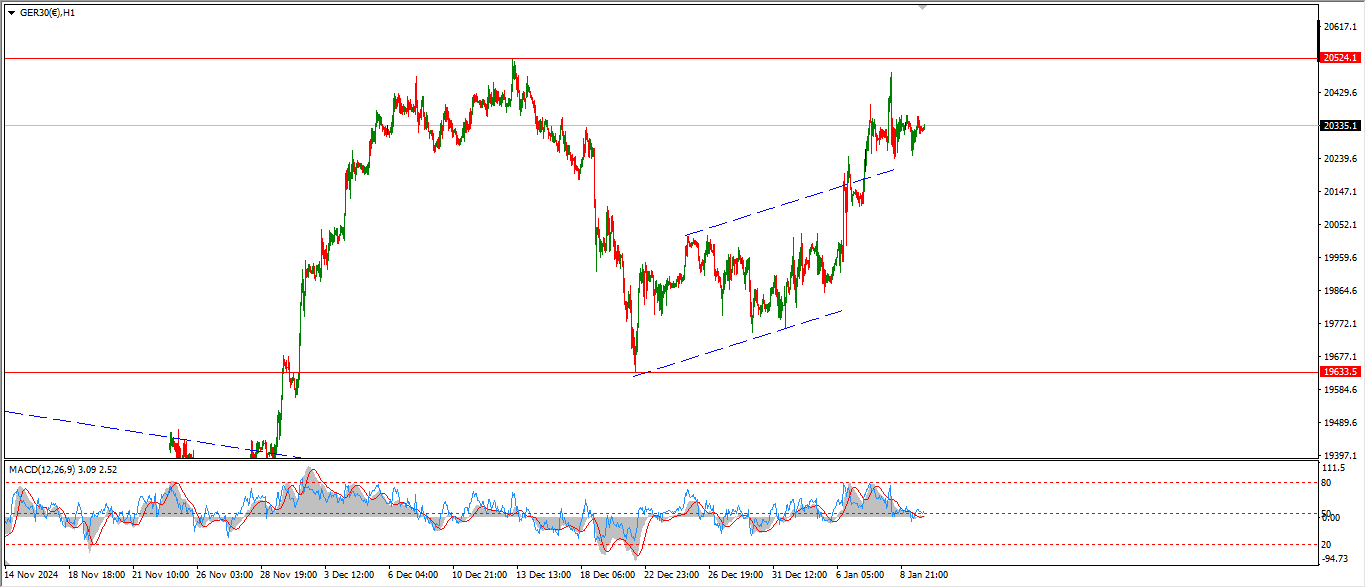
DAX 1hr
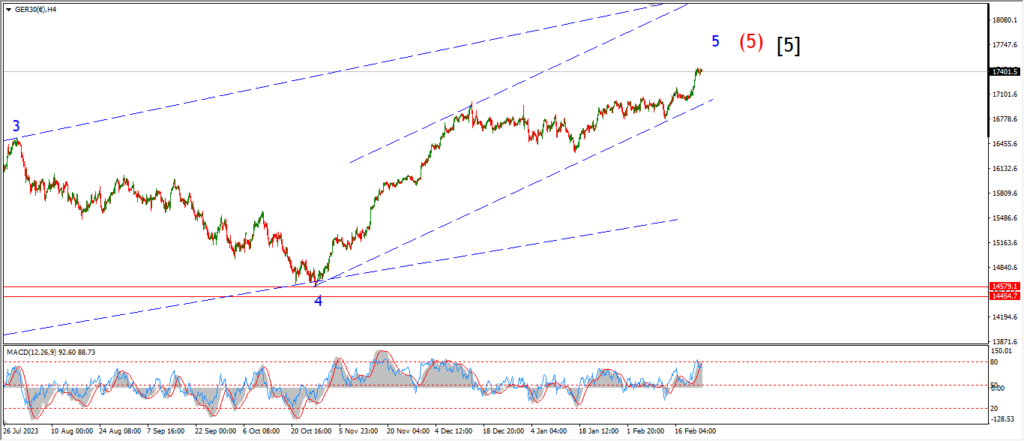
DAX 4hr

DAX daily.
….
NASDAQ 100.
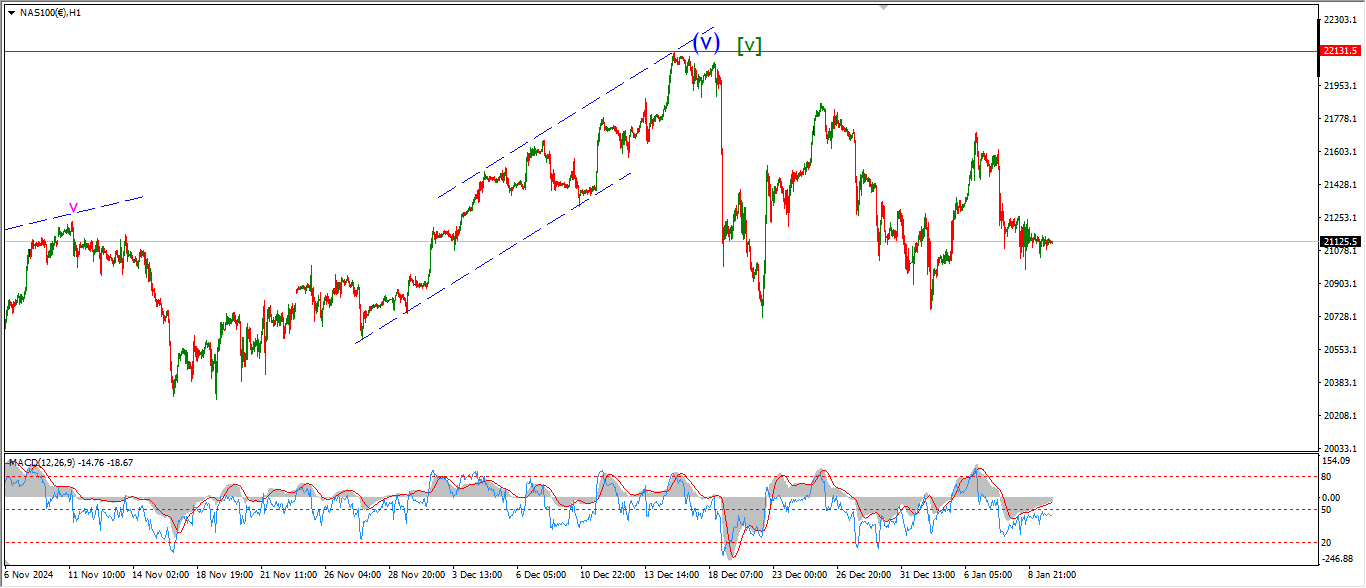
NASDAQ 1hr
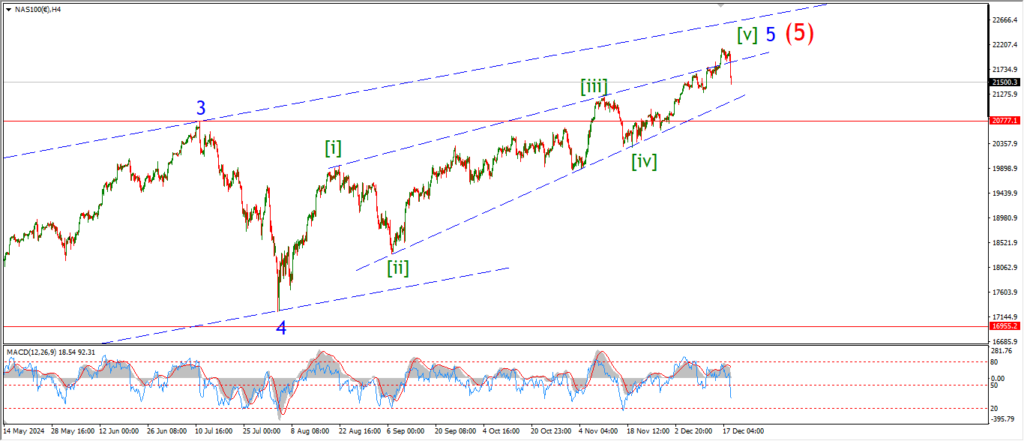
NASDAQ 4hr.
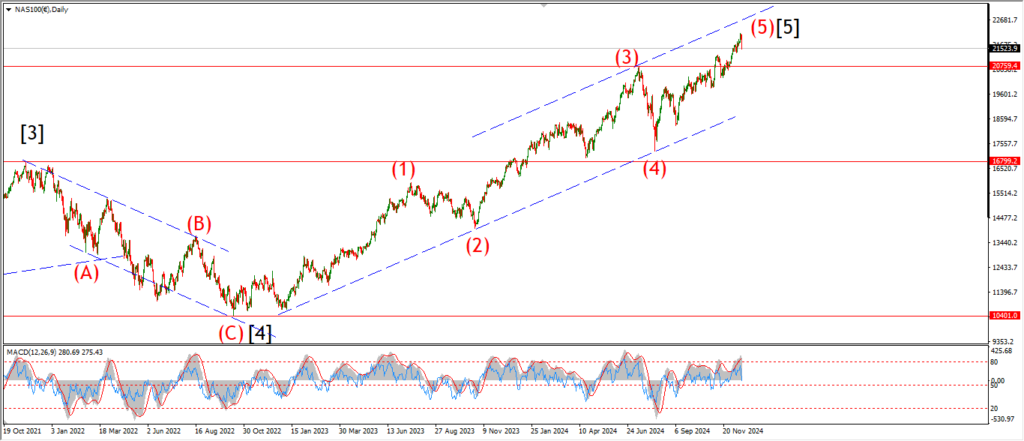
NASDAQ daily.
….