
Good evening folks and the Lord’s blessings to you.
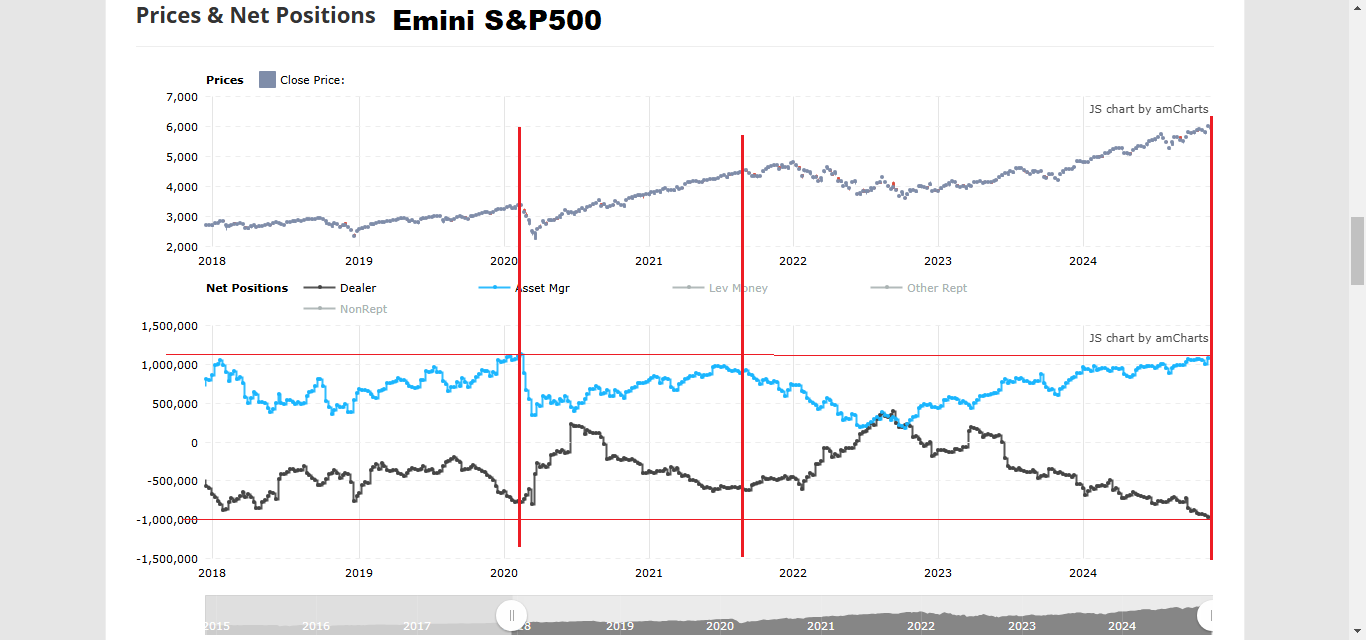
The first chart below is the last 6 years of COT data plotted against price for the EMINI futures contract.
We have not seen an extreme positioning like this in the history of this market, its been close, but at far lower prices.
The point to note here is that when these extremes occur, they are invariably followed by a stagnation or a large selloff.
My guess is that this extreme in sentiment will be followed by an extreme selloff to rival 2020 for sure, and possibly even larger.
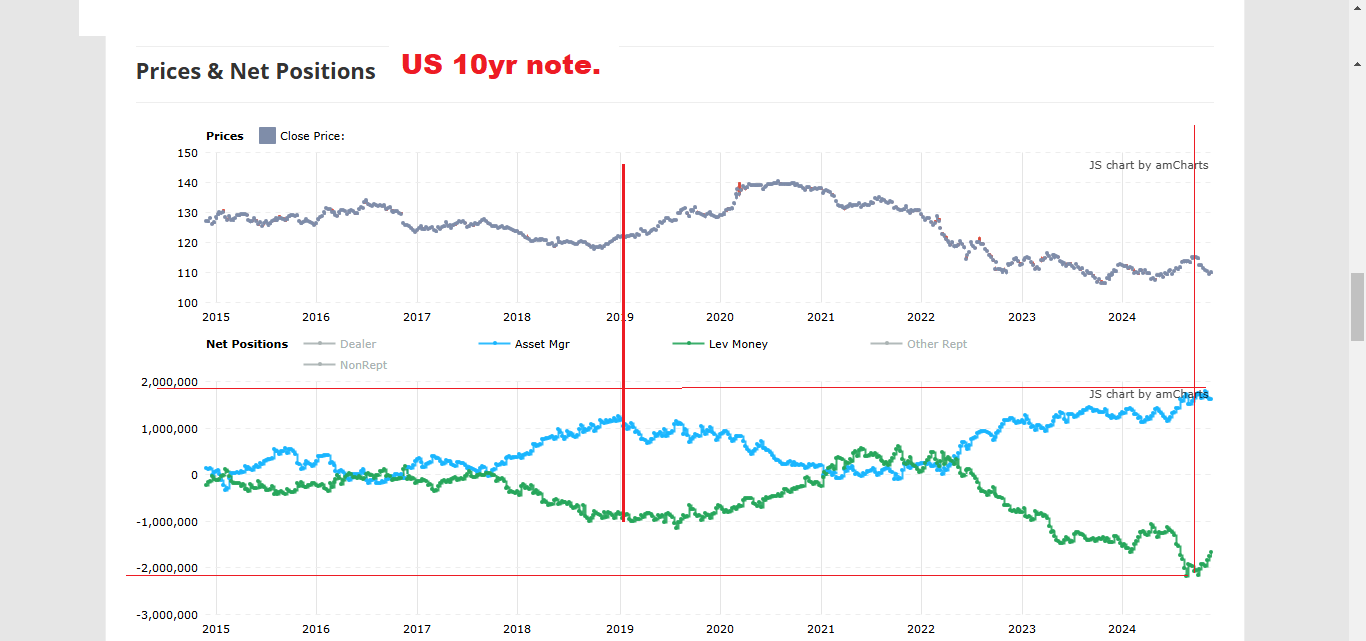
The chart below shows the very same data for the last 9 years in the US 10yr note futures market.
The current extreme in positioning comes at a point of extreme pessimism in the US bond market.
This market has been sold off to absurd levels now. and I think we will look back on this time as an opportunity that was just staring us in the face!
This market is poised to run higher for the next few years going by historical precedent.
EURUSD.
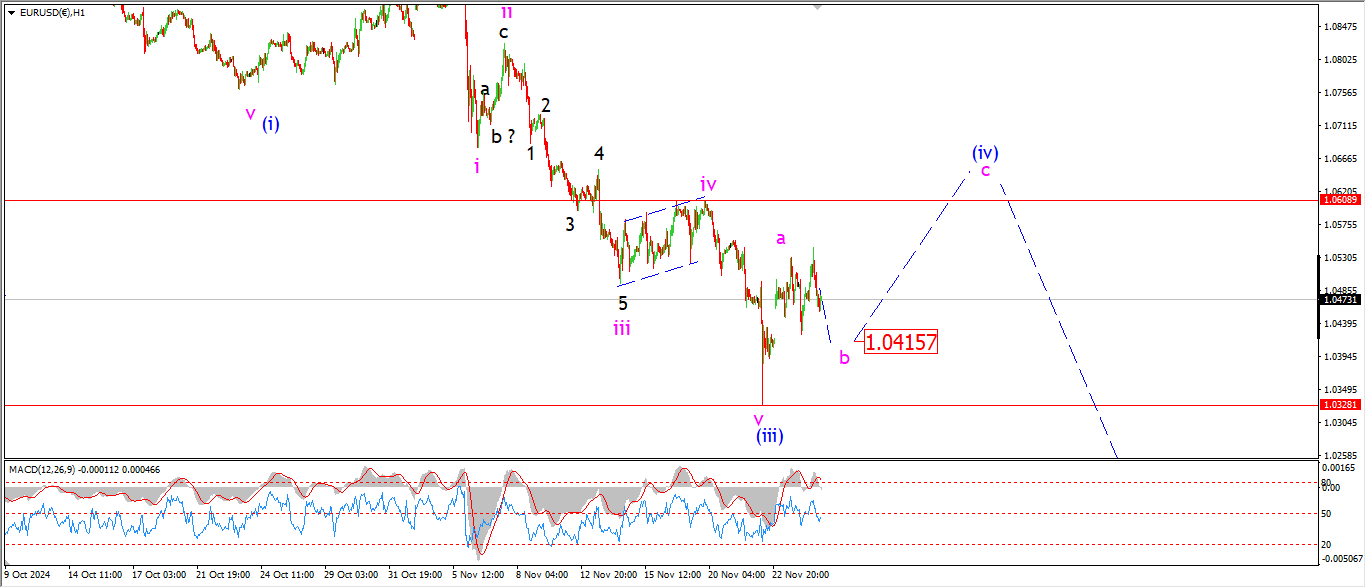
EURUSD 1hr.
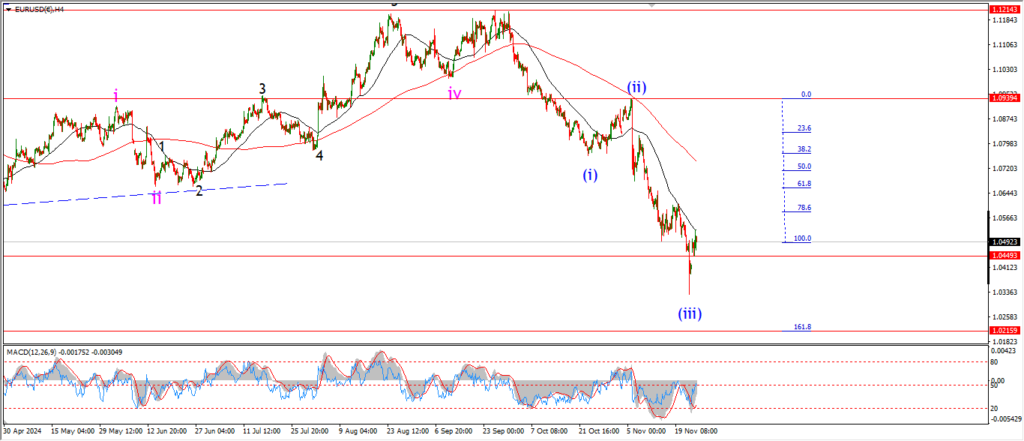
EURUSD 4hr.
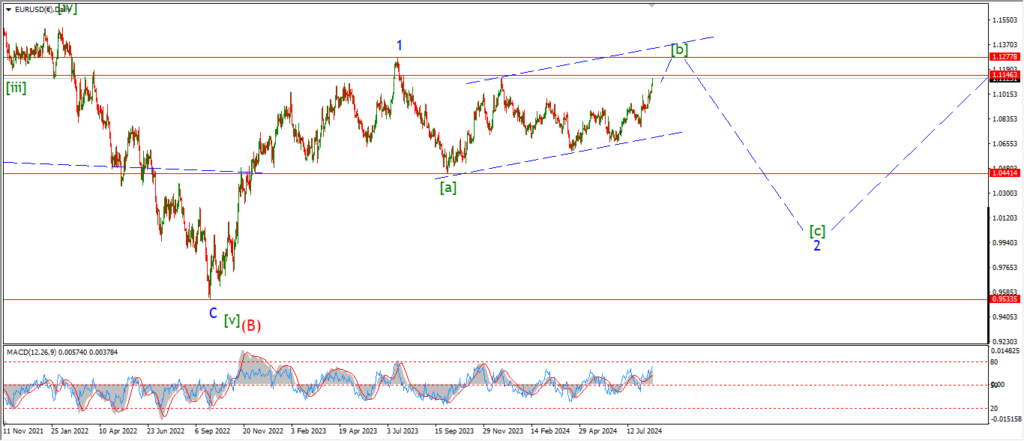
EURUSD daily.
The action in EURUSD today remains corrective in nature and this suggests wave ‘b’ of (iv) is still in play.
I am suggesting that wave ‘b’ will fall into the 1.0415 level to complete an expanded flat correction early tomorrow.
and then from there we will see a rally into wave ‘c’ of (iv) over the rest of the week.
Three waves up in wave (iv) has an initial target at 1.0609 at the previous wave ‘iv’ high.
and once that is done,
I will turn my attention lower again next week.
Tomorrow;
watch for wave ‘b’ to complete above 1.0330 at the wave (iii) lows.
And then wave ‘c’ should turn higher again.
GBPUSD
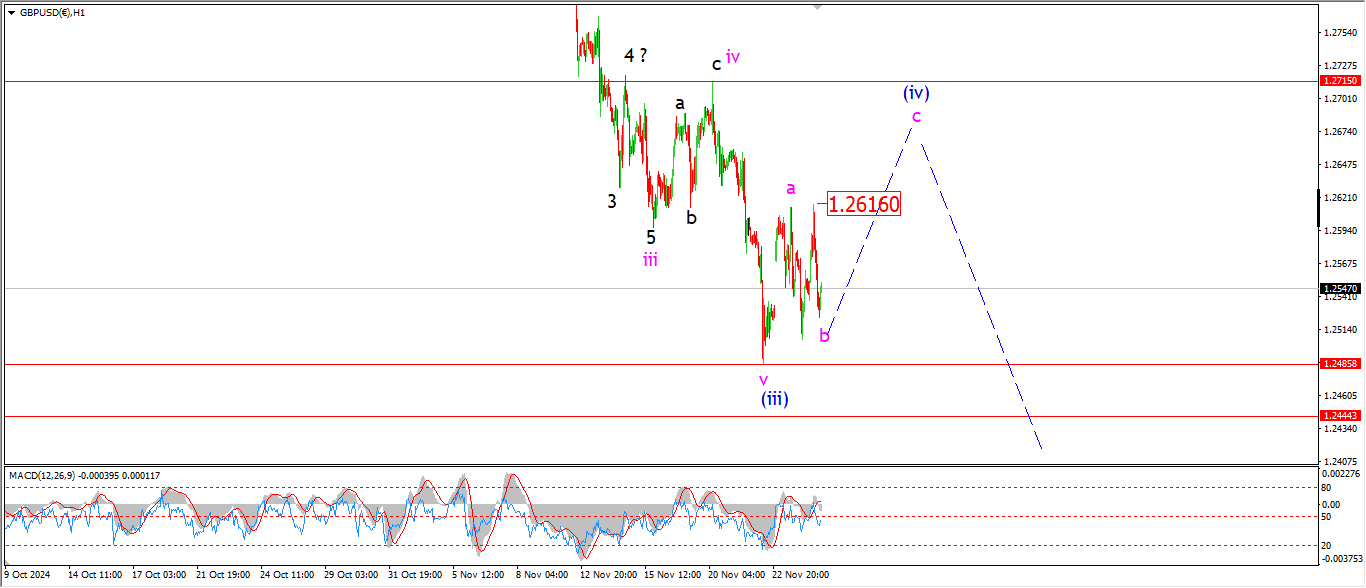
GBPUSD 1hr.
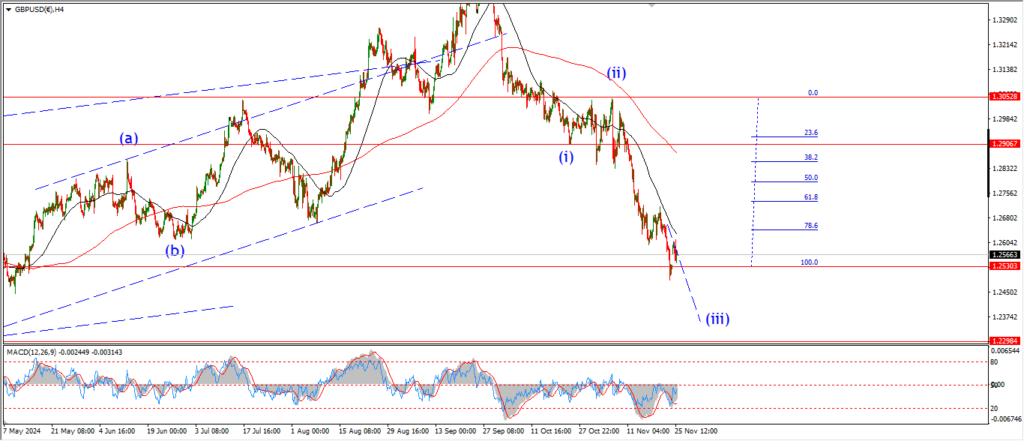
GBPUSD 4hr.
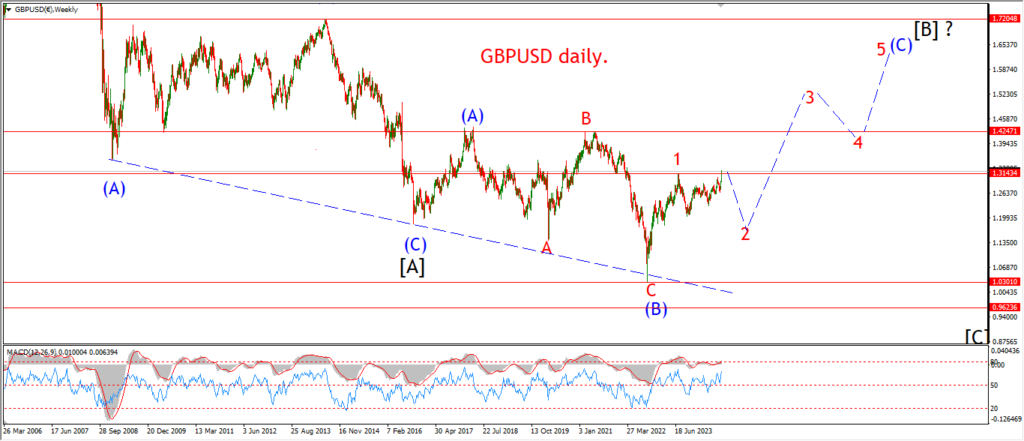
GBPUSD daily.
Wave ‘b’ of (iv) is holding on with a tight grip in cable also tonight.
The price action has attempted to rally into wave ‘c’ today,
but that any gains were wiped out this evening and we are back to flat this evening.
I am looking at a possible running flat for wave ‘b’ of (iv) because the price is getting close to the wave (iii) support again.
I want wave (iii) to hold at 1.2486,
and wave ‘c’ to run higher again beginning tomorrow as shown.
Tomorrow;
Watch for wave (iii) to hold at 1.2486.
Wave ‘c’ of (iv) will be confirmed with a break of 1.2616 again.
USDJPY.
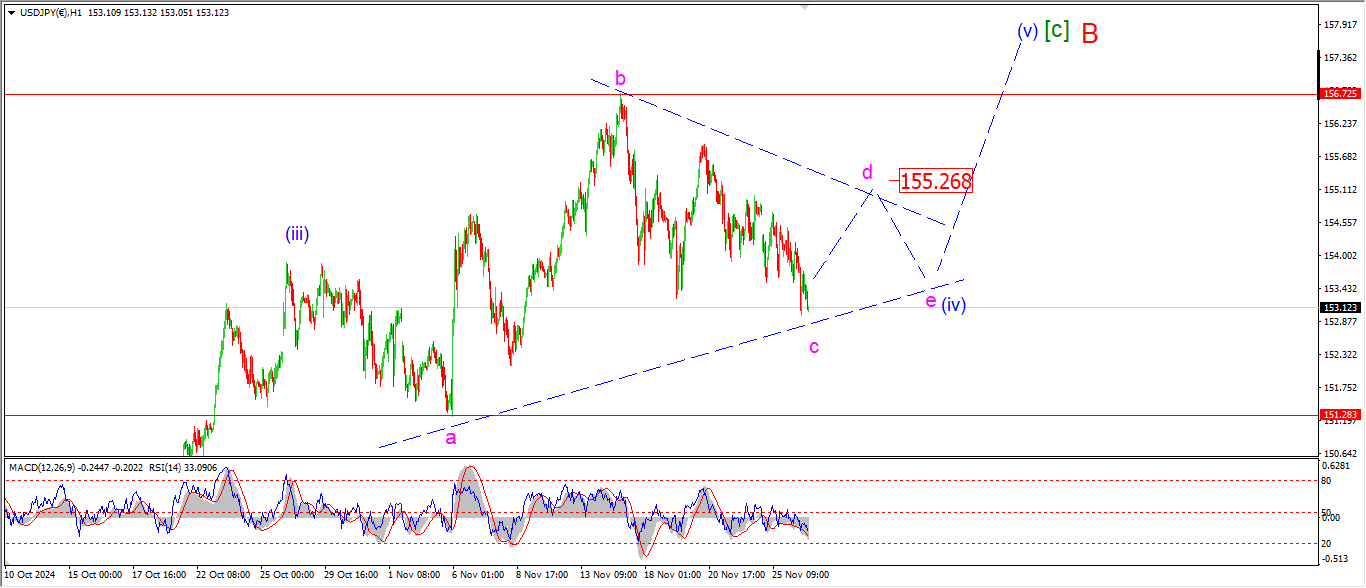
USDJPY 1hr.
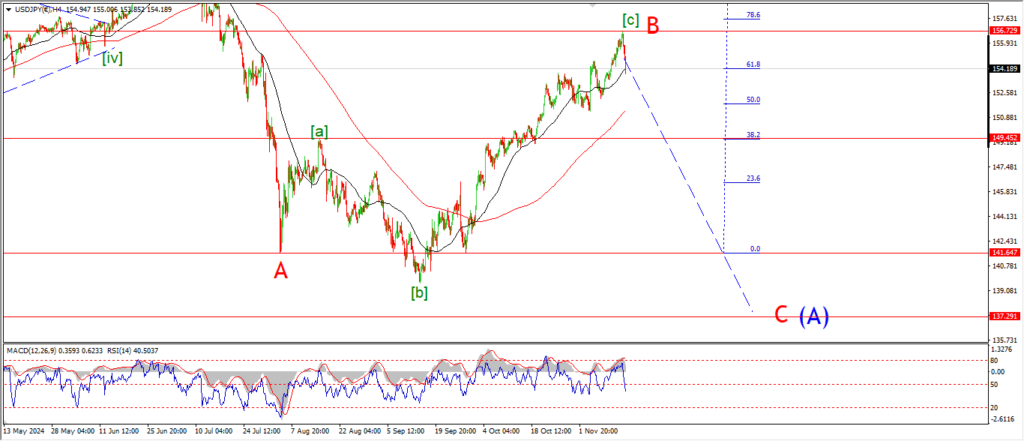
USDJPY 4hr.
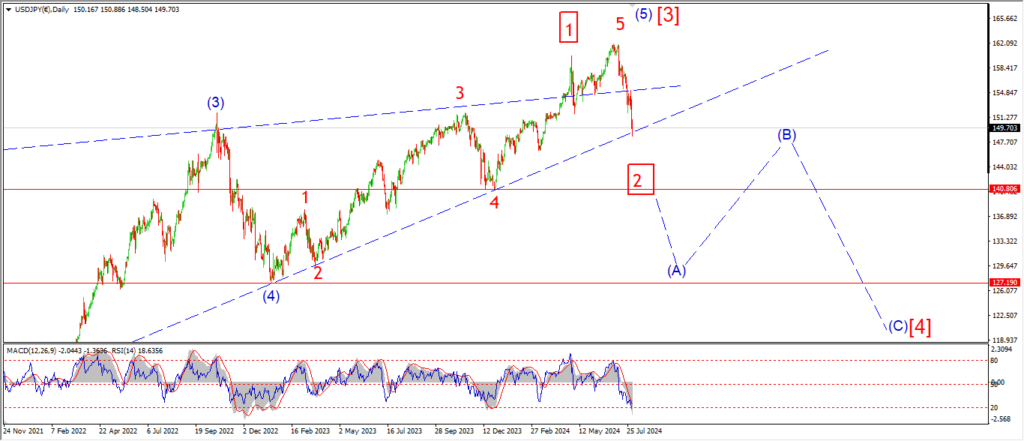
USDJPY daily.
USDJPY has flat out refused to fall impulsively into wave (i) down again today.
and that raises the probability of that alternate count.
I am showing that triangle wave (iv) count tonight to see how this would play out.
The price range continues to contract this week.
And the lows today are labelled wave ‘c’ of (iv) of that triangle pattern.
there is more to come here if this pattern is correct.
and the triangle must complete above 151.28 at the wave ‘a’ lows for this pattern to remain valid.
Tomorrow;
Watch for wave ‘d’ of (iv) to turn higher tomorrow to hit the area of 155.26.
DOW JONES.
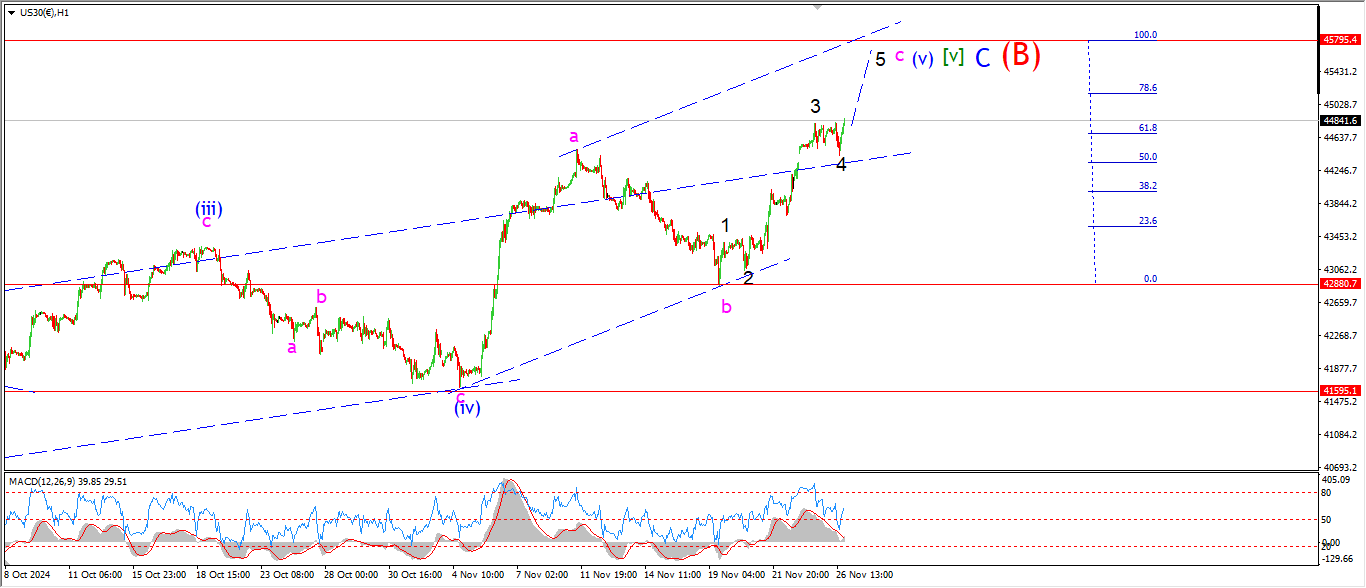
DOW 1hr.
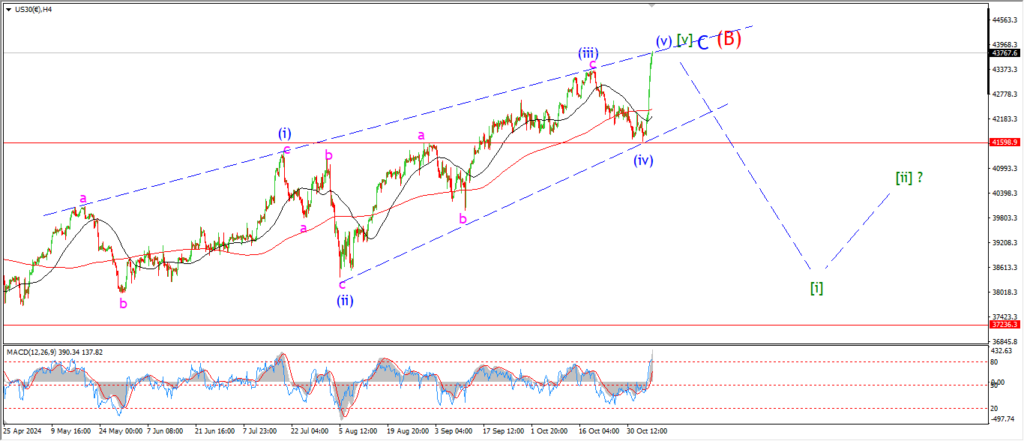
DOW 4hr
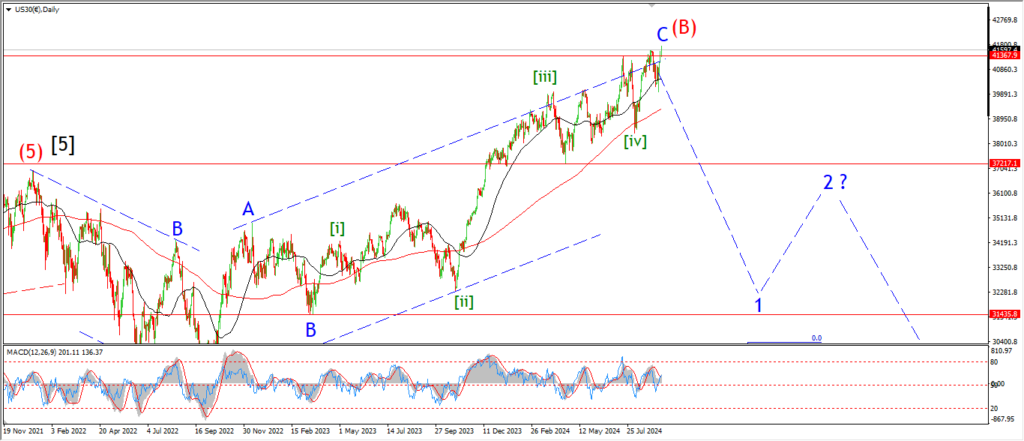
DOW daily.
I am embracing the new ending diagonal count tonight!
the current rally is wave ‘c’ of (v).
And I have labelled a five wave internal pattern for wave ‘c’.
If wave ‘c’ reaches equality with wave ‘a’,
then the top will form at 45790.
Tomorrow;
wave ‘5’ of ‘c’ will complete the internal three wave pattern for wave (v) blue.
GOLD
GOLD 1hr.
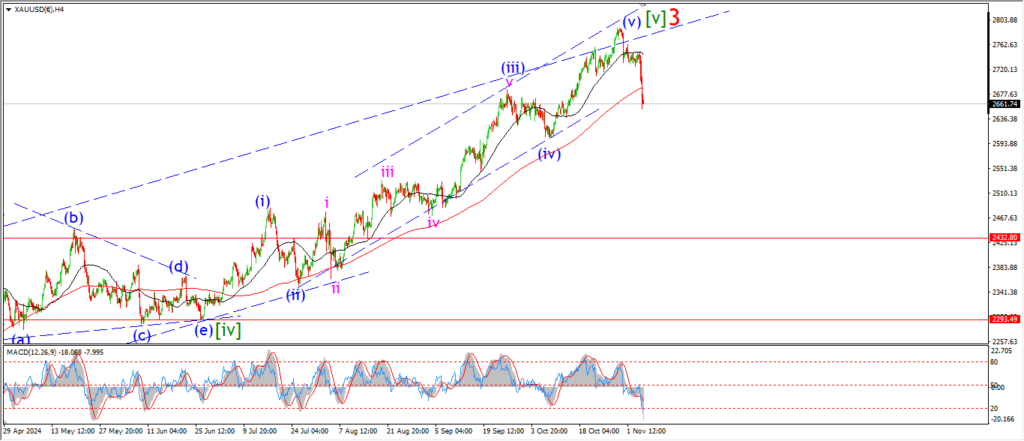
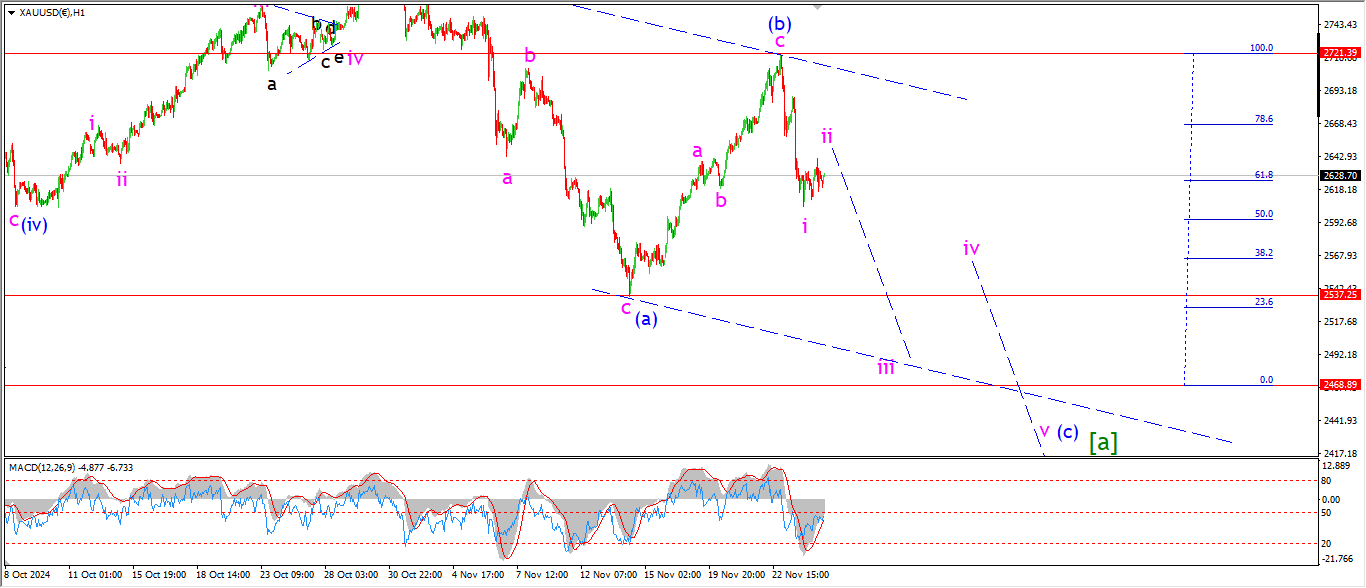
GOLD 4hr.
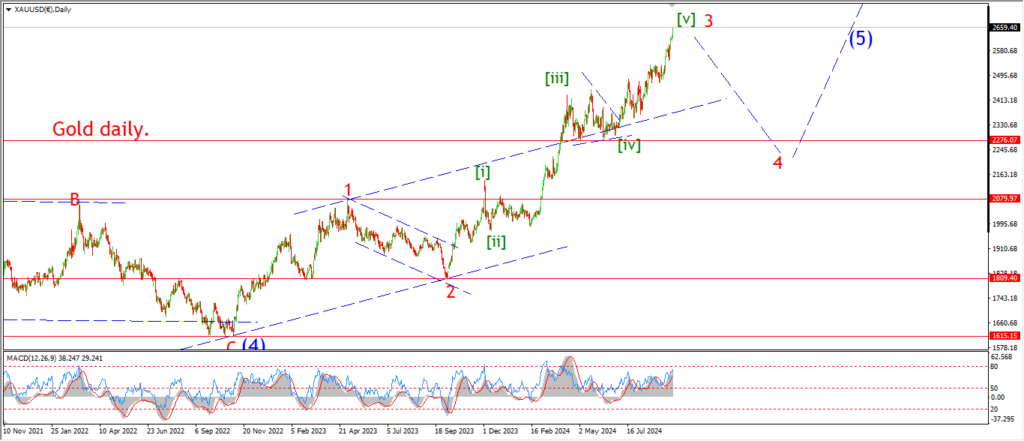
GOLD daily.
The price has moved sideways today in a possible wave ‘ii’ of (c).
That correction may not be complete yet as there is no sign that wave ‘iii’ down is beginning.
Wave ‘iii’ should break below 2537 at a minimum.
And the larger wave (c) has a target at 2468 where wave (a) and (c) reach equality.
so in terms of the larger pattern,
there is much work to do here before the initial three waves down complete.
Tomorrow;
Watch for wave ‘ii’ to complete a lower high as shown.
Wave ‘iii’ will be confirmed if we hit the 2537 lows of wave (a).
CRUDE OIL.
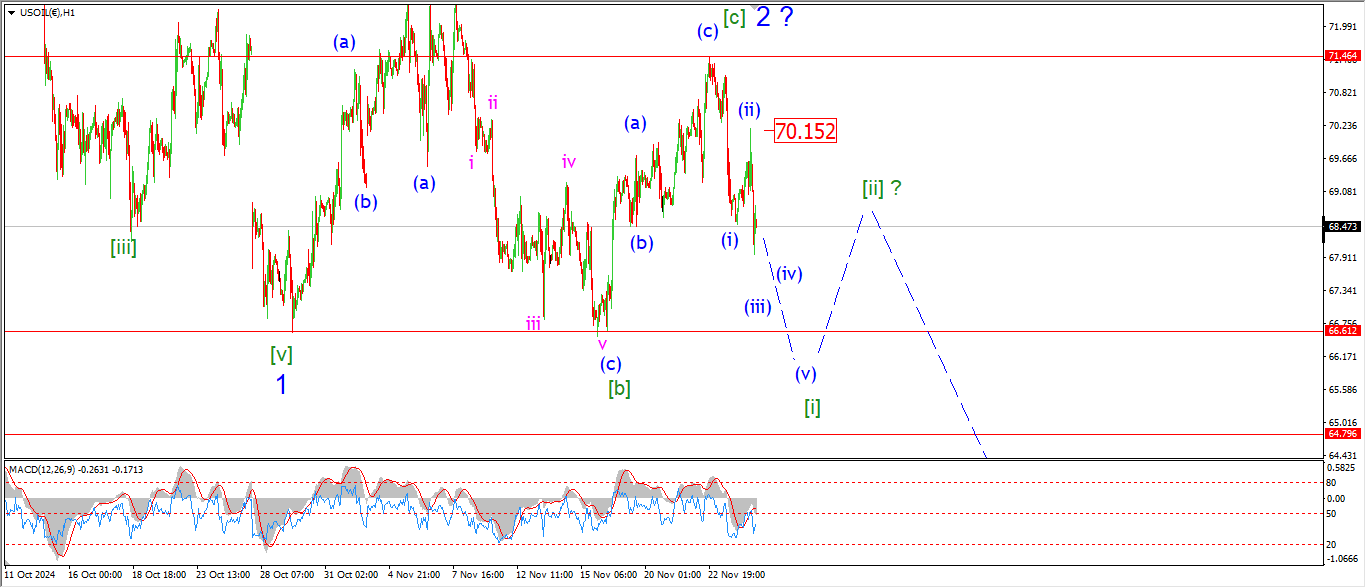
CRUDE OIL 1hr.
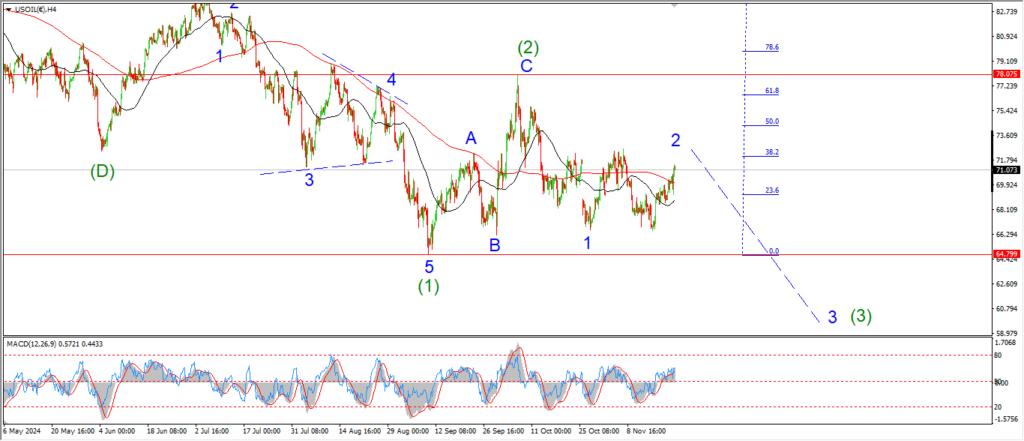
CRUDE OIL 4hr.
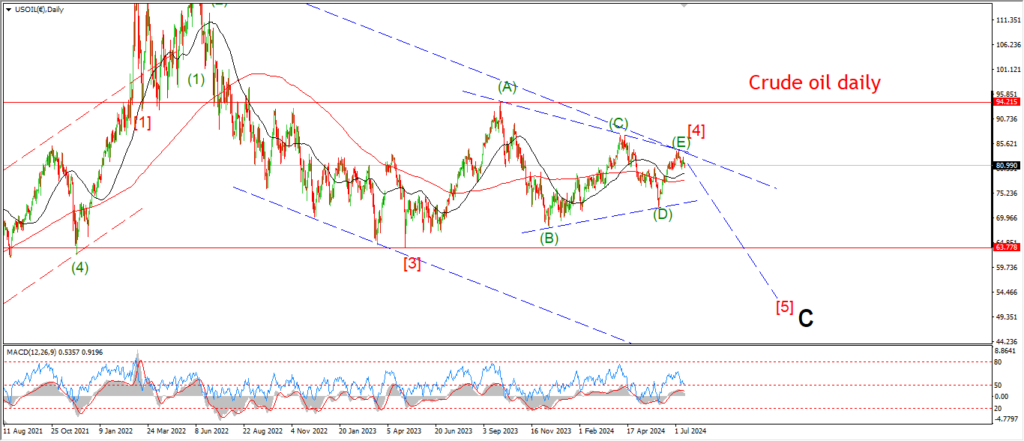
CRUDE OIL daily.
Crude oil has dropped in three waves off that possible wave ‘2’ top so far.
I am showing a count for wave [i] of ‘3’ now underway.
And if this is correct,
then todays decline is part of wave (iii) of [i].
This count will not be confirmed until we see a break of the lows at 66.60 again.
Tomorrow;
The price must now hold below below the wave (ii) highs at 70.15.
in fact,
the 70.00 level must hold in order to stick with this short term count.
Watch for wave [i] down to continue lower in a five wave pattern as shown.
S&P 500.
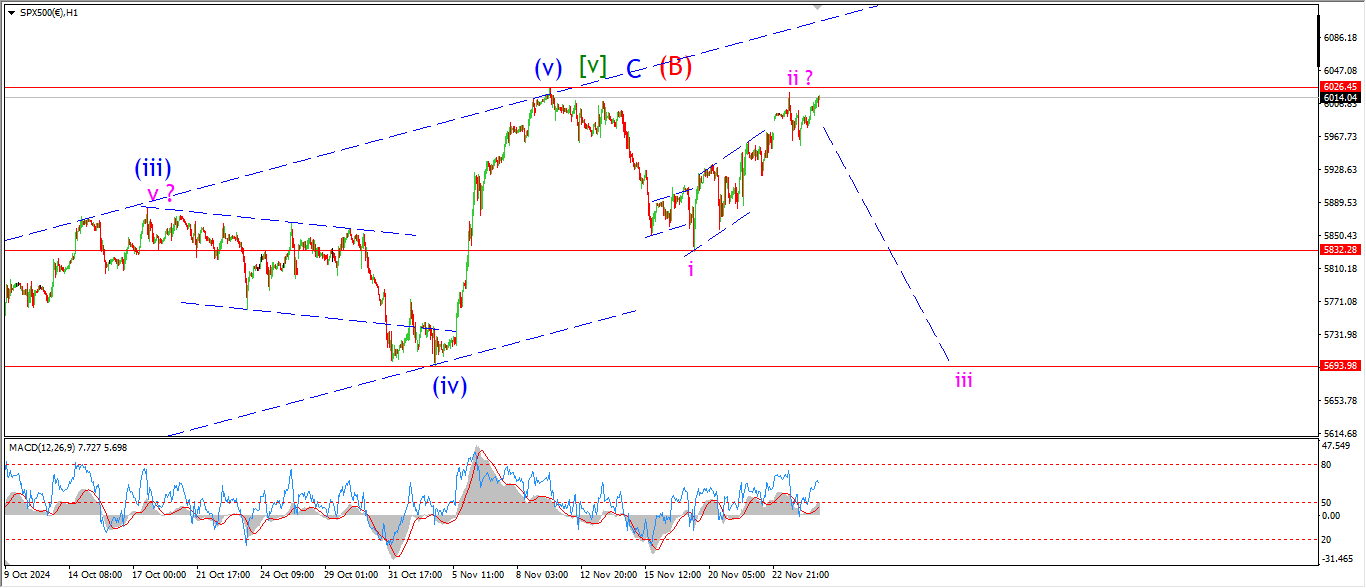
S&P 500 1hr
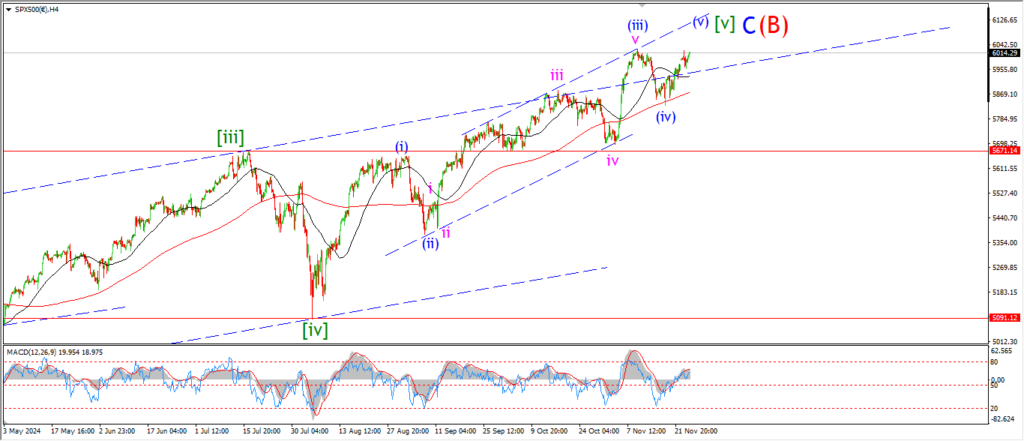
S&P 500 4hr
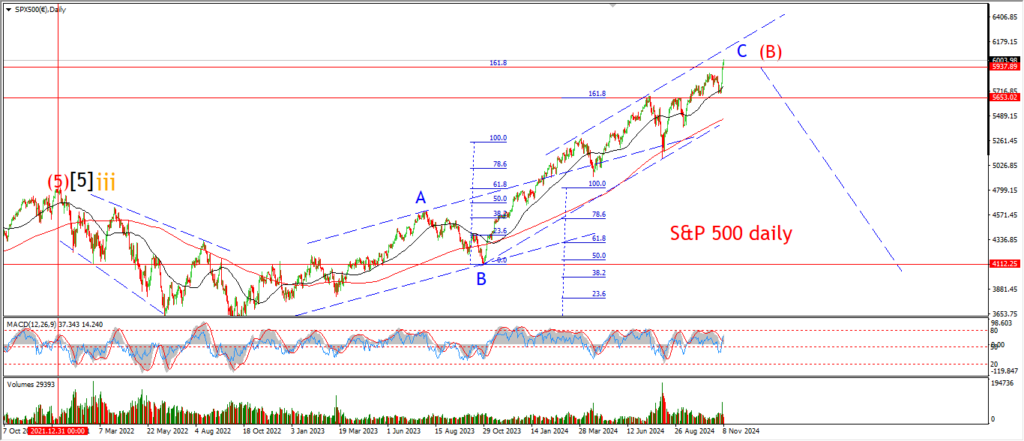
S&P 500 daily.
This wave count is fast going out of fashion today.
the market has risen back to challenge the highs again and of course this means an alternate count is quite likely for wave [v] again.
On the 4hr chart you can see the full wave [v] alternate pattern.
And it is not much different from even tonight’s main wave count.
I don’t favor the ending diagonal idea here for wave [v] green at all.
The difference lies within wave (iii) blue,
which is now shown as a larger extension wave.
The rally into todays highs will form wave (v) in this scenario.
Tomorrow;
Lets see if we hit a new high to trigger the alternate count.
SILVER.
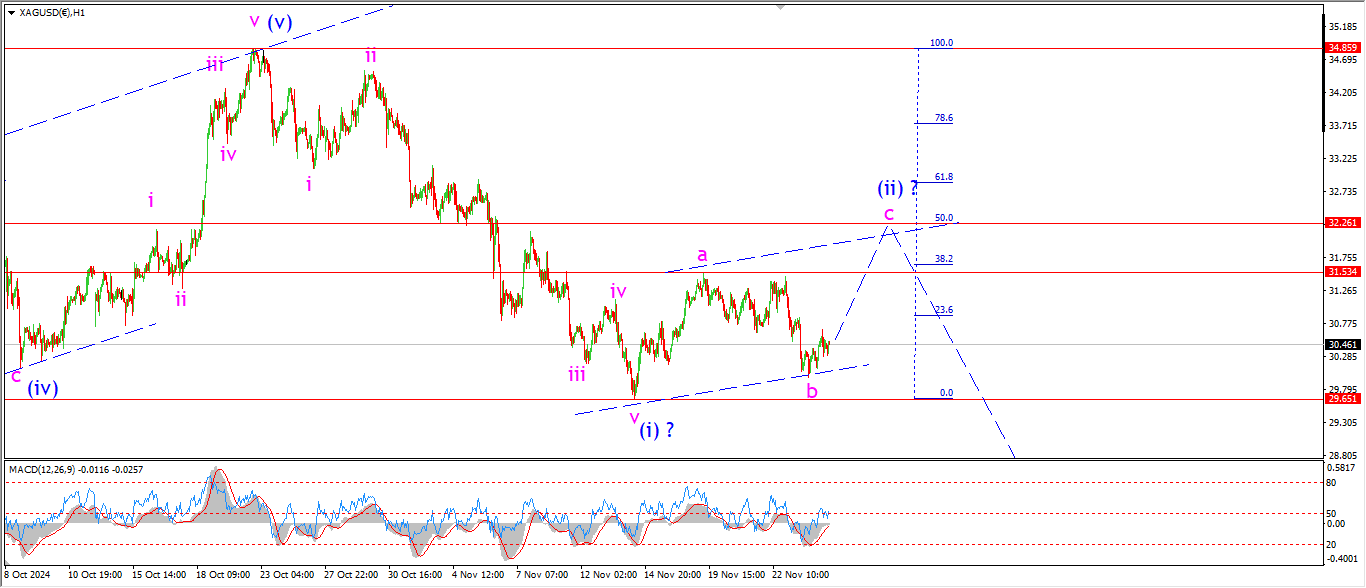
SILVER 1hr
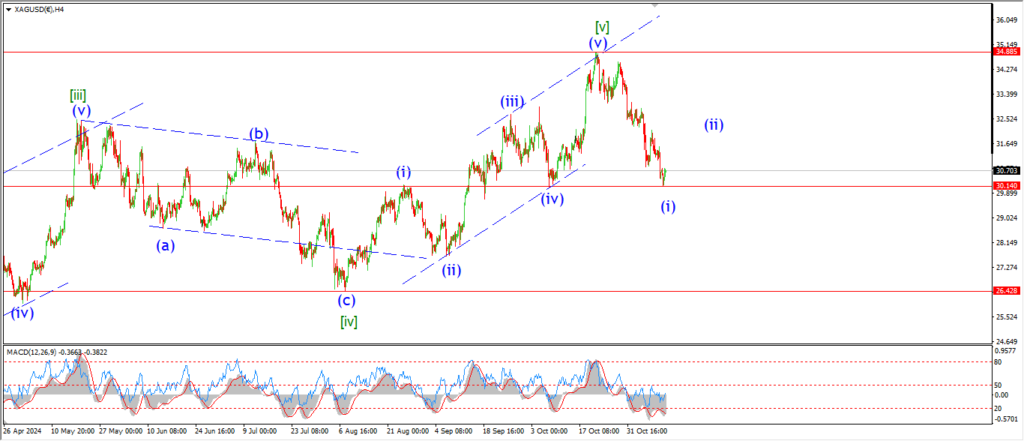
SILVER 4hr.
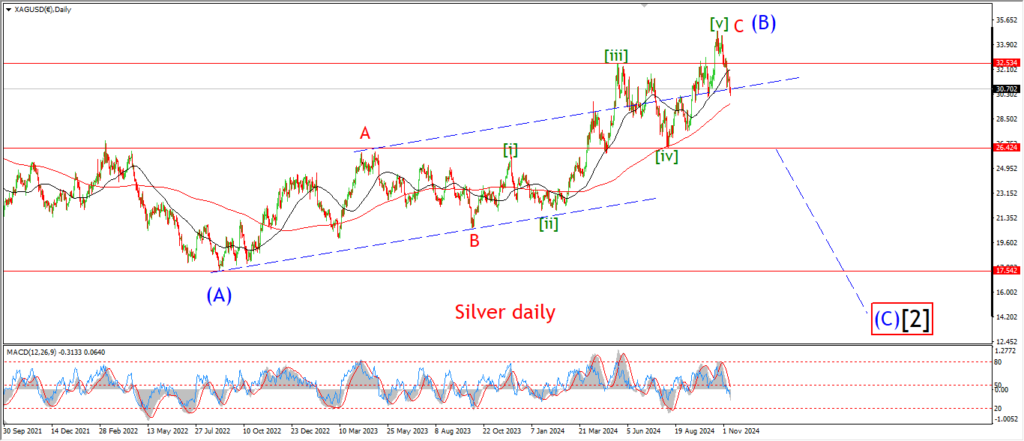
SILVER daily.
A small rise today is suggesting that a low is now in place for wave ‘b’ of (ii).
Wave ‘c’ of (ii) is still expected to push higher into the 50% retracement level at 32.26 in this scenario.
I will admit that the price action today does not look impulsive yet,
but I am willing to give this pattern in wave (ii) another chance tomorrow to complete that pattern.
Tomorrow;
Watch for wave ‘b’ to hold above 29.65 and continue higher towards the target at 32.26.
BITCOIN
BITCOIN 1hr.
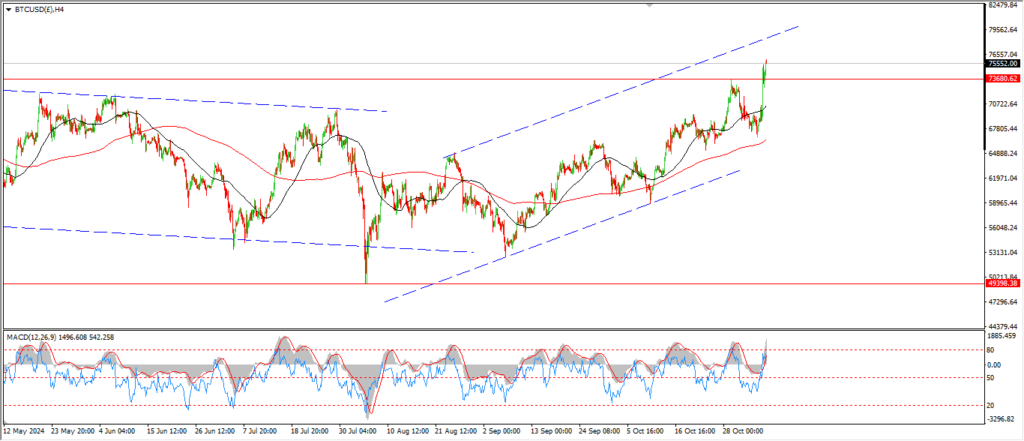
BITCOIN 4hr.
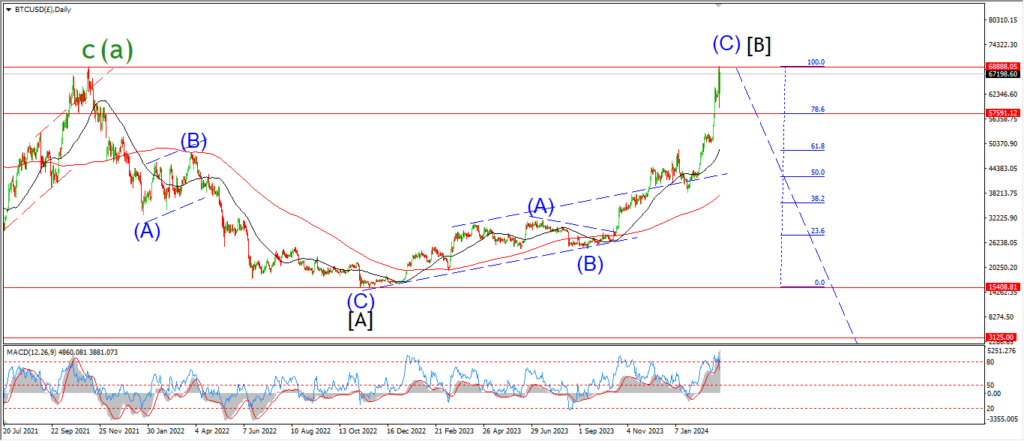
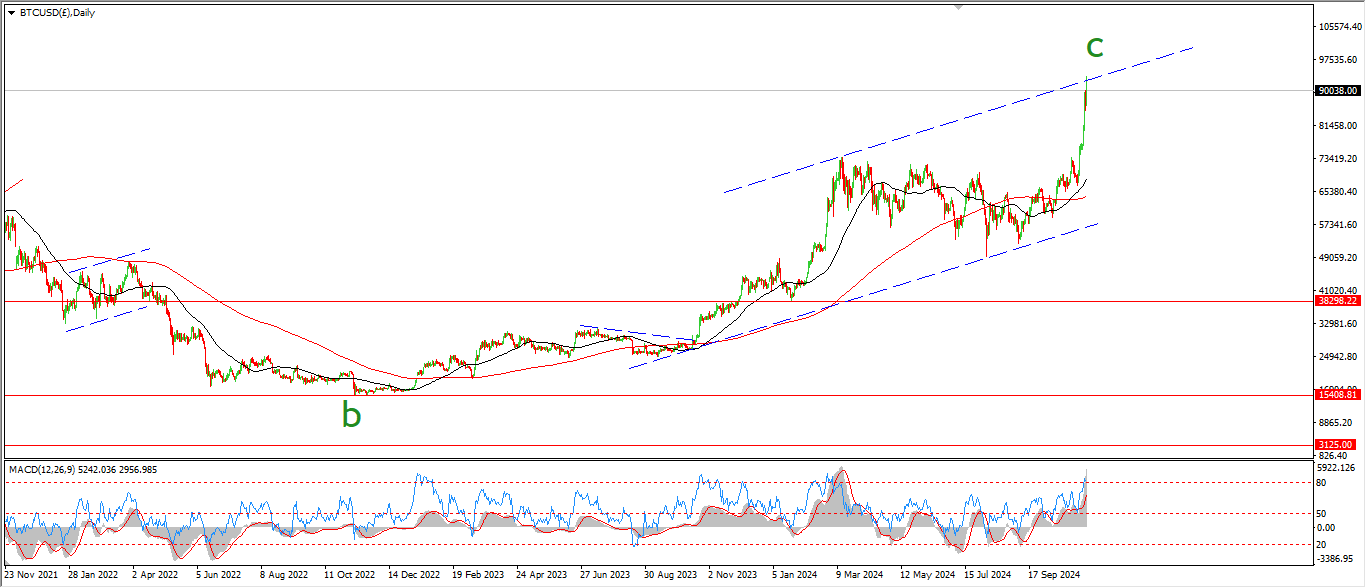
BITCOIN daily.
….
FTSE 100.
FTSE 100 1hr.
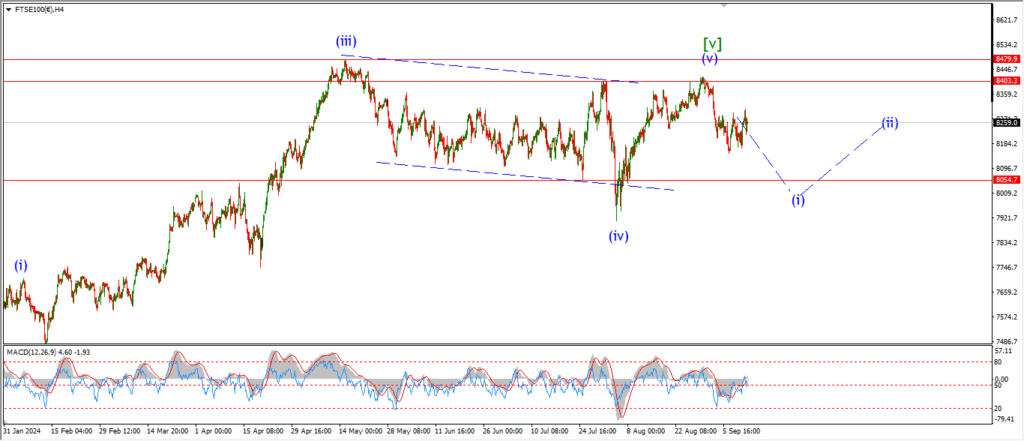
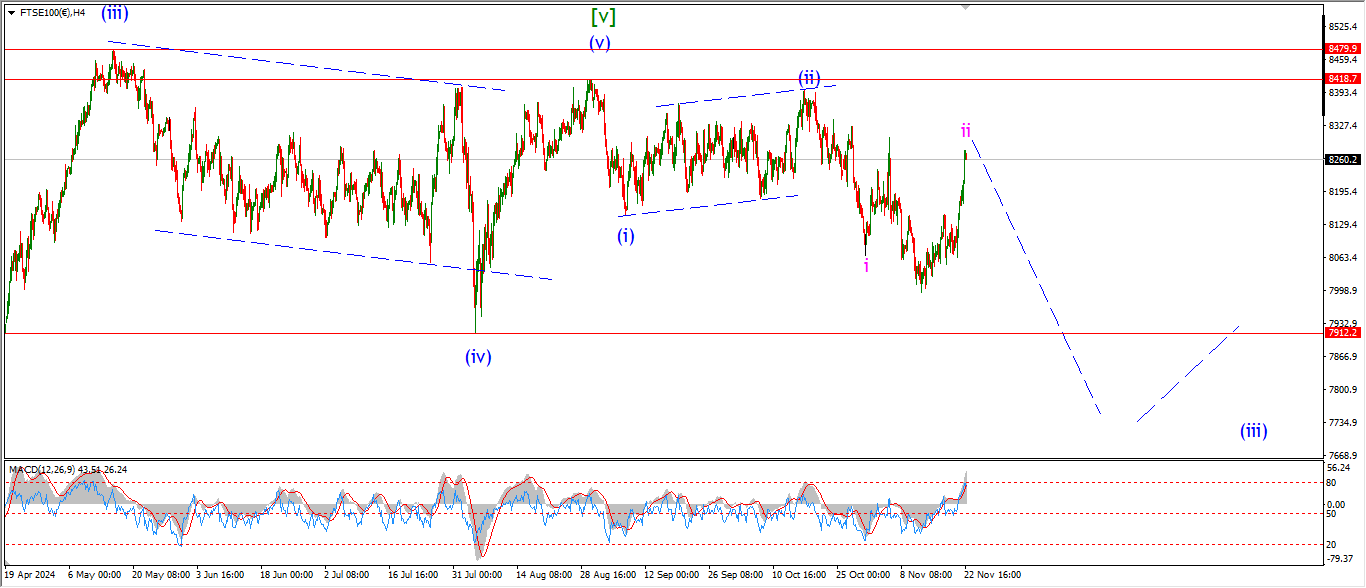
FTSE 100 4hr.

FTSE 100 daily.
….
DAX.
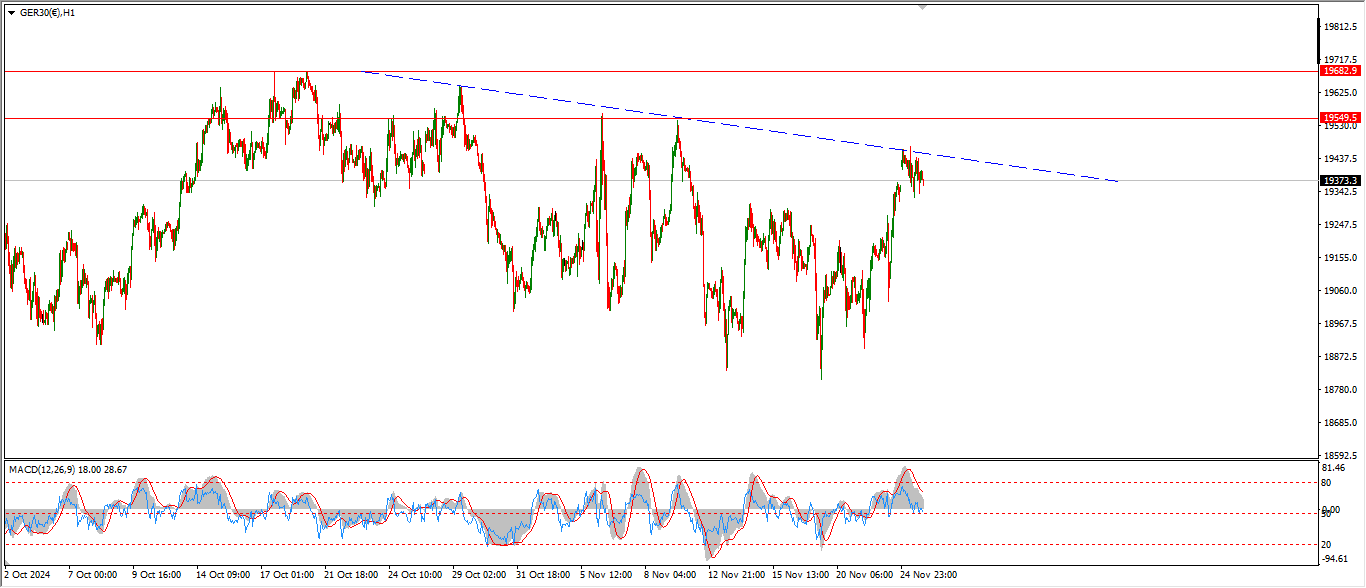
DAX 1hr
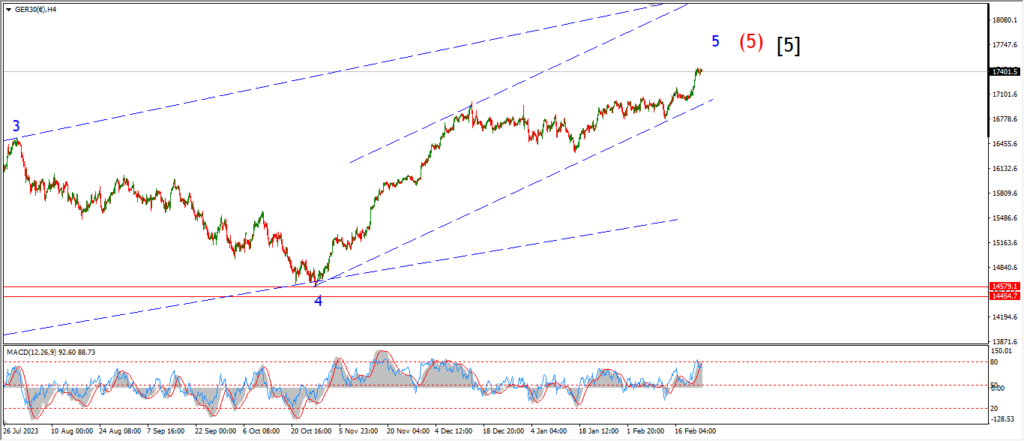
DAX 4hr

DAX daily.
….
NASDAQ 100.
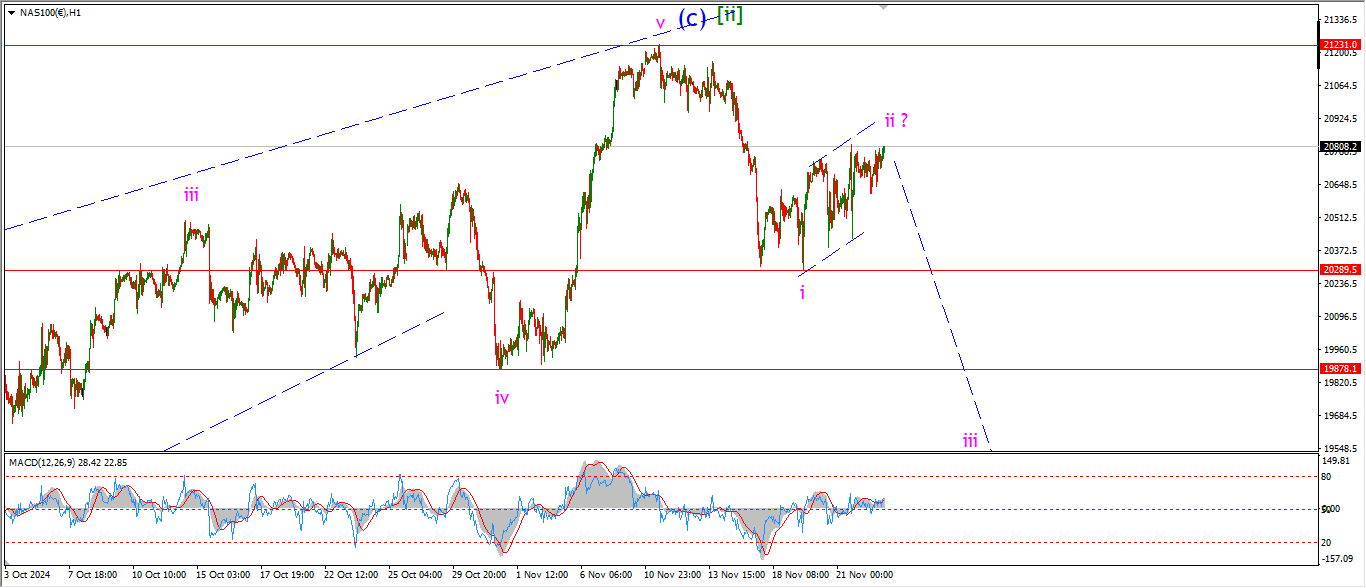
NASDAQ 1hr
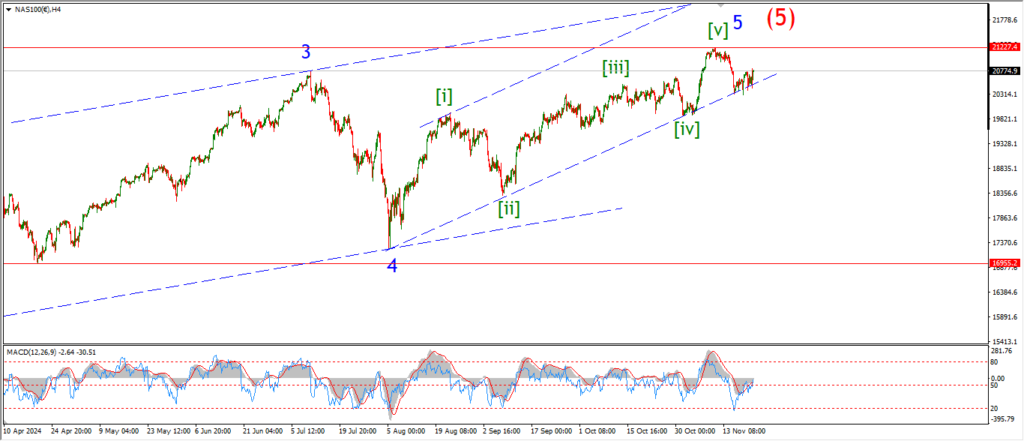
NASDAQ 4hr.
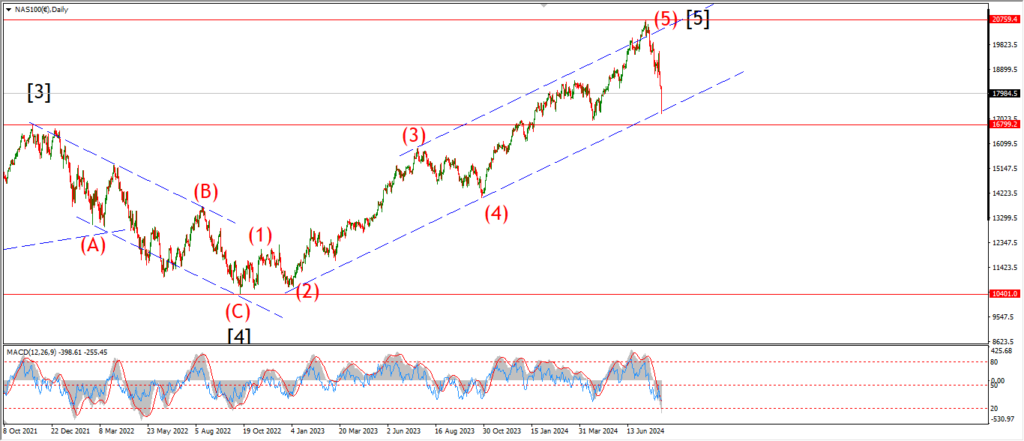
NASDAQ daily.
….