
Good evening folks and the Lord’s blessings to you.
EURUSD.
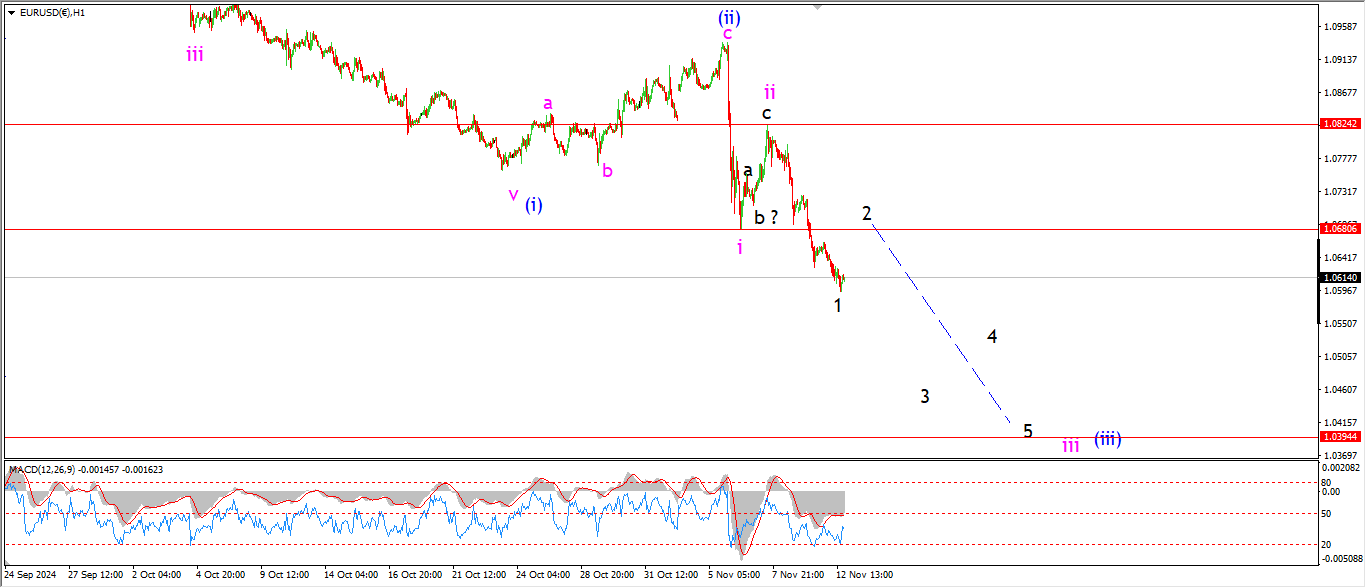
EURUSD 1hr.
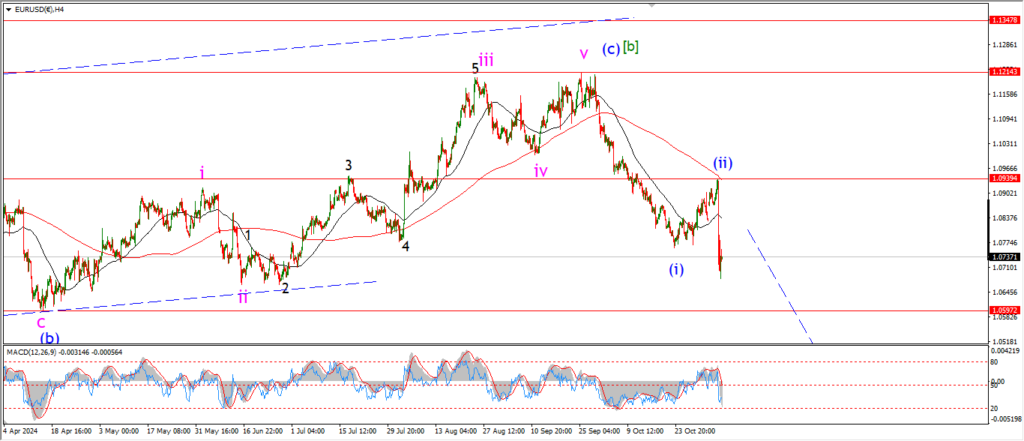
EURUSD 4hr.
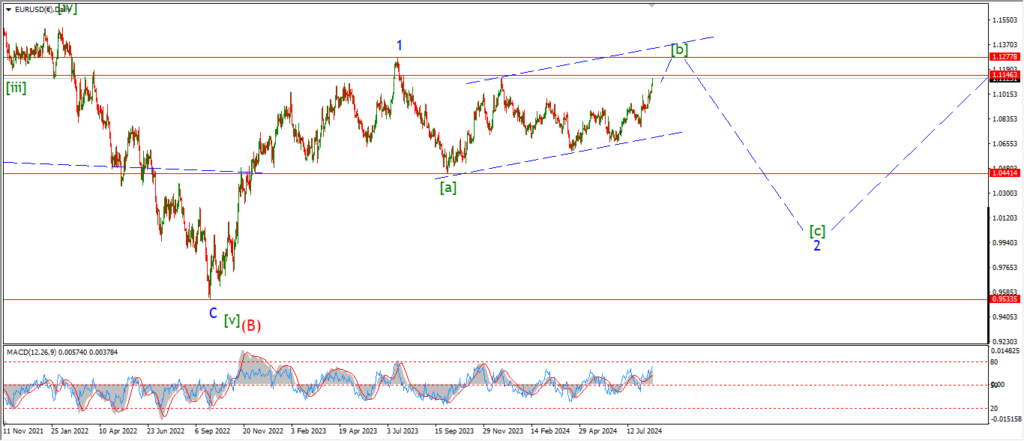
EURUSD daily.
The price has dropped again today to break below the wave ‘i’ level at 1.0680.
this move suggests that wave ‘iii’ of (iii) is now underway,
and if this is correct,
then we have much more downside to come here.
The price has not corrected into wave ‘2’ in any meaningful way today,
so I am still allowing for that correction to happen with a test of 1.0680 again.
If the price continues to drop into the 1.0500 area tomorrow,
that will signal a much tighter pattern for wave ‘iii’ pink than I am suggesting.
Tomorrow;
Watch for a small correction higher in wave ‘2’ of ‘iii’,
and then a larger decline into wave ‘3’ of ‘iii’.
GBPUSD
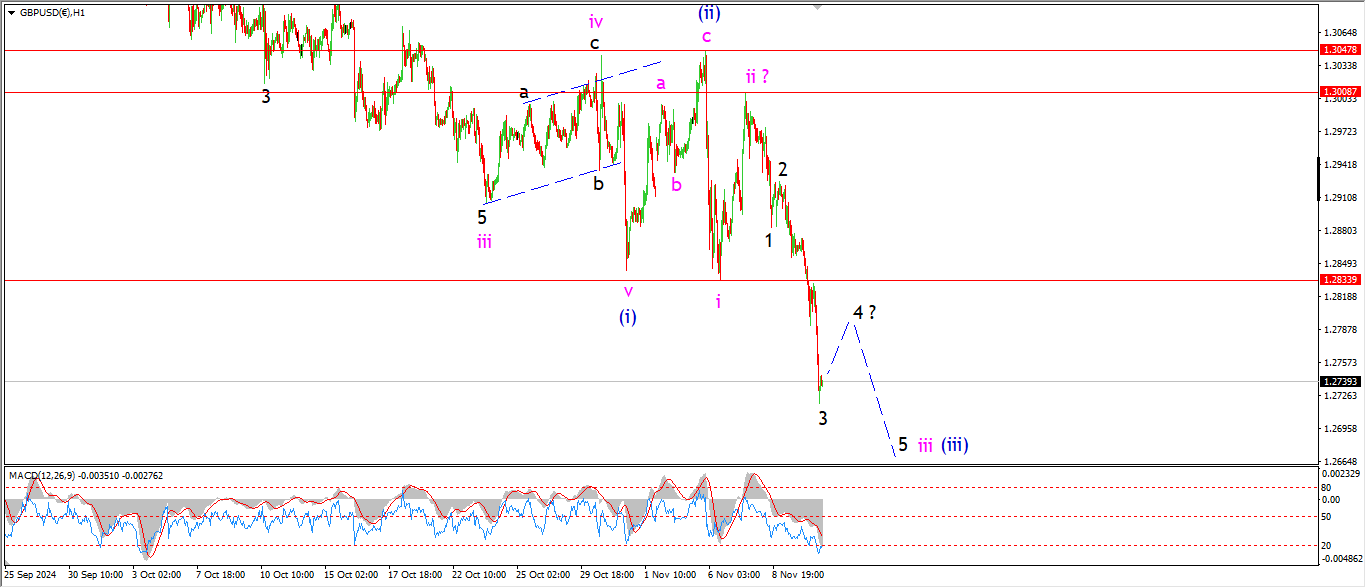
GBPUSD 1hr.
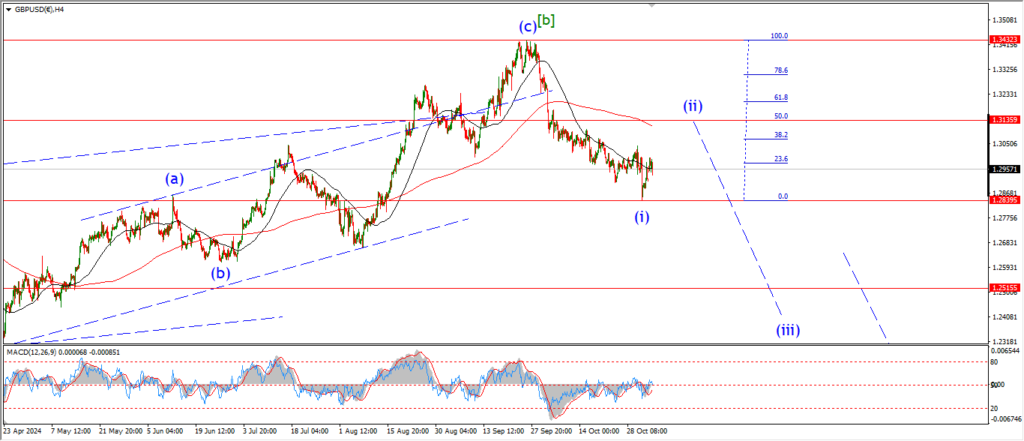
GBPUSD 4hr.
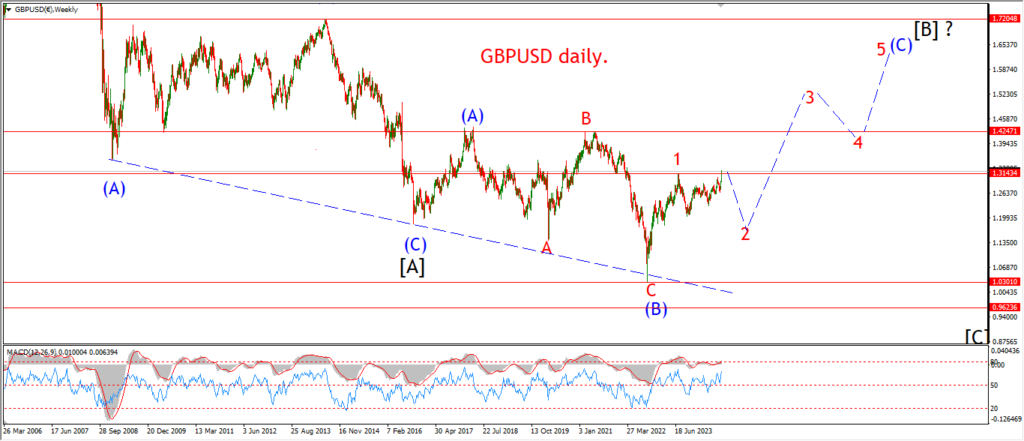
GBPUSD daily.
Cable has now given us the acceleration into wave ‘iii’ that was called for today.
I think the pattern in wave ‘iii’ is moving along quite well now,
and todays drop os labelled wave ‘3’ of ‘iii’,
with another step lower to come in waves ‘4’ and ‘5’ to complete.
Tomorrow;
A correction higher into wave ‘4’ should appear tomorrow and then wave ‘5’ will drop back again to complete five waves down in wave ‘iii’ pink.
USDJPY.
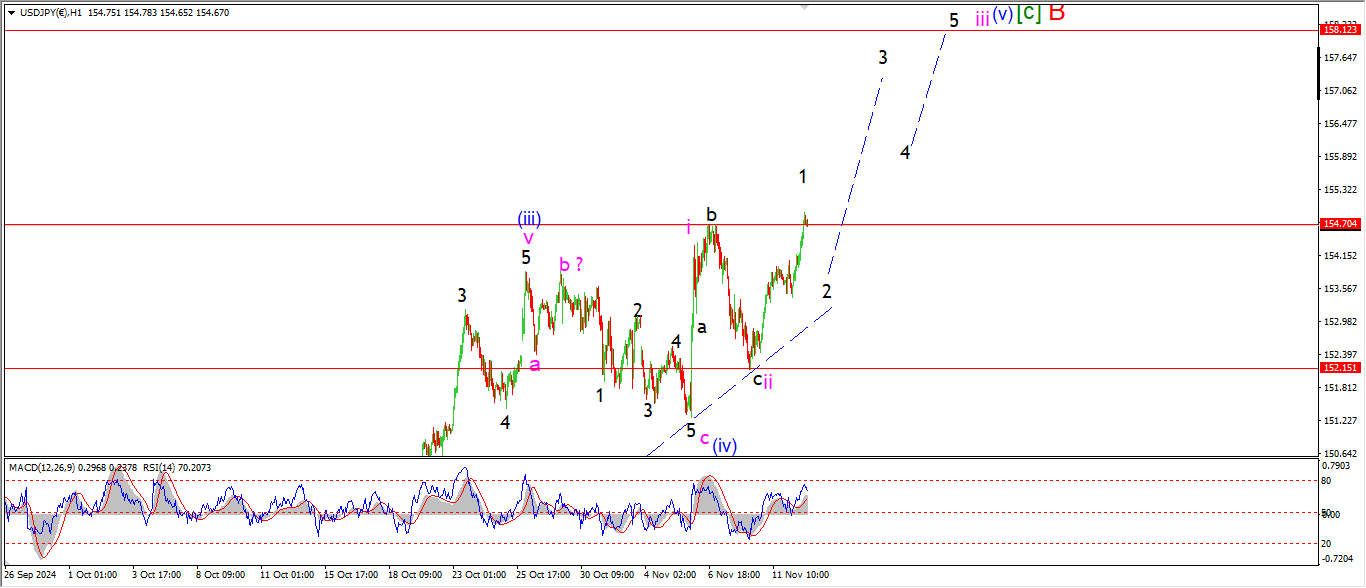
USDJPY 1hr.
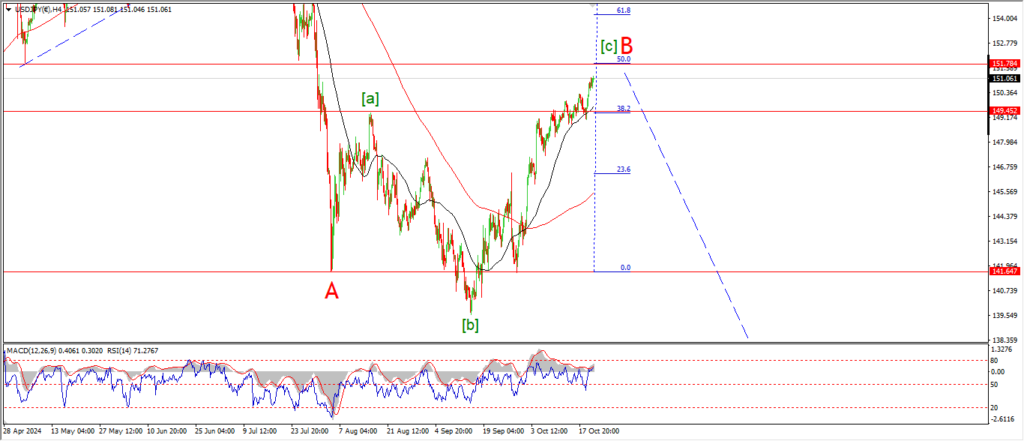
USDJPY 4hr.
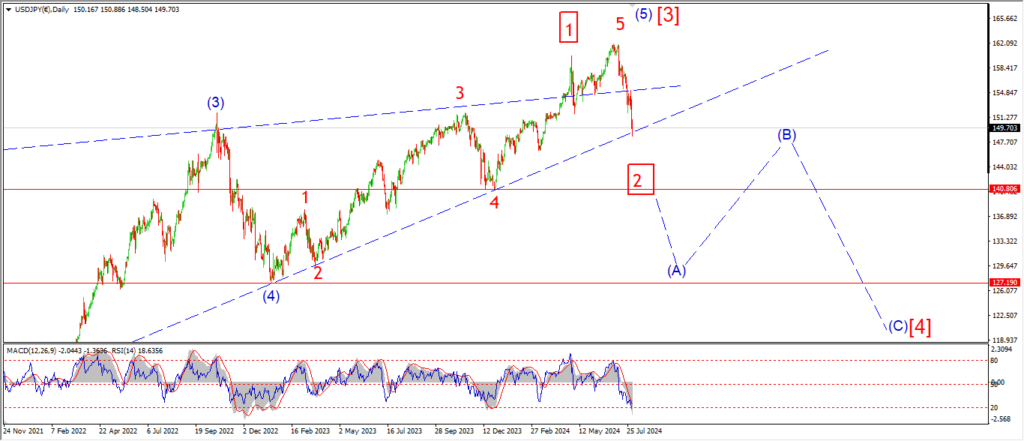
USDJPY daily.
USDJPY has reached back above resistance at 154.70 again today suggesting that wave ‘iii’ is now in play here.
I can see a five wave pattern off the wave ‘ii’ lows,
and that takes the wave ‘1’ label.
Wave ‘iii’ should now trace out five waves up as shown over the coming week,
and the wave ‘ii’ level must hold at 152.15.
Tomorrow;
Watch for wave ‘2’ to create a higher low soon,
and then wave ‘3’ of ‘iii’ should rally up towards the 157.00 level if all goes well.
DOW JONES.
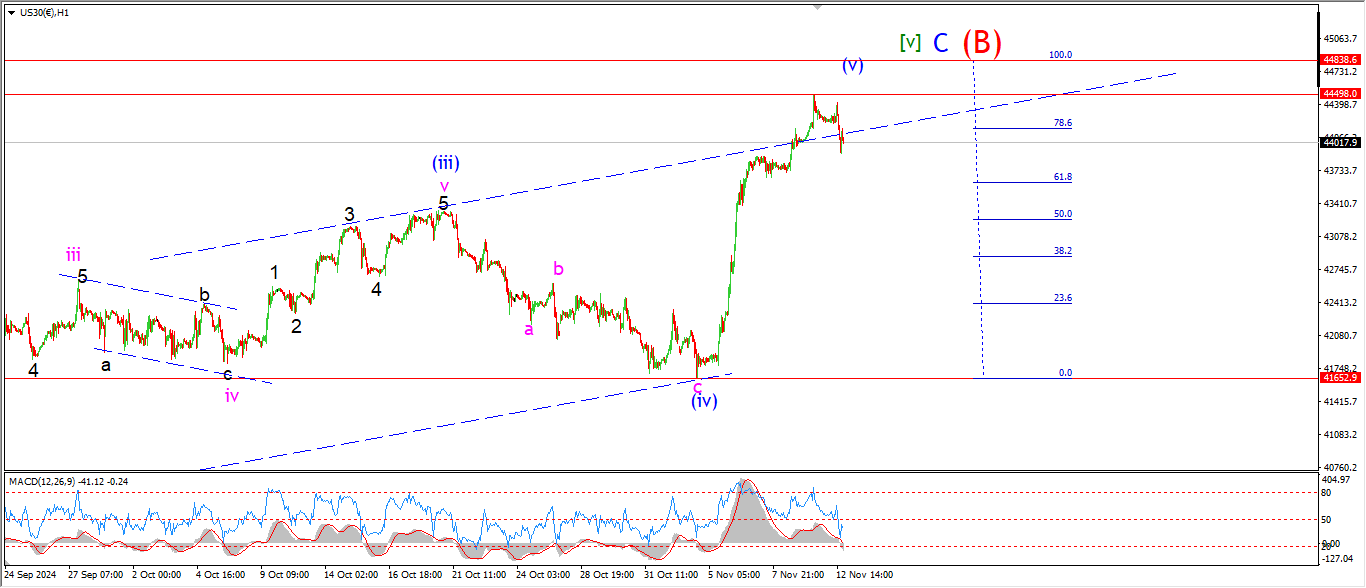
DOW 1hr.
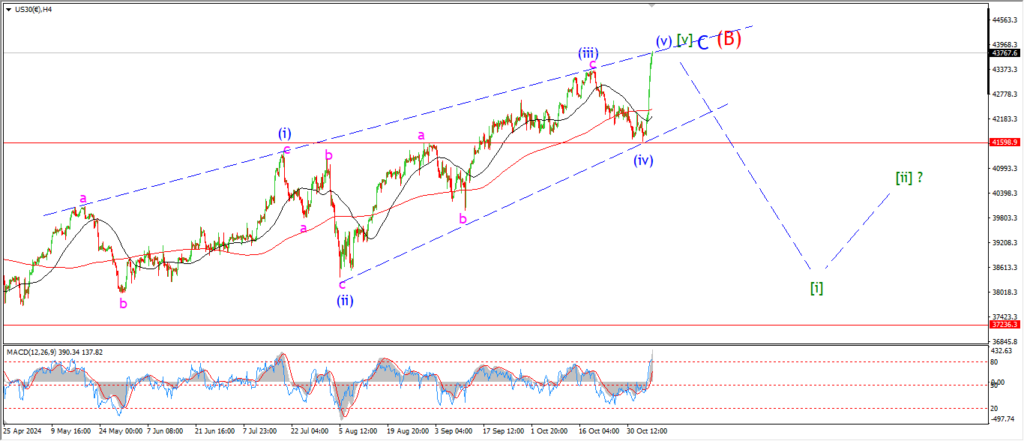
DOW 4hr
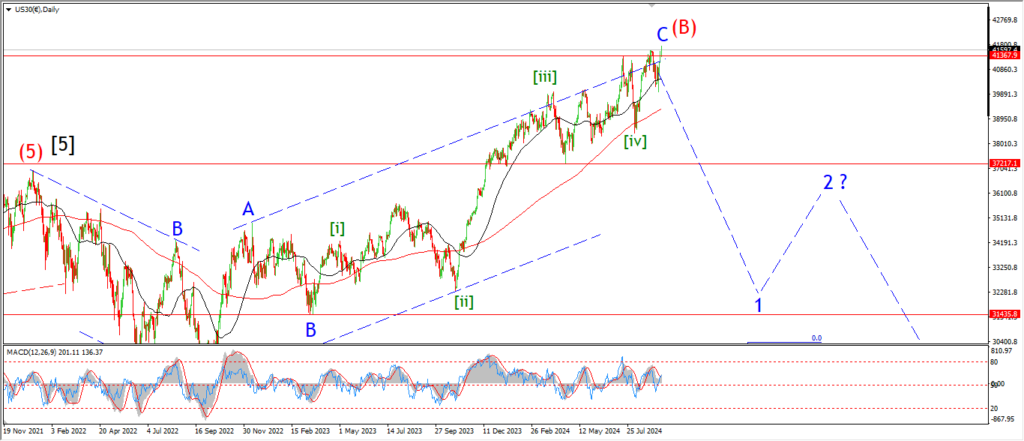
DOW daily.
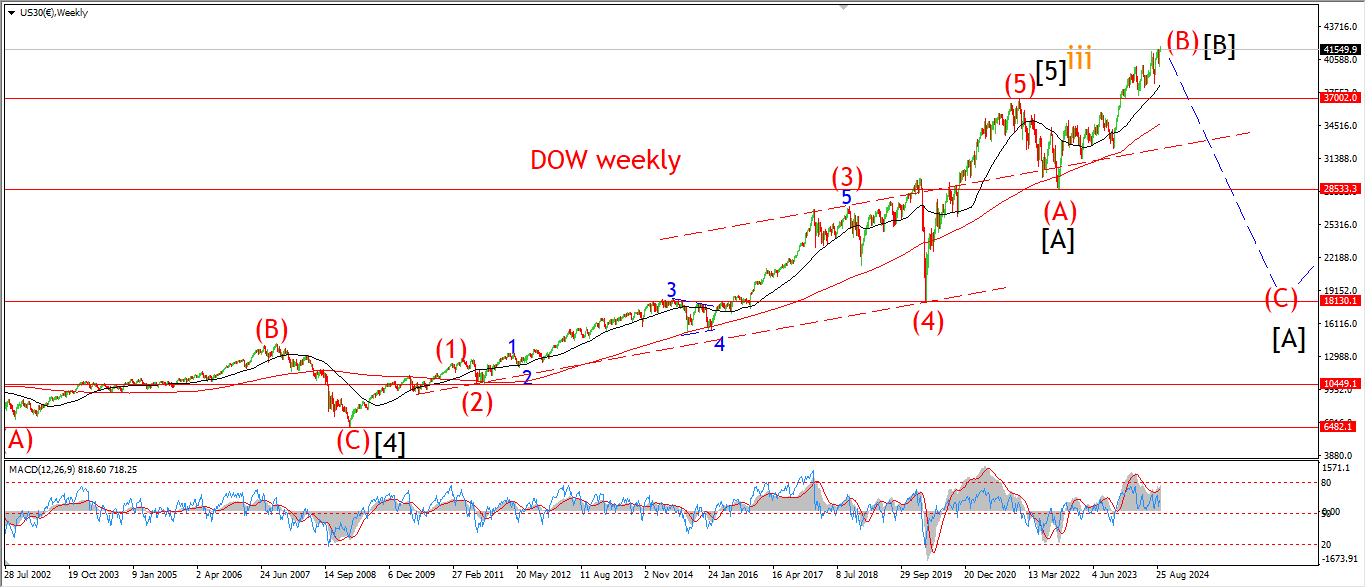
A small decline off that new high is as much as you might expect today to be honest.
It is interesting that we are at a point now where wave (v) should lose momentum to the upside,
as it approaches the equality level with wave (i) blue.
This decline may prove corrective this week,
but if the market rallies again to meet the 100% Fib level over the coming days,
I think this will actually serve to increase the probability of the Fibonacci relationship.
Where wave (v) slows down as equality approaches.
The test then comes at the 100% level just above.
Tomorrow;
Watch for wave (v) to come to a close at or near the equality level at the 100% FIB.
GOLD
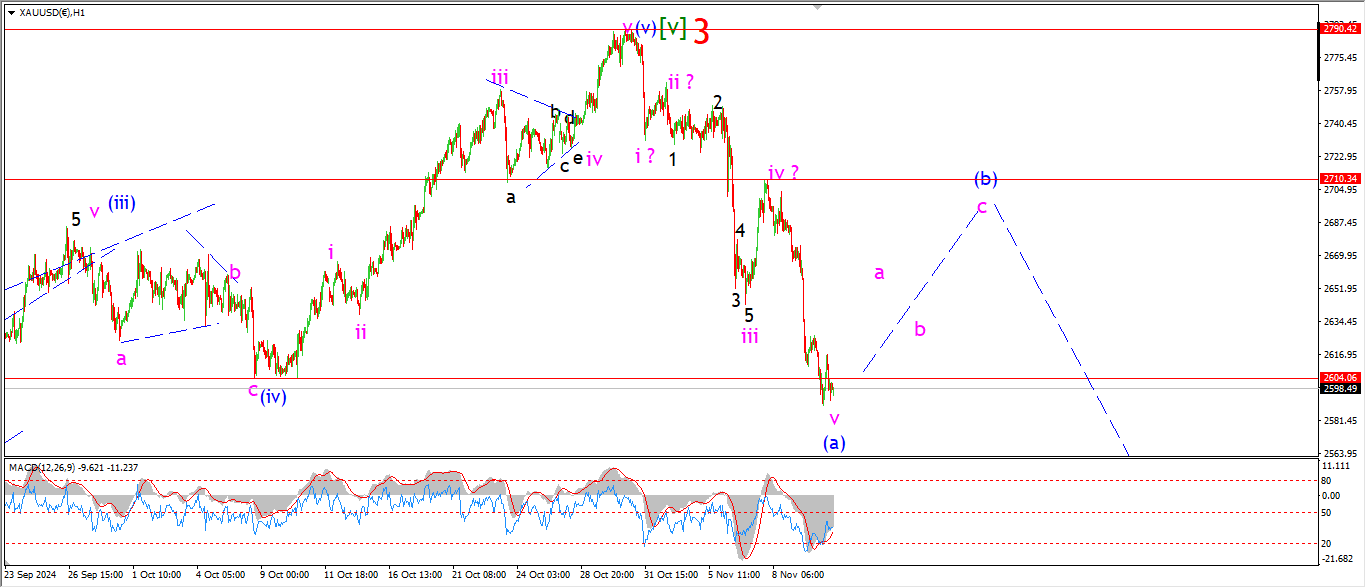
GOLD 1hr.
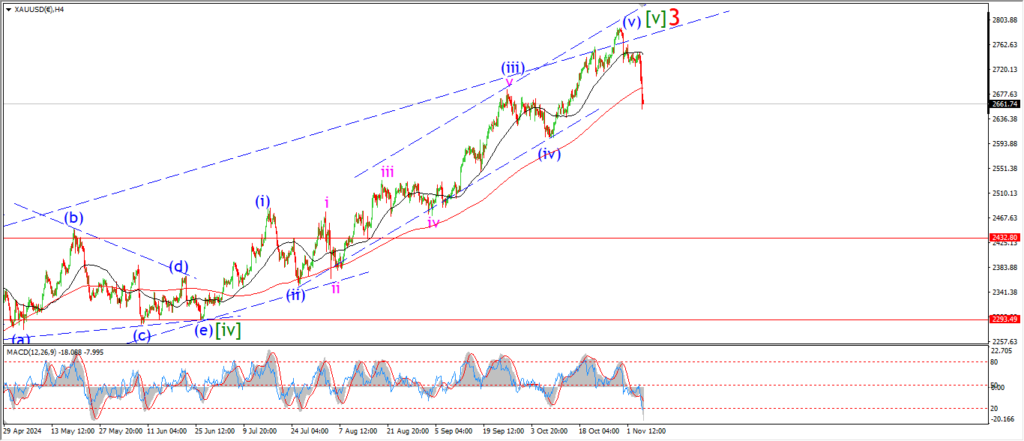
GOLD 4hr.
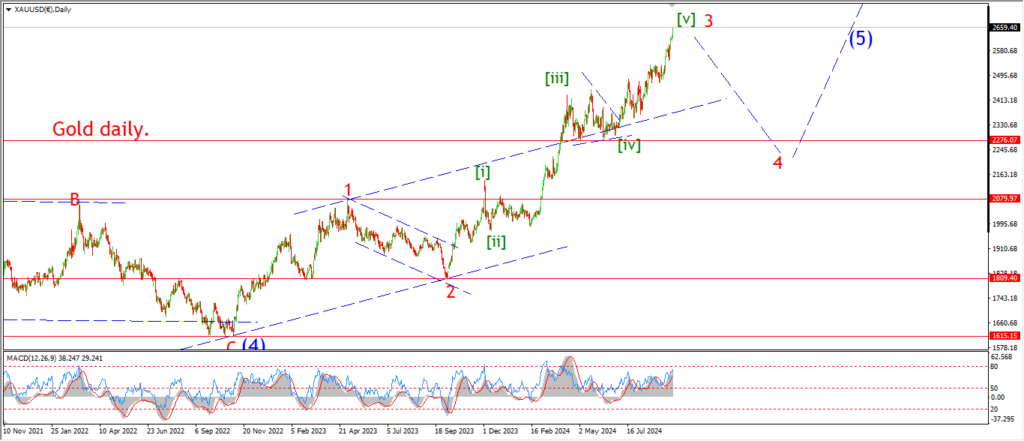
GOLD daily.
I have settled on a preferred count for gold today,
a five wave decline off the top into wave (a) of [a] of ‘4’.
If this count proves correct,
then we have a pretty long and choppy corrective decline ahead of us into wave ‘4’ red over the coming months.
Todays move has broken the initial support level of wave (iv) at 2604.
and this is the area where I am looking for wave (a) to complete,
and a correction higher to begin in wave (b) as shown.
A push back above 2650 again will signal wave (b) has begun.
Tomorrow;
watch for wave ‘a’ to push higher towards the 2650 level to signal wave (b) is underway.
CRUDE OIL.
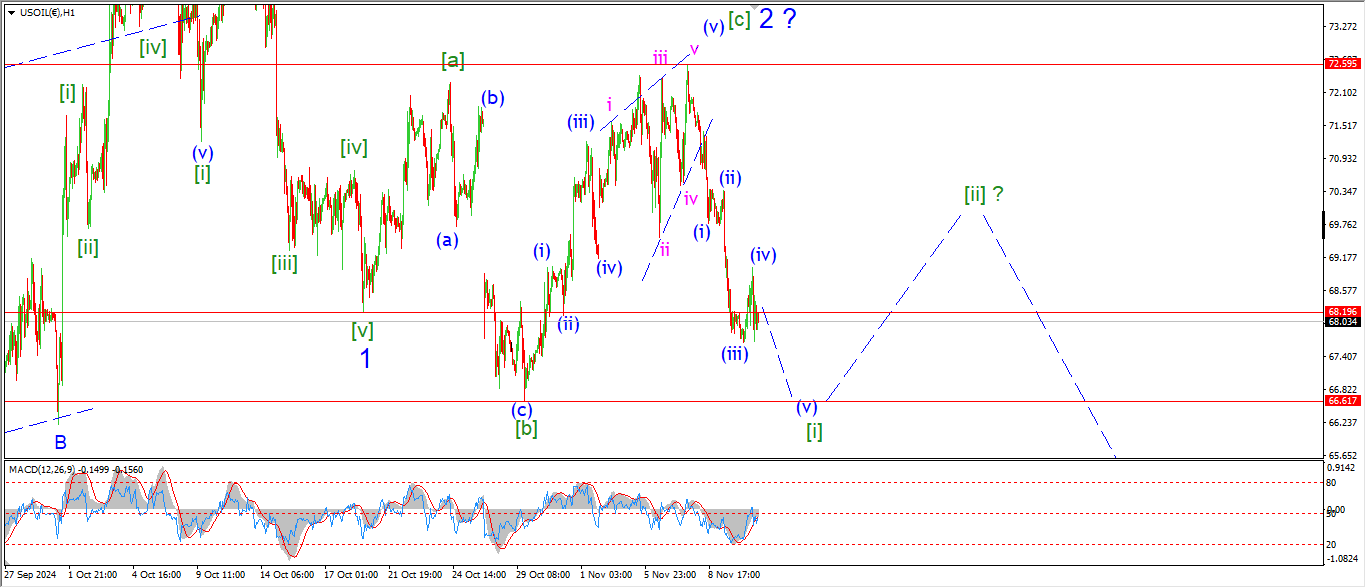
CRUDE OIL 1hr.
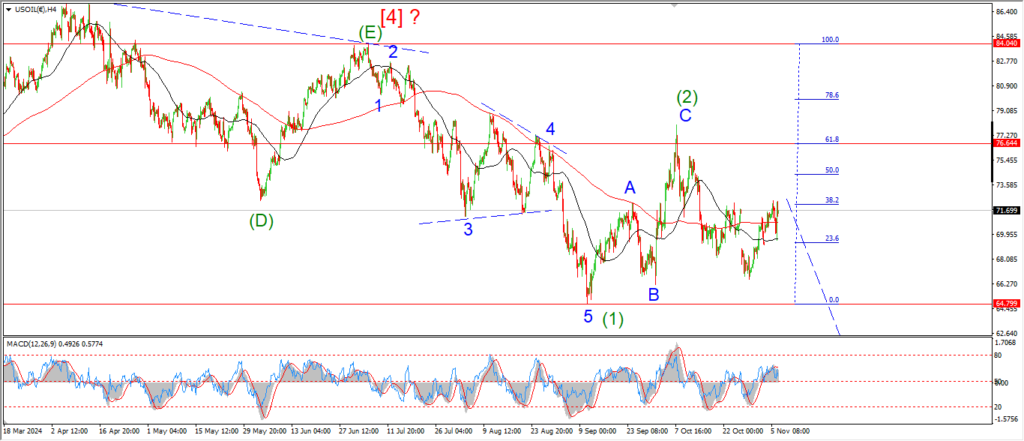
CRUDE OIL 4hr.
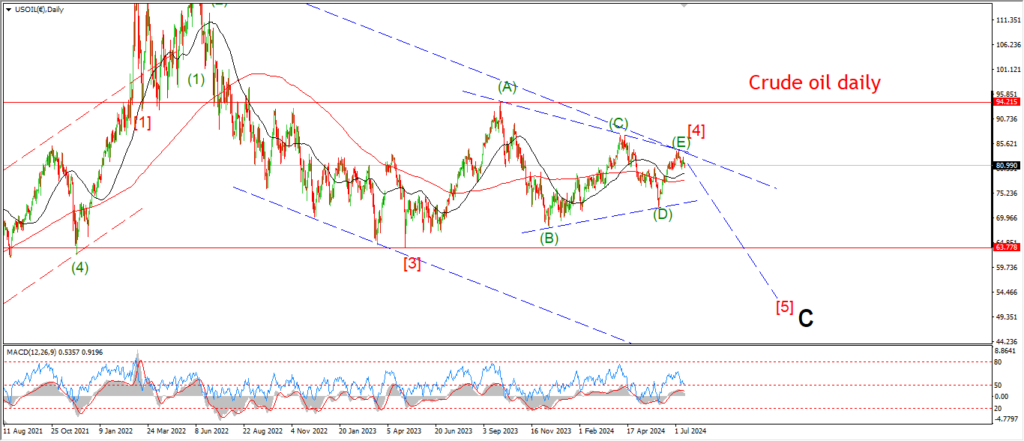
CRUDE OIL daily.
Crude is close to completing a five wave decline off the top at wave ‘2’ blue.
I am looking at a full retracement at the wave [b] lows at 66.60,
but the price is not required to hit that level to confirm this pattern.
As it stands,
the price has already broken the wave ‘1’ level at 68.20.
And now we are in the area where wave [i] will complete and wave [ii] will begin.
Tomorrow;
Watch for a rebound to begin off 66.60 into wave [ii] green as shown.
S&P 500.
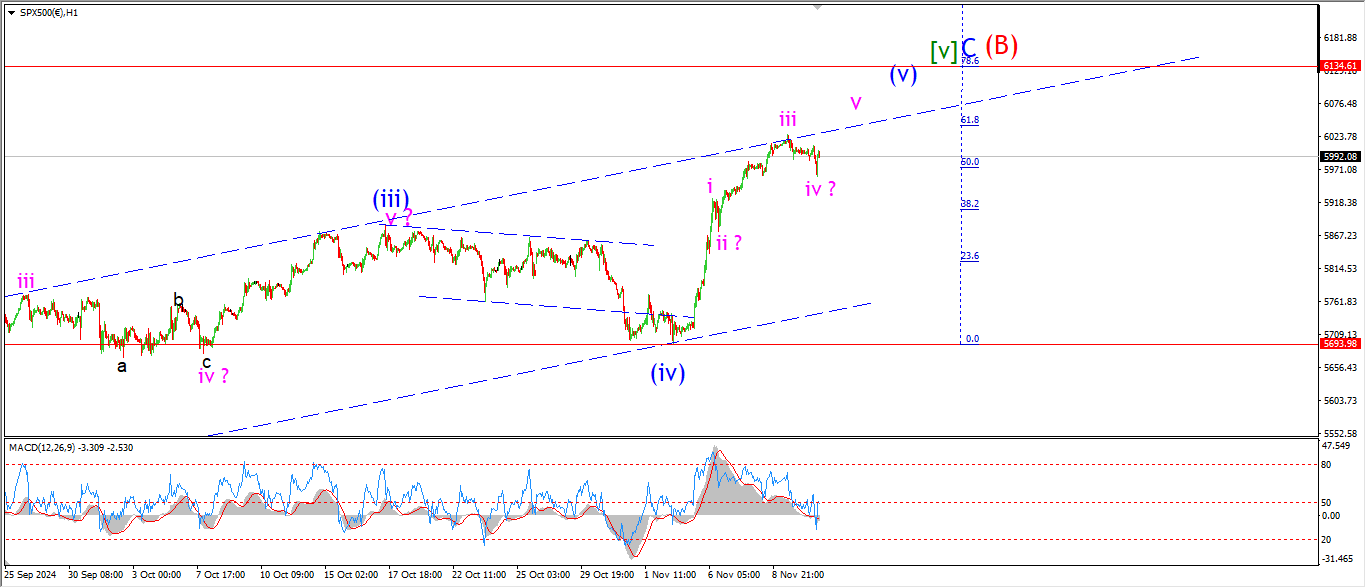
S&P 500 1hr
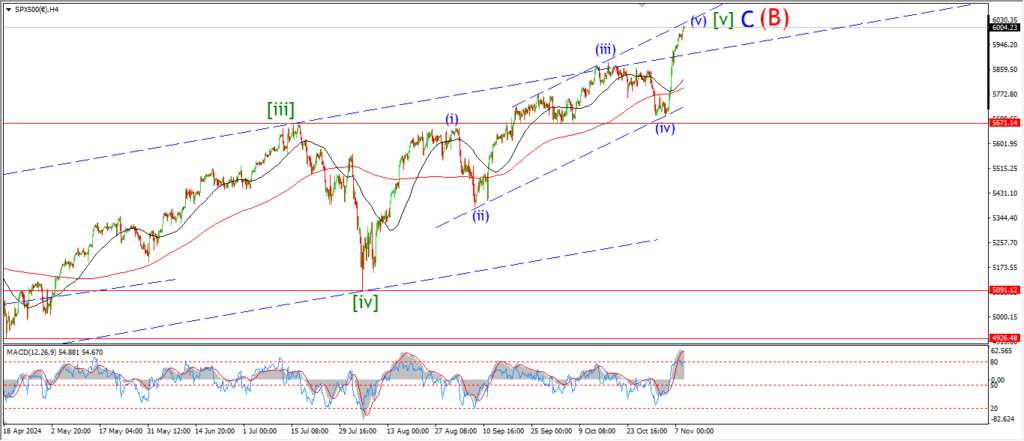
S&P 500 4hr
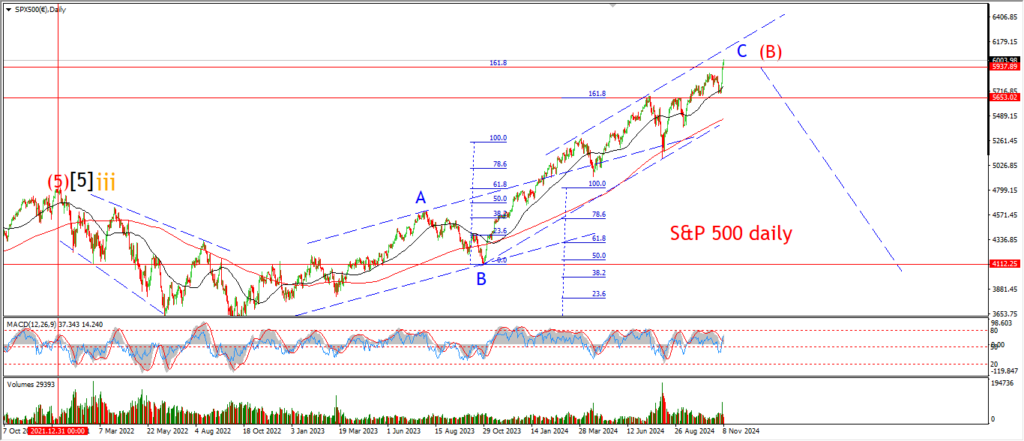
S&P 500 daily.
A small decline in the S&P today after hitting the upper trend channel line yesterday.
The drop off looks corrective and in three waves at the moment,
so I won’t read anything into it!
There is a possible five wave pattern in play here for wave (v) blue.
Todays decline is labelled wave ‘iv’ of (v).
And this allows for another pop into wave ‘v’ of (v).
the internal waves of wave (v) are decreasing in size as the wave progresses.
And that pattern suggests wave ‘v’ will be smaller than wave ‘iii’.
Tomorrow;
Watch for wave ‘v’ to break the upper trend channel line again to complete five waves up in wave (v) blue.
SILVER.
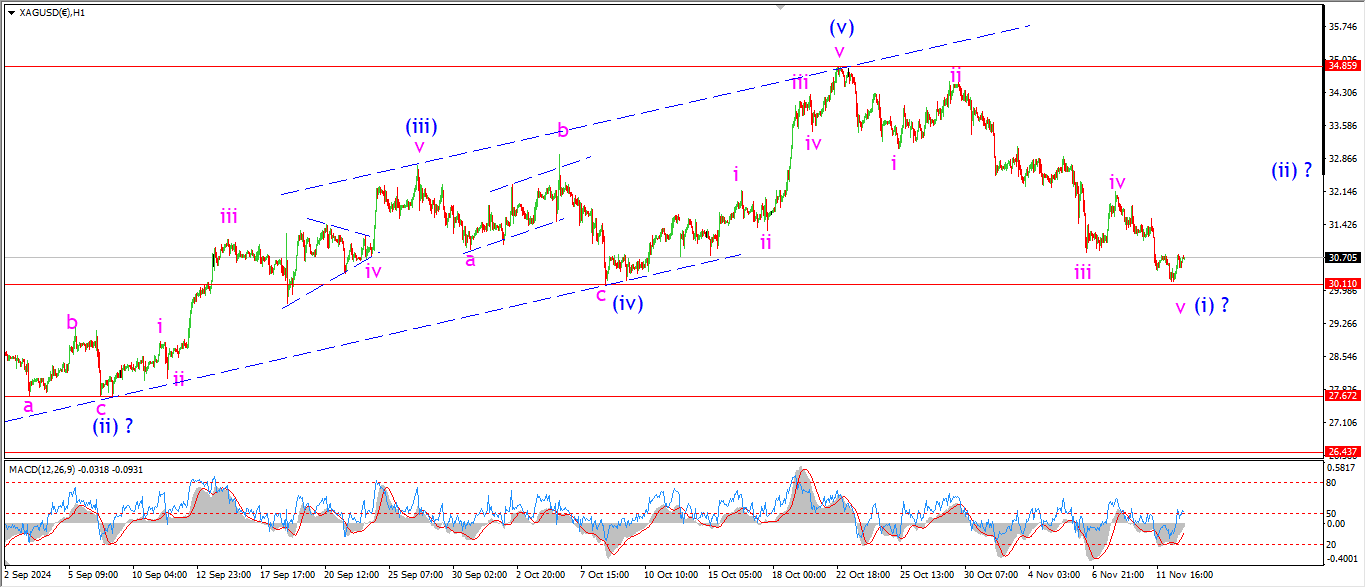
SILVER 1hr
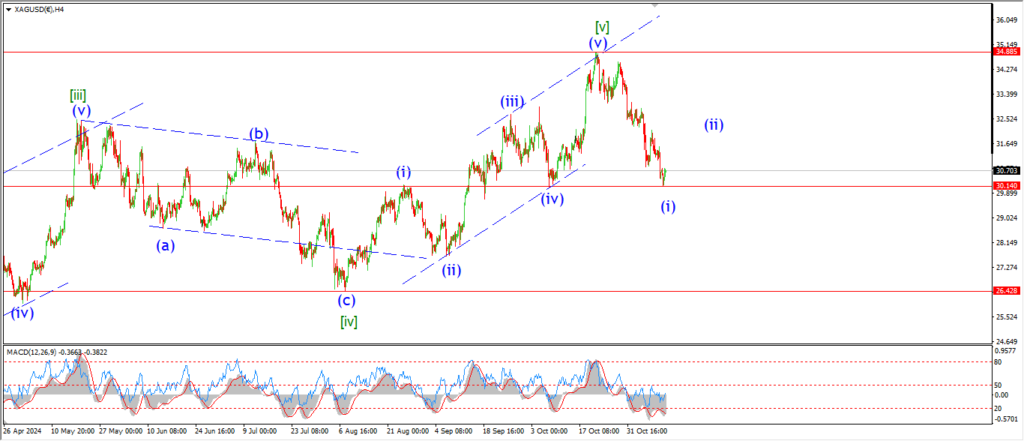
SILVER 4hr.
SILVER daily.
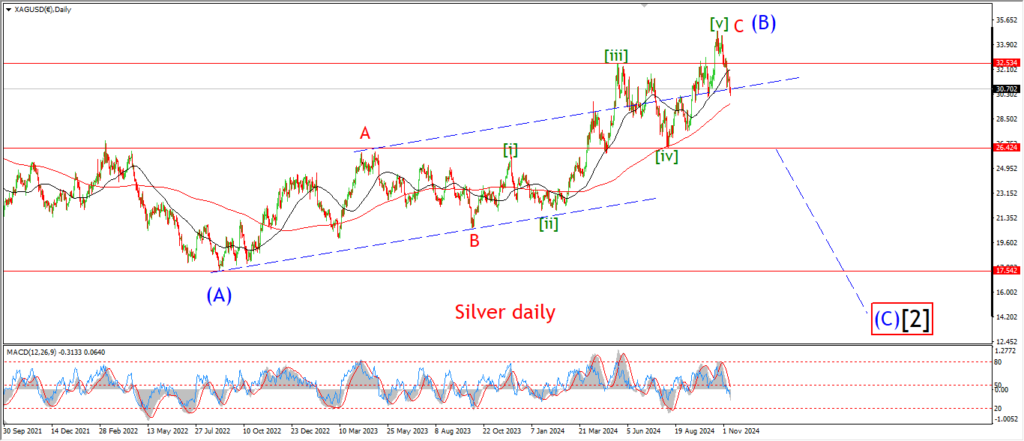
Silver is ever so close to breaking the wave (iv) low at 30.11.
So I think it is time to go over the alternate count again to give a picture of what can happen if it is correct.
Start on the daily chart;
Three waves up into the recent highs completed with a large throw over at the top of wave (B).
Wave (C) should trace out five waves down from here,
and the minimum target lies at the wave (A) lows at 17.54.
The 4hr chart shows the five wave pattern in wave [v] of ‘C’ of (B) into the recent highs.
A reversal off that level has retraced the rally in wave (v).
And that gives us wave (i) of [i] of ‘1’ of (C).
You can see how much potential there is in this pattern.
The recent decline has only just begun the pattern in wave (C).
And if this is correct,
then it will be classed as a crash for sure when complete.
The hourly chart shows a possible five wave decline in wave (i) blue,
but it is not clear if wave (i) is done just yet.
We will see how the price reacts to support tomorrow to judge that.
Tomorrow;
Watch for wave (i) down to complete a five wave decline with a break of the 30.11 support.
BITCOIN
BITCOIN 1hr.
BITCOIN 4hr.
BITCOIN daily.
….
FTSE 100.
FTSE 100 1hr.
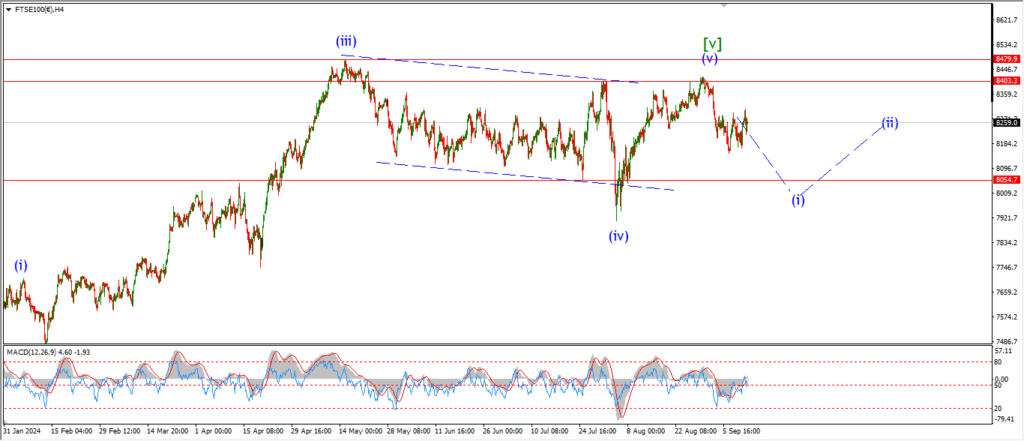
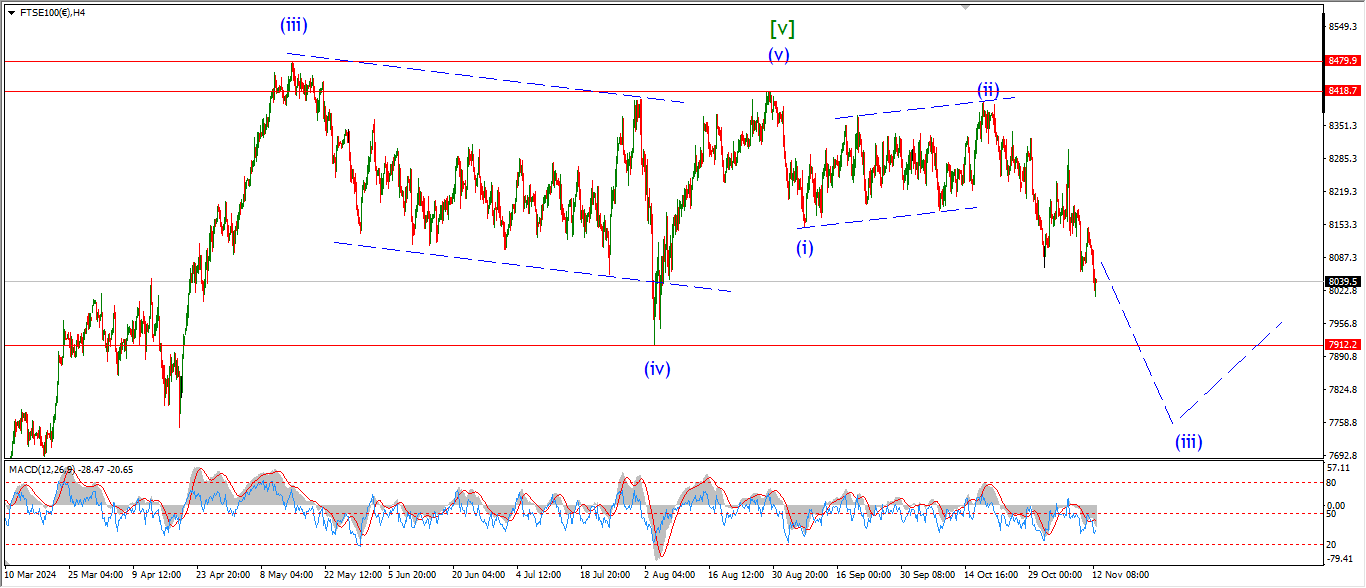
FTSE 100 4hr.

FTSE 100 daily.
….
DAX.
DAX 1hr
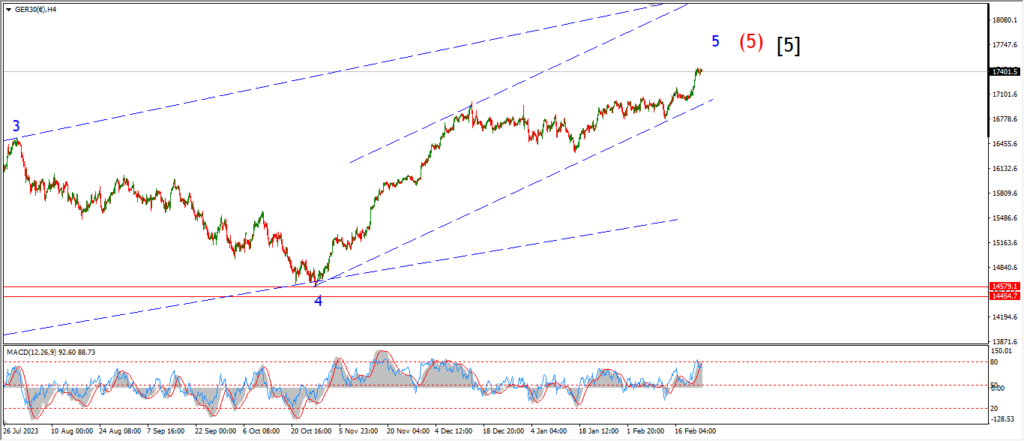
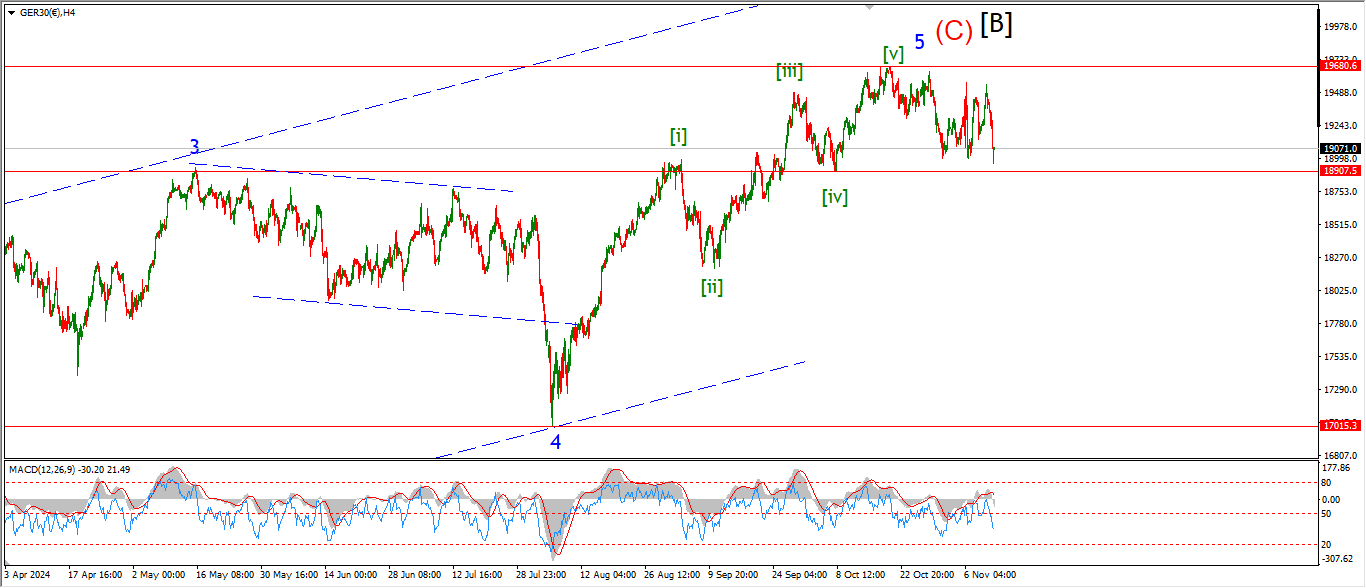
DAX 4hr

DAX daily.
….
NASDAQ 100.
NASDAQ 1hr
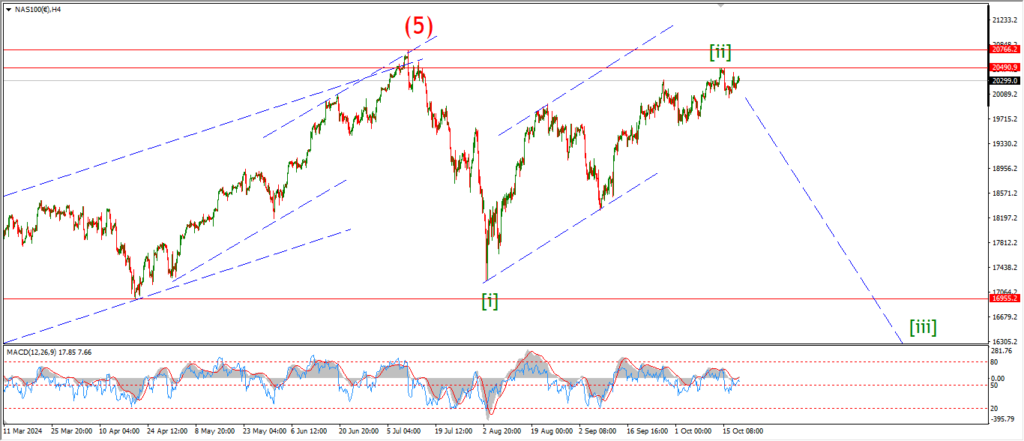
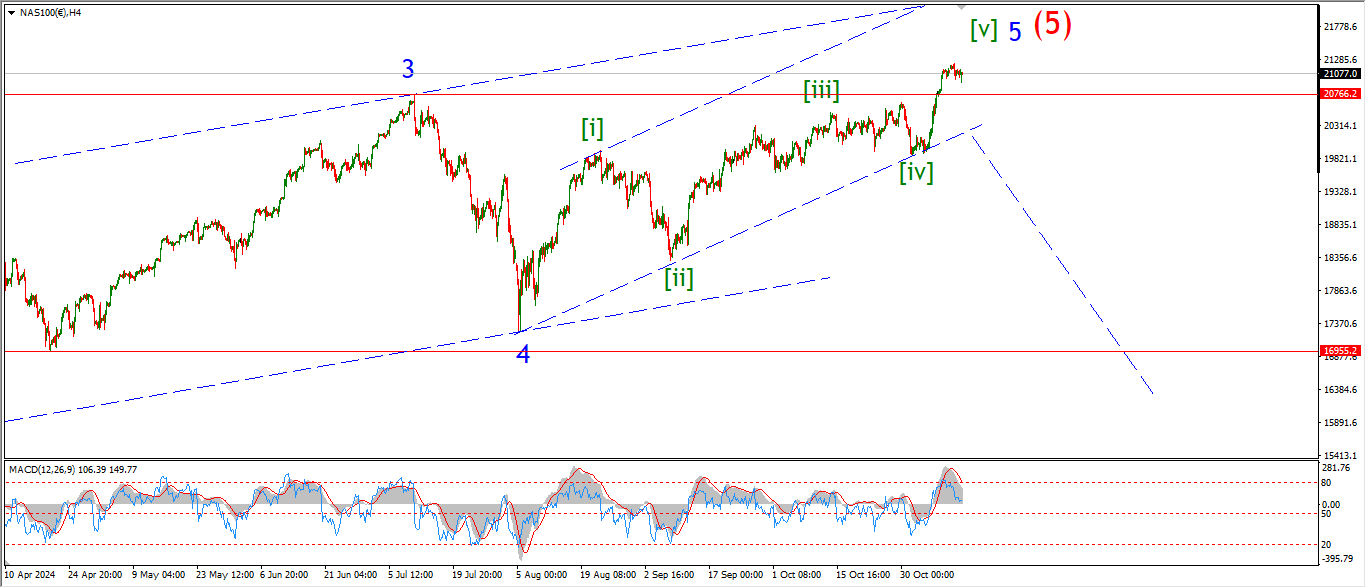
NASDAQ 4hr.
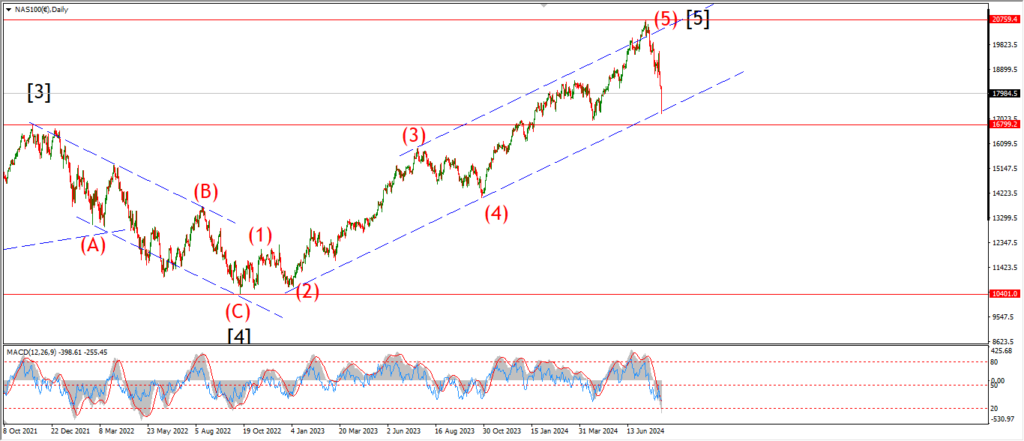
NASDAQ daily.
….