
Good evening folks and the Lord’s blessings to you.
EURUSD.
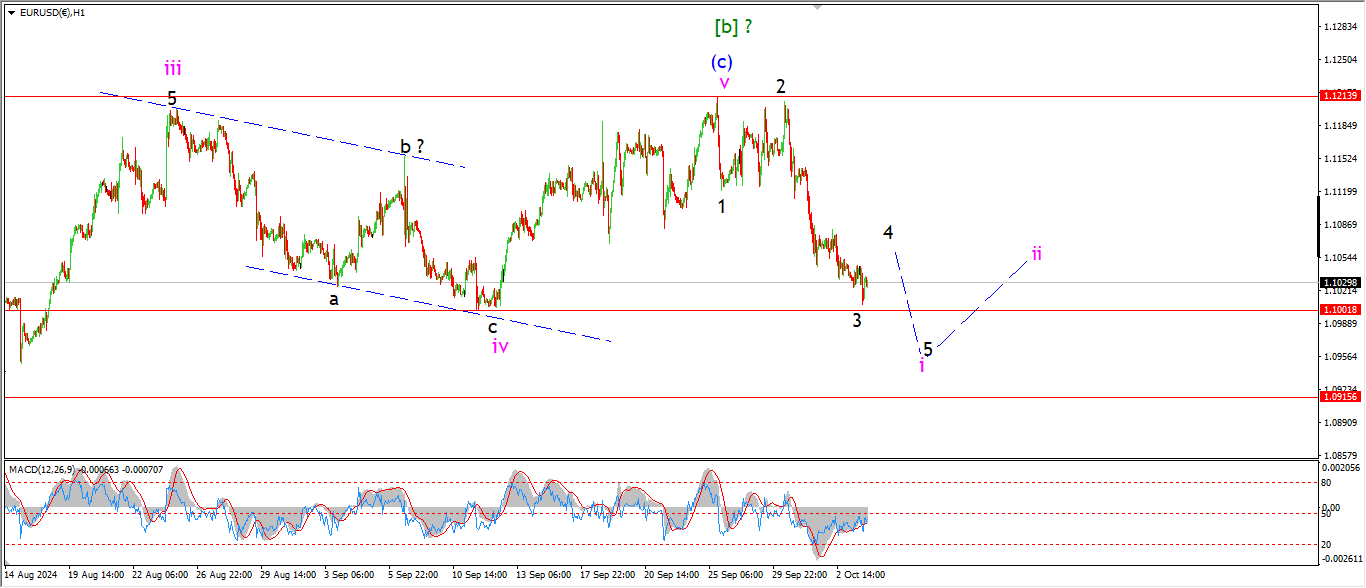
EURUSD 1hr.
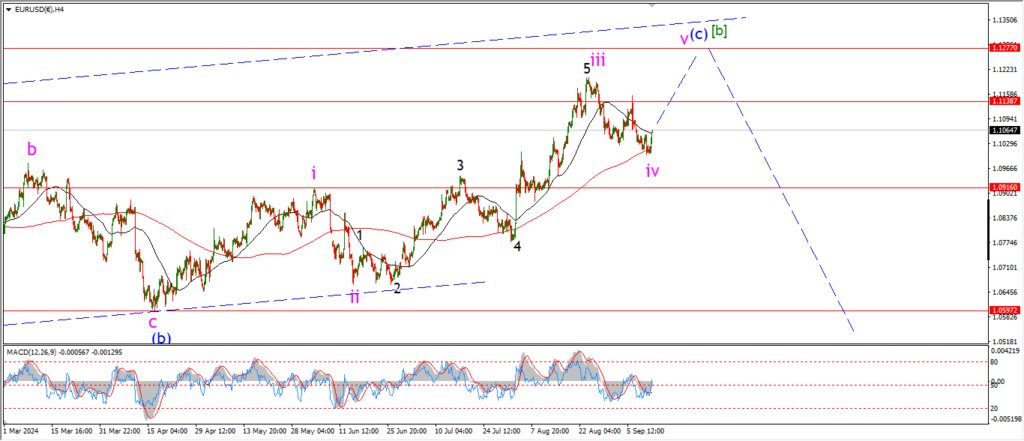
EURUSD 4hr.
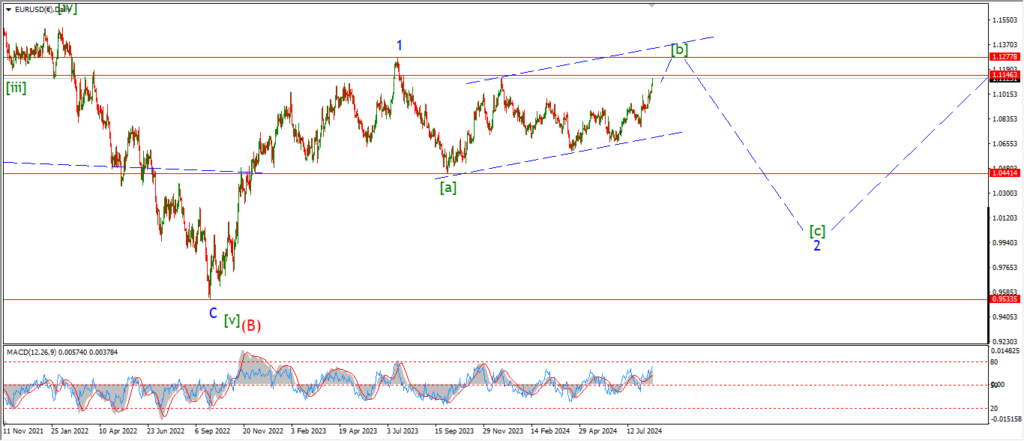
EURUSD daily.
I think we are looking at a clearer five wave pattern lower now forming in EURUSD.
We are not quite there yet,
I am looking for a correction in wave ‘4’ followed by a drop again in wave ‘5’ to complete the larger five waves down.
Hopefully that step lower into wave ‘5’ can complete by tomorrow evening.
And then next week we can look for a bearish lower high to begin.
Tomorrow;
Watch for wave ‘4’ to track sideways in a corrective move,
then wave ‘5’ should turn lower again to complete wave ‘i’.
GBPUSD
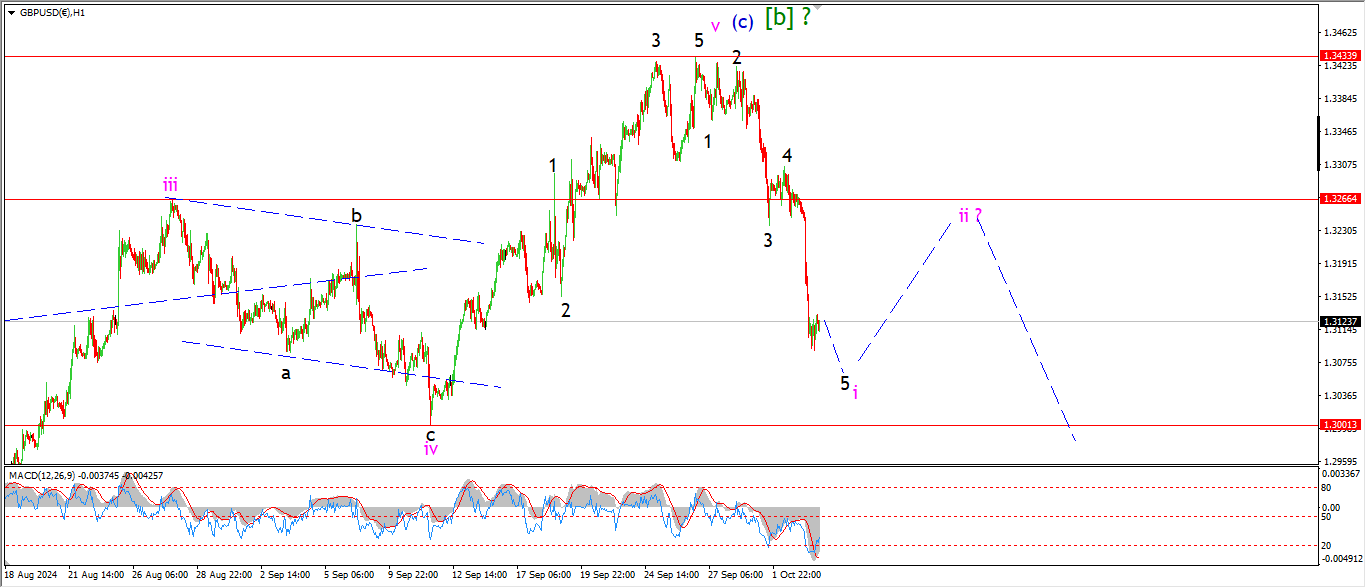
GBPUSD 1hr.
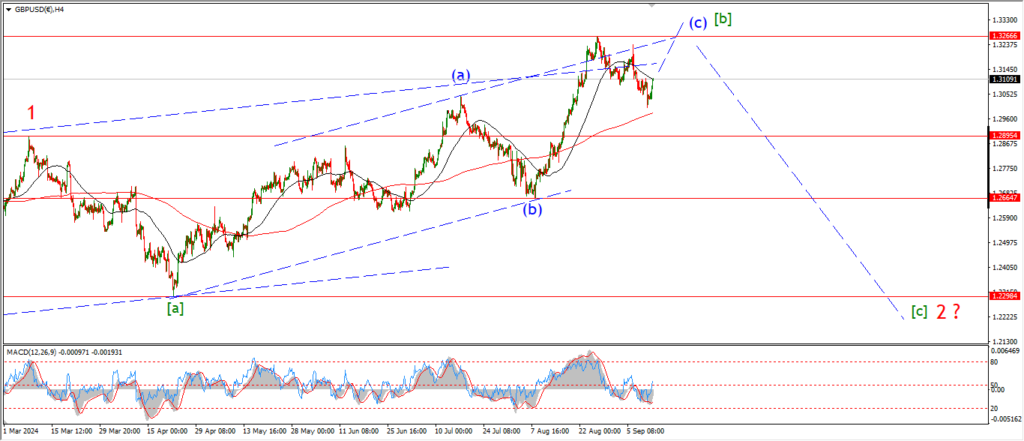
GBPUSD 4hr.
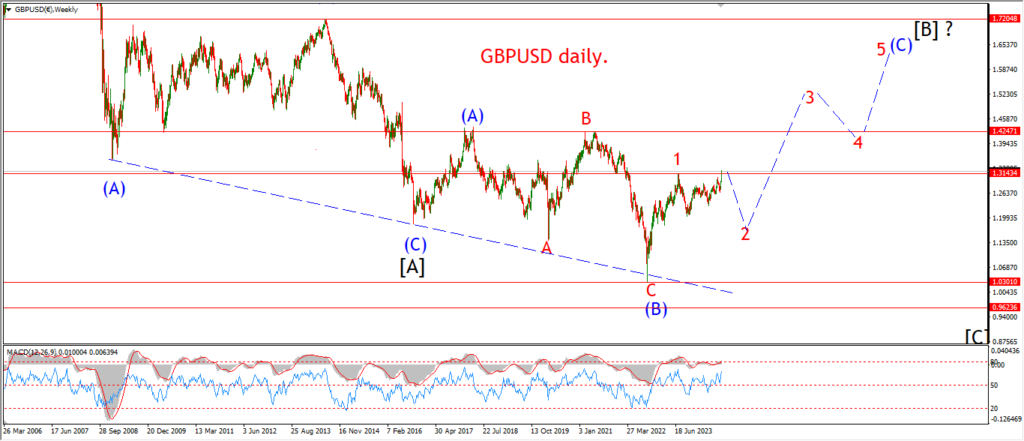
GBPUSD daily.
Cable made a big leap lower today in wave ‘5’ of ‘i’ and that wave may not be done yet!
WAve ‘i’ down has almost achieved the desired goal of hitting the previous wave ‘iv’ lows at 1.3000.
I would prefer to see that level broken,
but I can’t complain too much after the progress made this week.
The action off that wave [b] high is definitely impulsive in nature at the moment.
And I fully expect to see a bearish lower high build next week in wave ‘ii’ as shown.
Then the fireworks can start as the price shifts lower into wave ‘iii’ down.
Tomorrow;
Watch for wave ‘i’ pink to complete with one more spike into support.
I suspect wave ‘ii’ may even begin before the end of tomorrow session.
USDJPY.
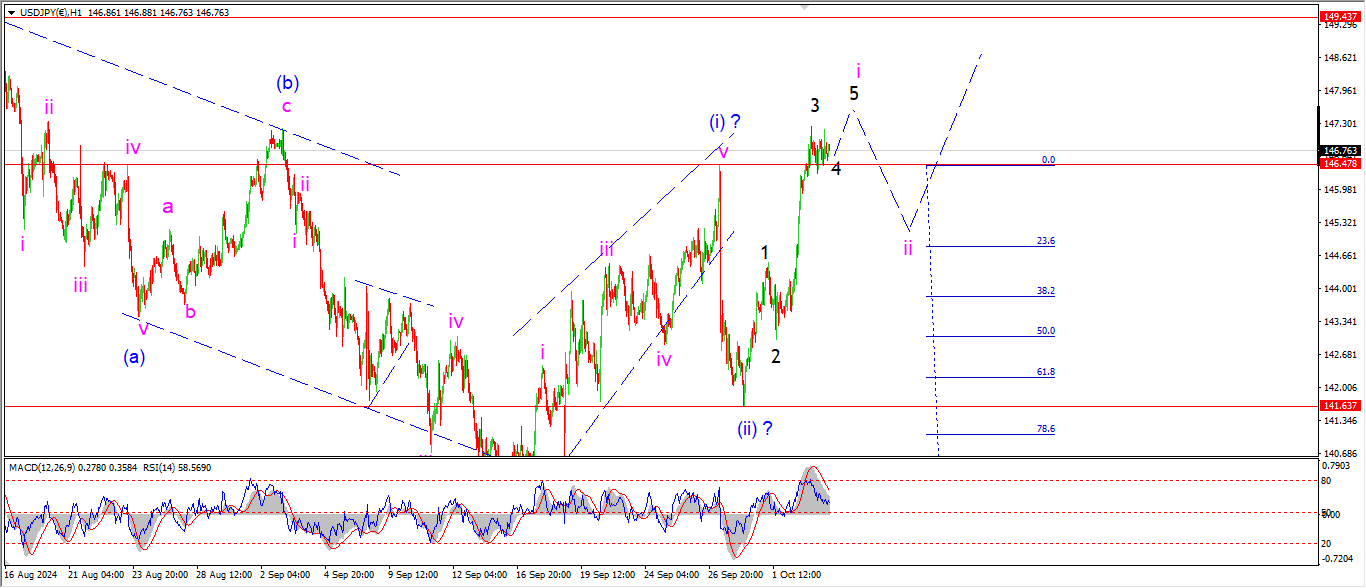
USDJPY 1hr.
USDJPY 4hr.
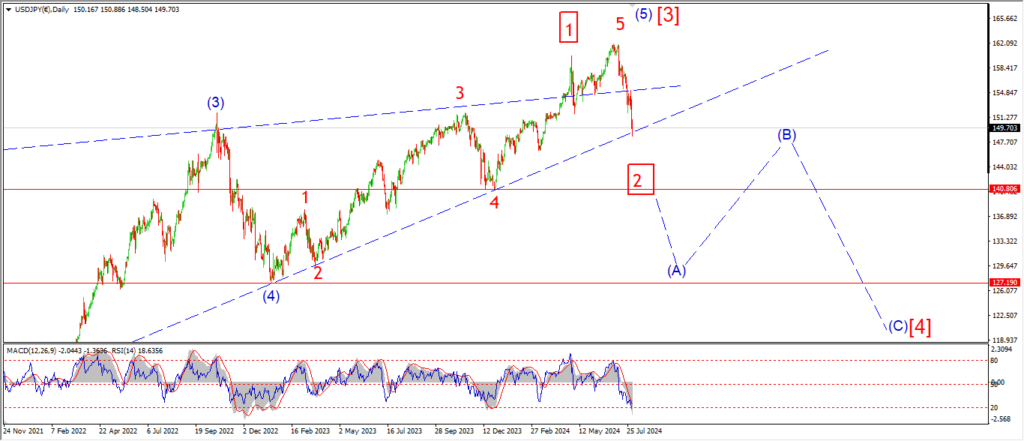
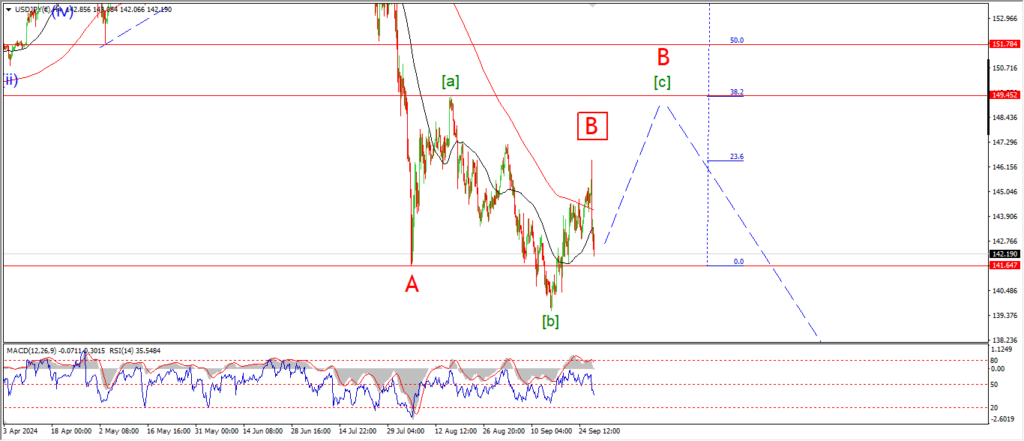
USDJPY daily.
It is the exact opposite picture developing in USDJPY tonight.
The price has broken above the recent wave (i) high today which is a solid vote in favor of the bullish count,
And I suspect wave ‘i’ is not yet complete.
the price has corrected sideways most of the day,
and I am suggesting a triangle in wave ‘4’ as the count.
Wave ‘5’ should punch higher again tomorrow in this scenario.
And then I can look lower into wave ‘ii’ to build a higher low next week.
Tomorrow;
Watch for wave ‘i’ of (iii) to complete a five wave rally as shown.
DOW JONES.
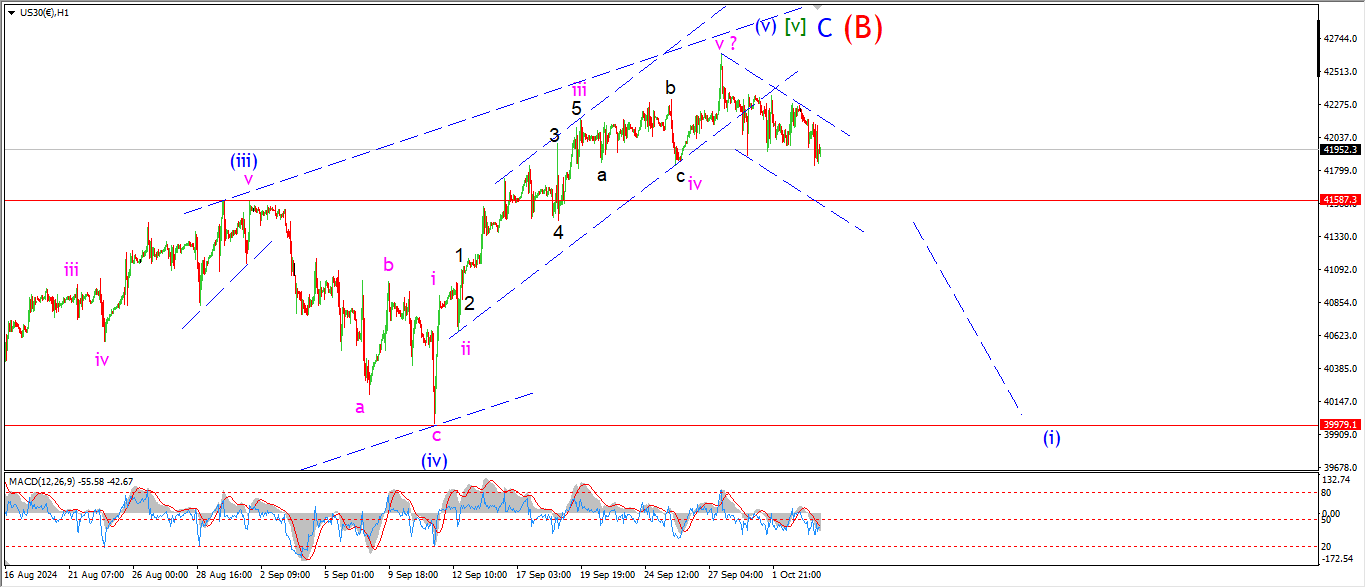
DOW 1hr.
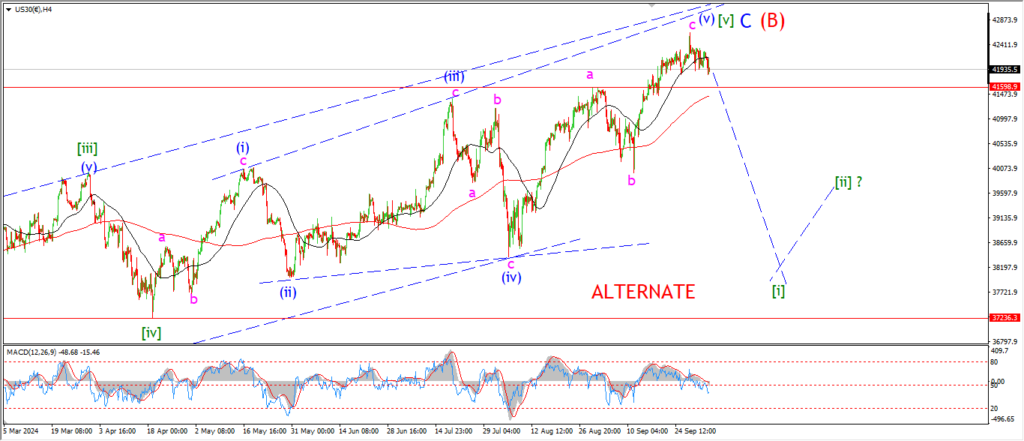
DOW 4hr
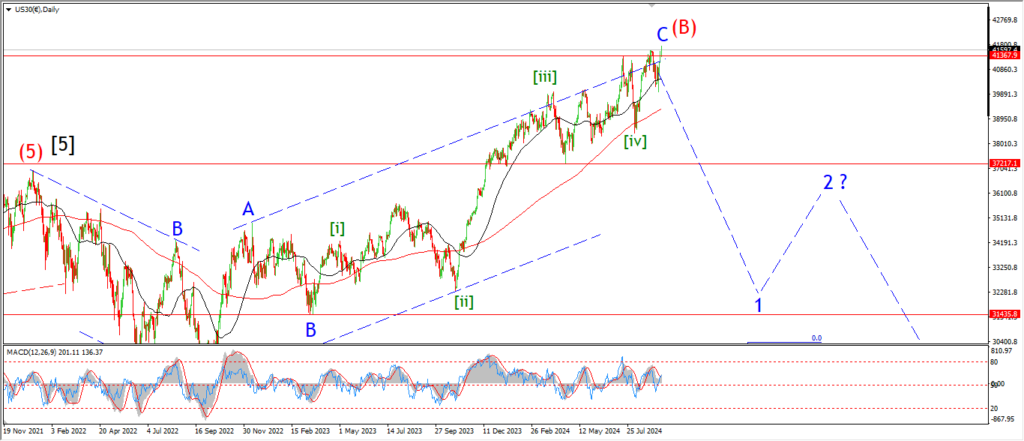
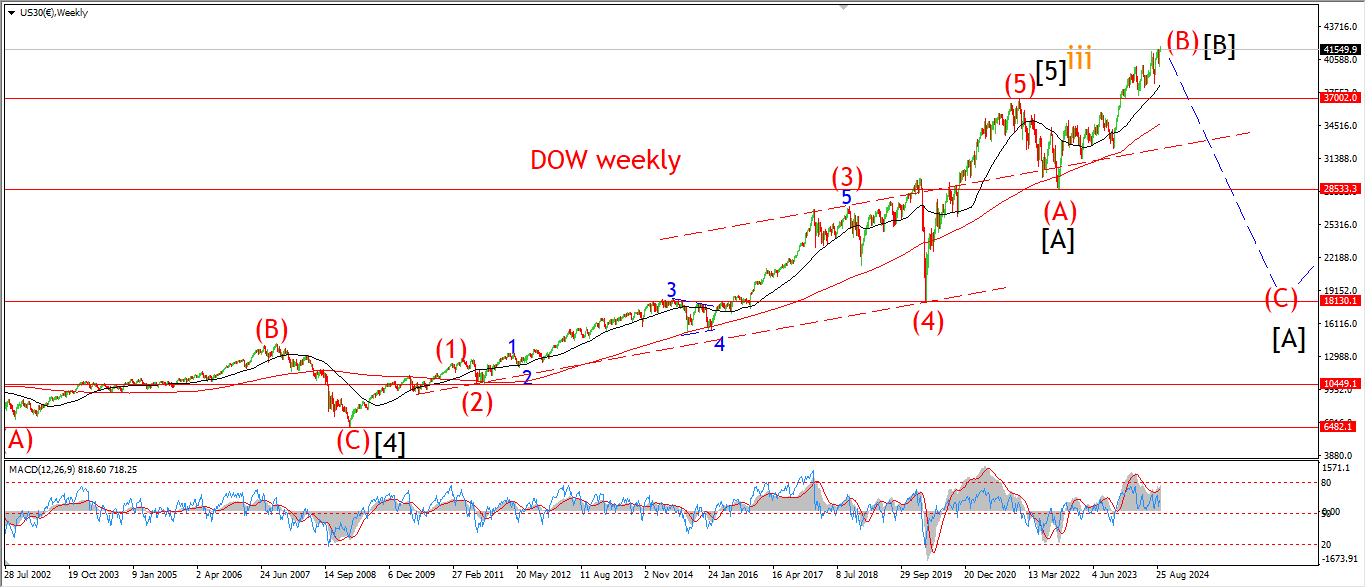
DOW daily.
The Dow has spent the day drifting sideways without anything to show for the day.
So I am going to leave the hourly chart without comment tonight and focus on the 4hr and daily.
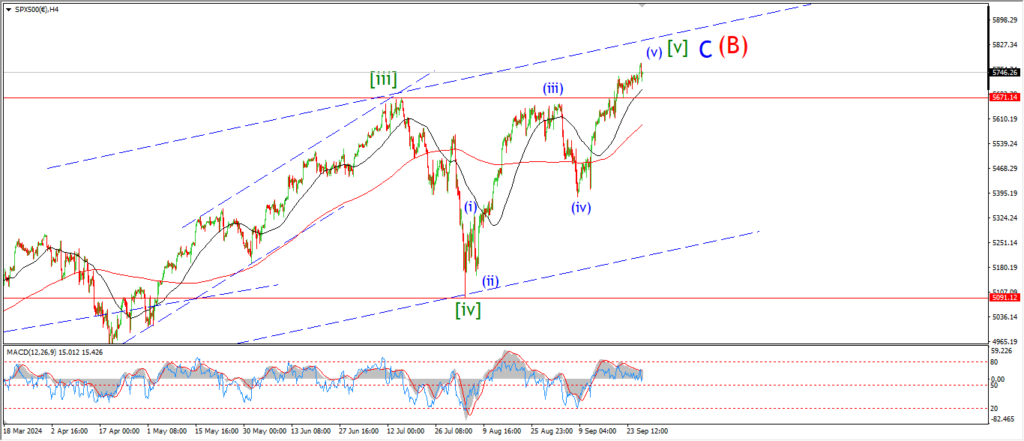
The 4hr chart shows the alternate count for that final run higher in wave [v] green.
this involves an expanded wedge pattern with wave (v) of [v] recently completing just below the upper trend line.
the market is in very much the same position we saw twice previously this summer.
Momentum is about to go negative off the top of a large run up over the previous months.
So that fact alone suggests the tide is about to change here.
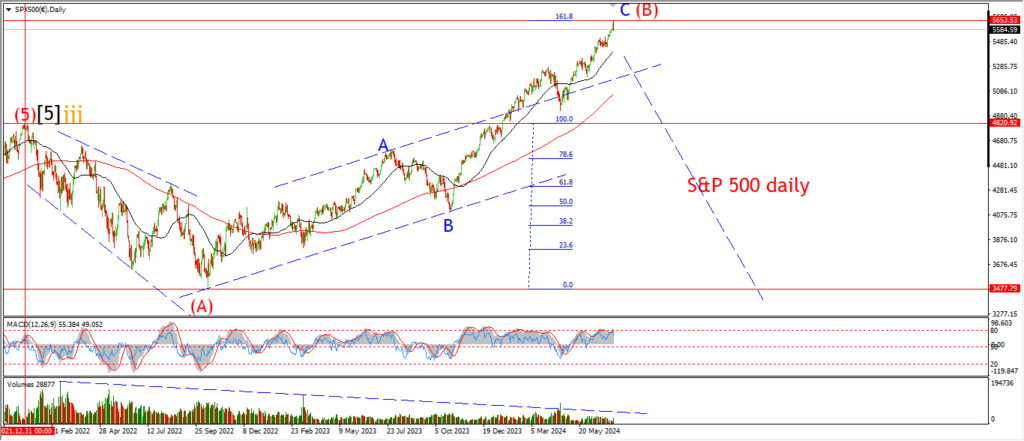
the Daily chart shows the more traditional count with a throw over in place at the top of wave [v] green.
And the momentum indicators have topped out and flat lined again in the last week.
Tomorrow;
Lets see if the downside can pick up some speed.
If that does happen,
the wave count picture may become clearer.
GOLD
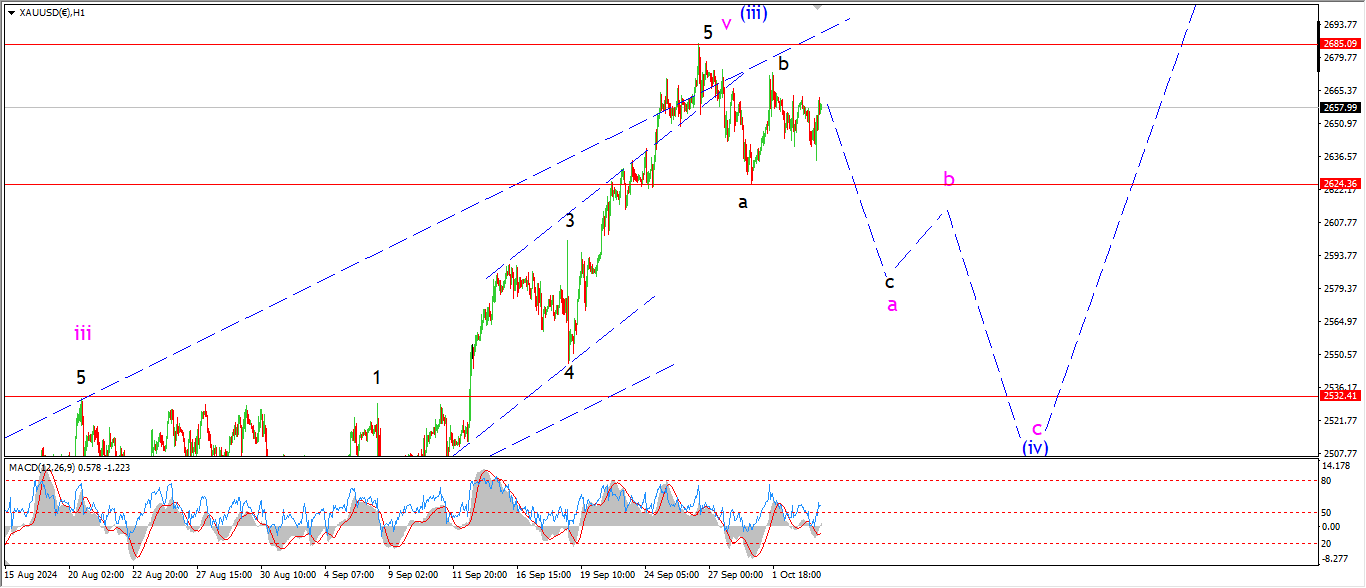
GOLD 1hr.
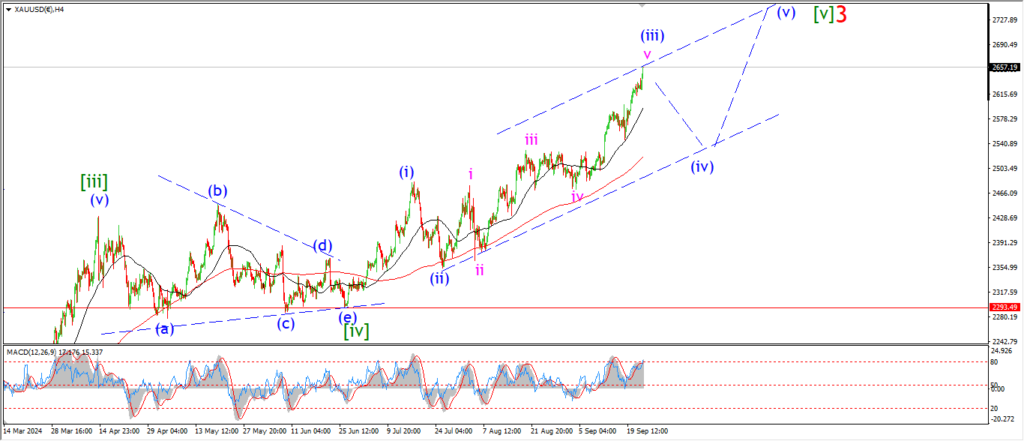
GOLD 4hr.
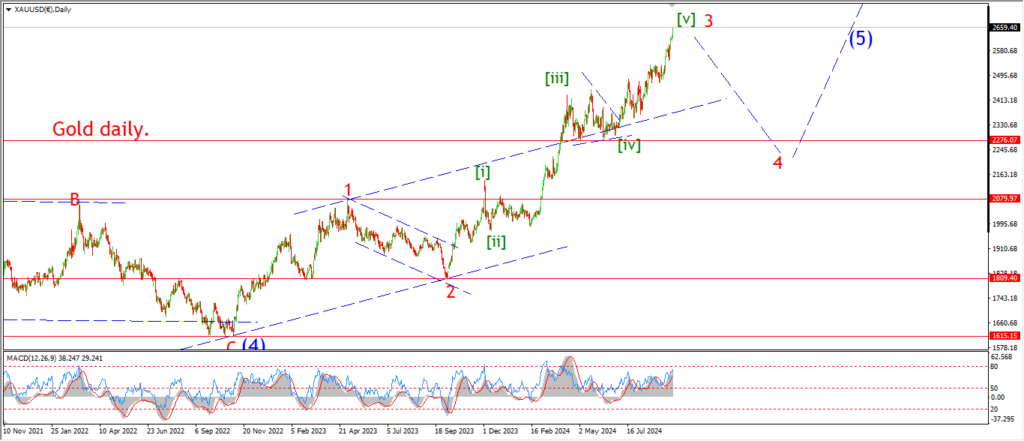
GOLD daily.
I am a little bit concerned with the hourly count tonight as the price has failed to extend lower as expected yet.
But I am willing to give wave ‘a’ another chance tomorrow to see if the price will turn lower.
Tomorrow;
Watch for the price to hold below the wave (iii) high again.
A break of 2624 again will confirm the count for wave ‘a’ and we can then look for a final low below 2600.
CRUDE OIL.
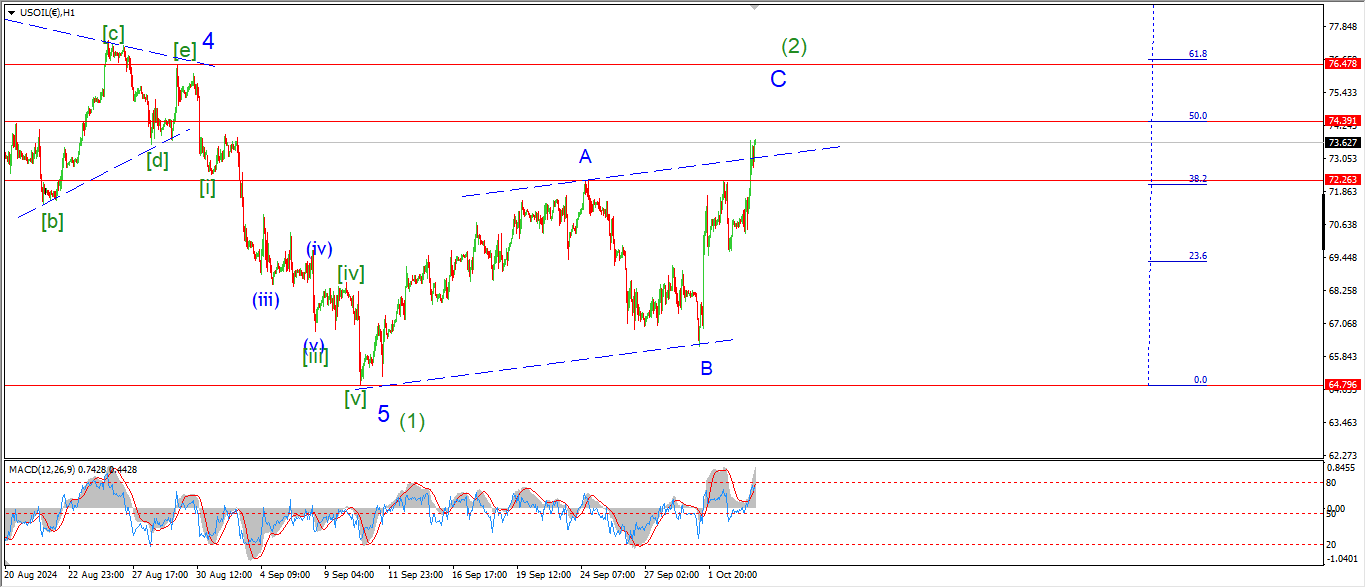
CRUDE OIL 1hr.
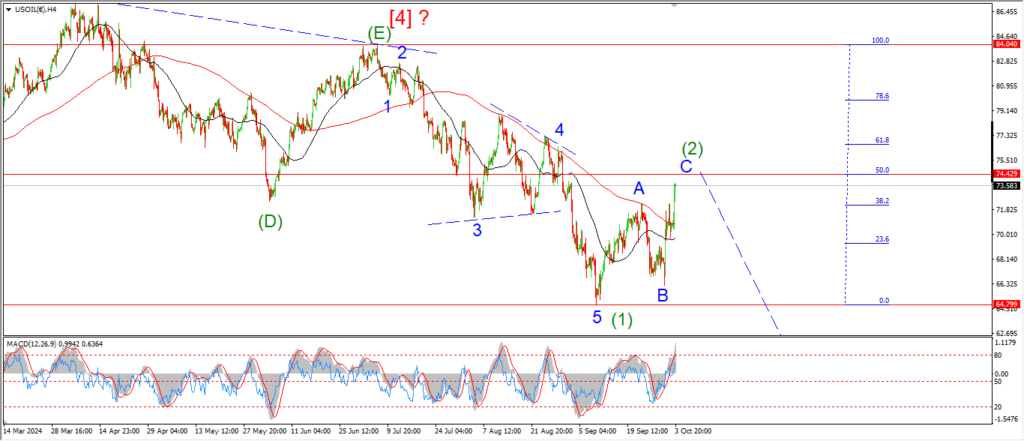
CRUDE OIL 4hr.
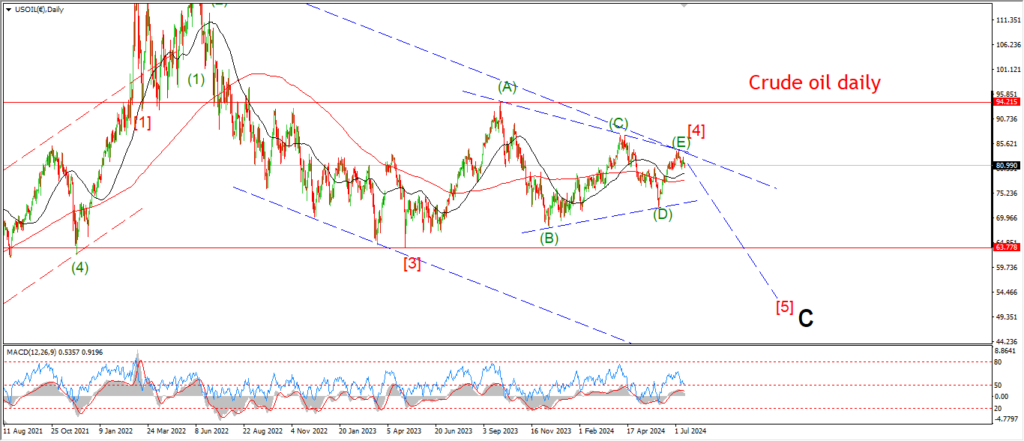
CRUDE OIL daily.
I am starting fresh tonight with the a new count in Crude.
The action this week has broken too many rules to try and shoe horn the market into the previous count.
So its time to rethink what is going on here.
If we start on the 4hr chart.
I am counting the whole decline off the wave wave [4] triangle high as wave (1) of [5] now.
the action actually fits quite well into that mold.
The retracement higher off the wave (1) low is wave (2).
We have a three wave pattern higher already at the current highs.
And I am calling this wave ‘C’ of (2).
the hourly chart shows us that wave ‘A’ has reached the upper trend channel line today.
And is approaching the 50% retracement level of wave (1).
The previous wave ‘4’ triangle lies at the 62% retracement level at 76.50.
I suspect this is alignment of targets may be pulling the market now.
So I will be looking for wave (2) to top out in that area.
And then I can look lower again into wave (3) again.
Tomorrow;
watch for wave ‘C’ of ‘C’ of (2) to complete over the coming days near 76.50 at the previous fourth wave high and the 62% retracement level.
S&P 500.
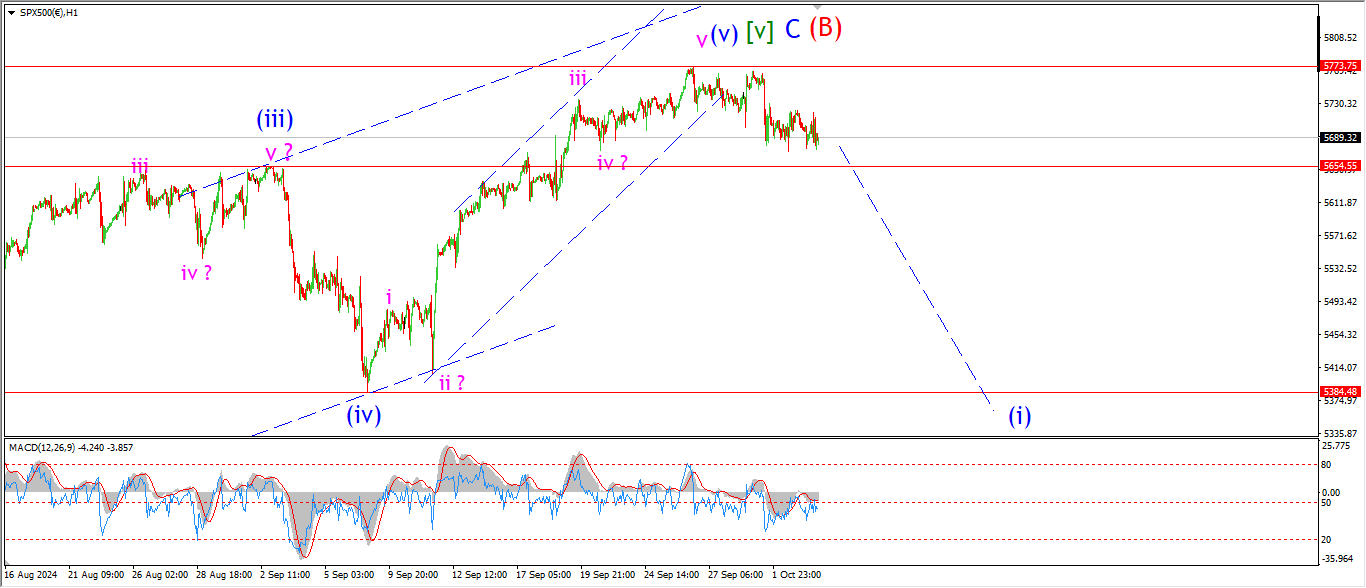
S&P 500 1hr
S&P 500 4hr
S&P 500 daily.
The S&P is dormant also today and I have very little to add to the picture here.
I am waiting for a decisive move to hint at the larger direction.
and without that,
there is little to say!
The market seems to waiting on the employment data tomorrow to make a decision in the short term at least.
We will see how the chips fall!
Tomorrow;
Watch for a sharp move lower to signal wave (i) is underway.
SILVER.
SILVER 1hr
SILVER 4hr.
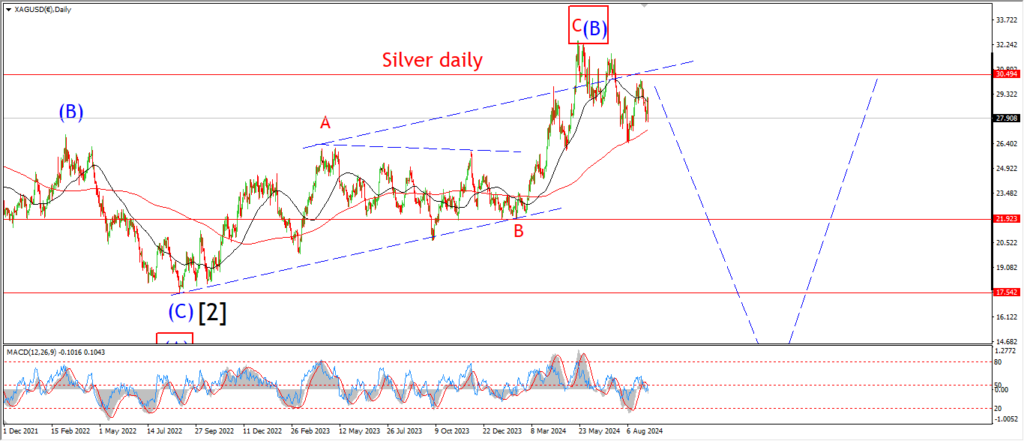
SILVER daily.
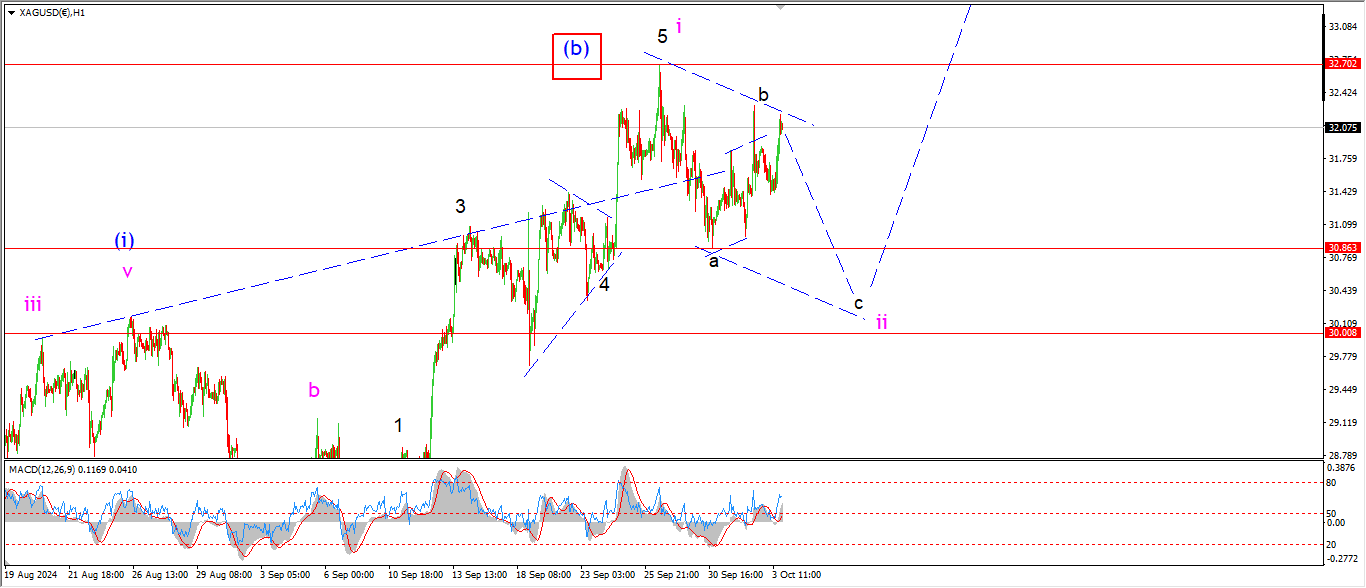
A rebound in price today is putting pressure on the count for wave ‘ii’ at the moment,
but as long as the price is holding the lower high here,
I am going to stick with this idea for wave ‘ii’.
Tomorrow;
the minimum target for wave ‘c’ lies at 30.86.
So lets see if wave ‘c’ can turn and drop into that level tomorrow.
BITCOIN
BITCOIN 1hr.
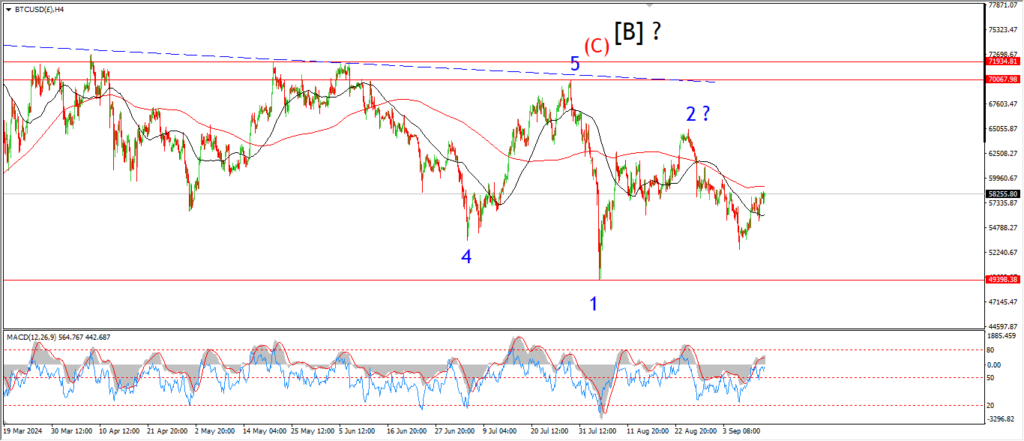
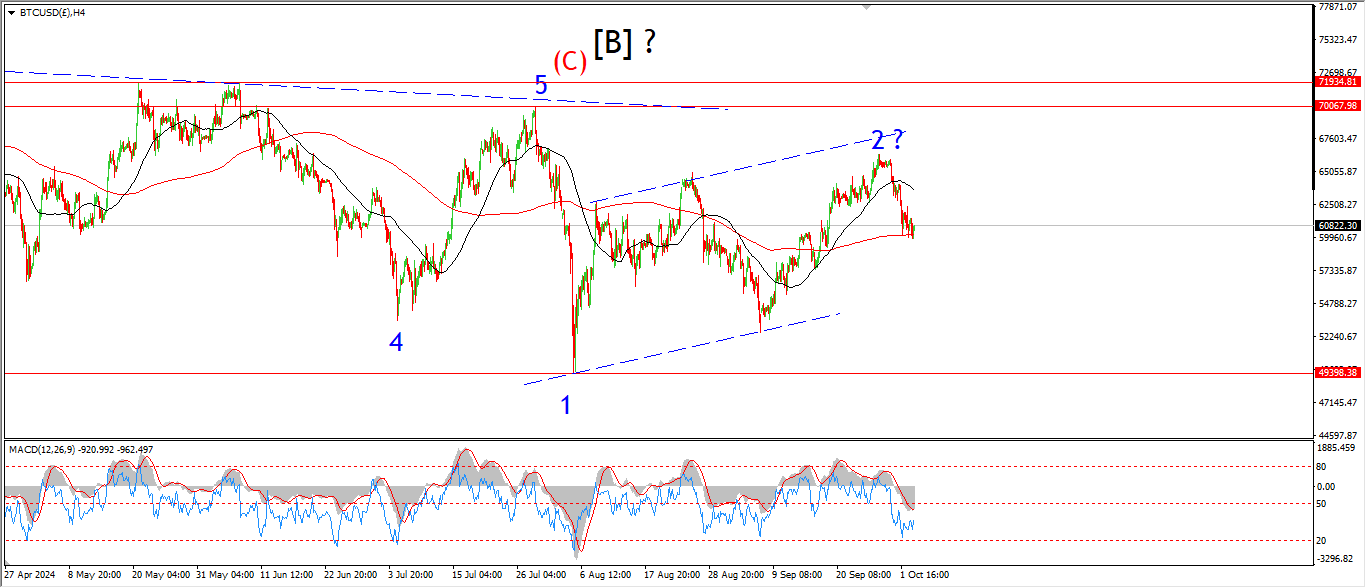
BITCOIN 4hr.
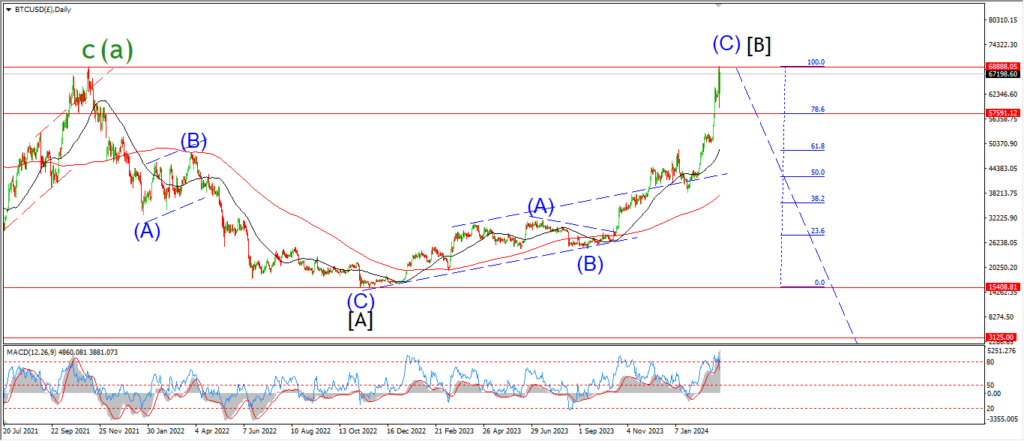
BITCOIN daily.
….
FTSE 100.
FTSE 100 1hr.
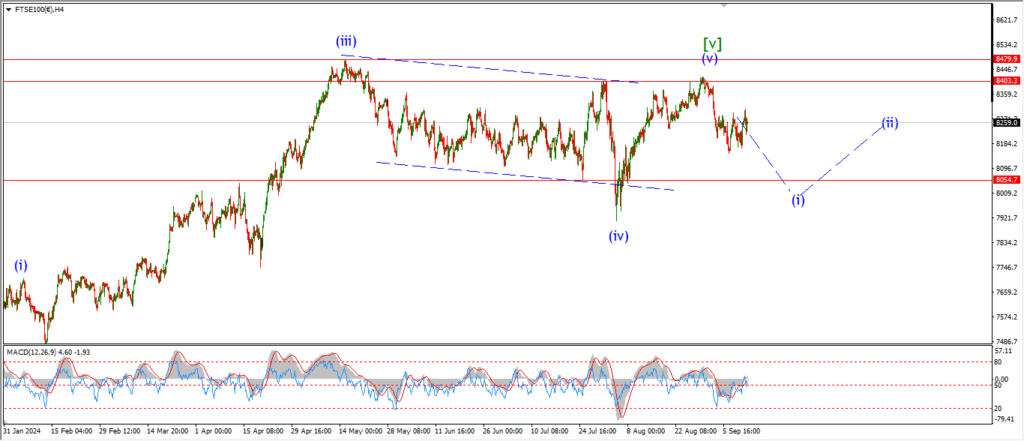
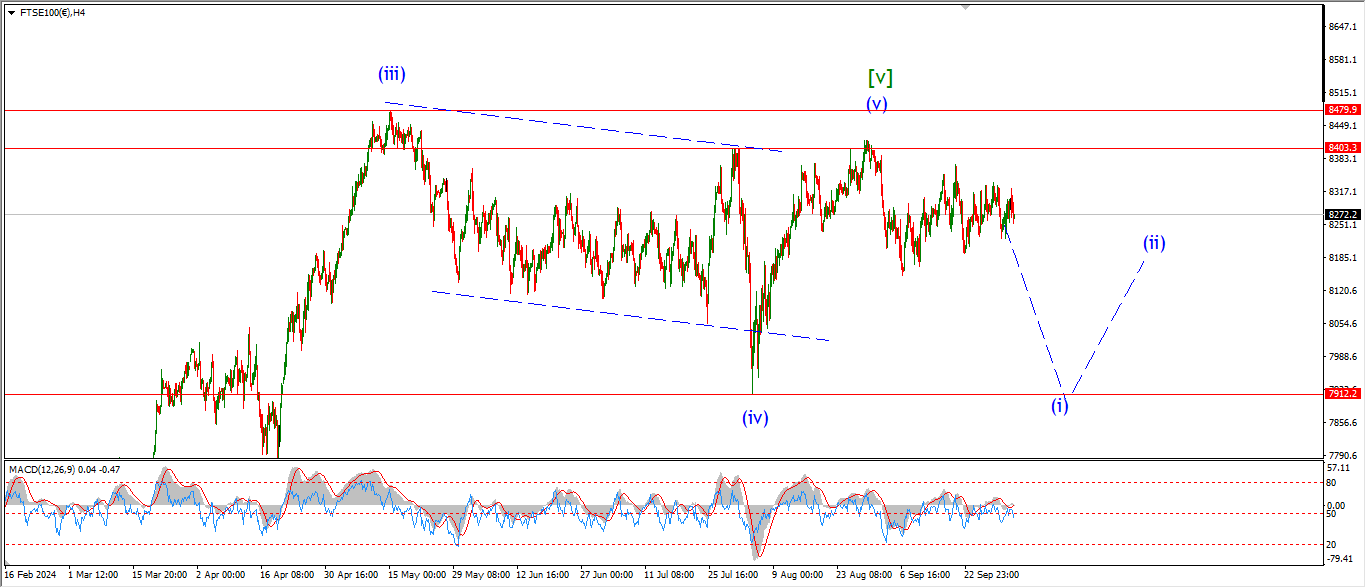
FTSE 100 4hr.

FTSE 100 daily.
….
DAX.
DAX 1hr
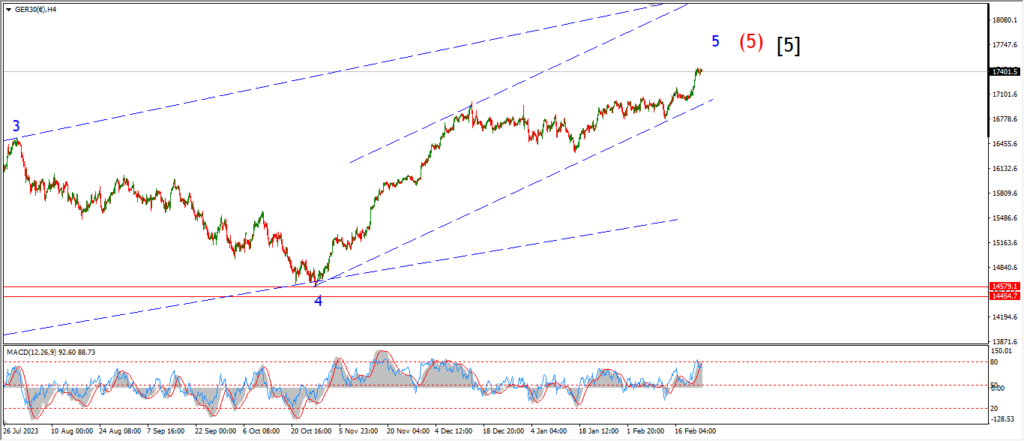
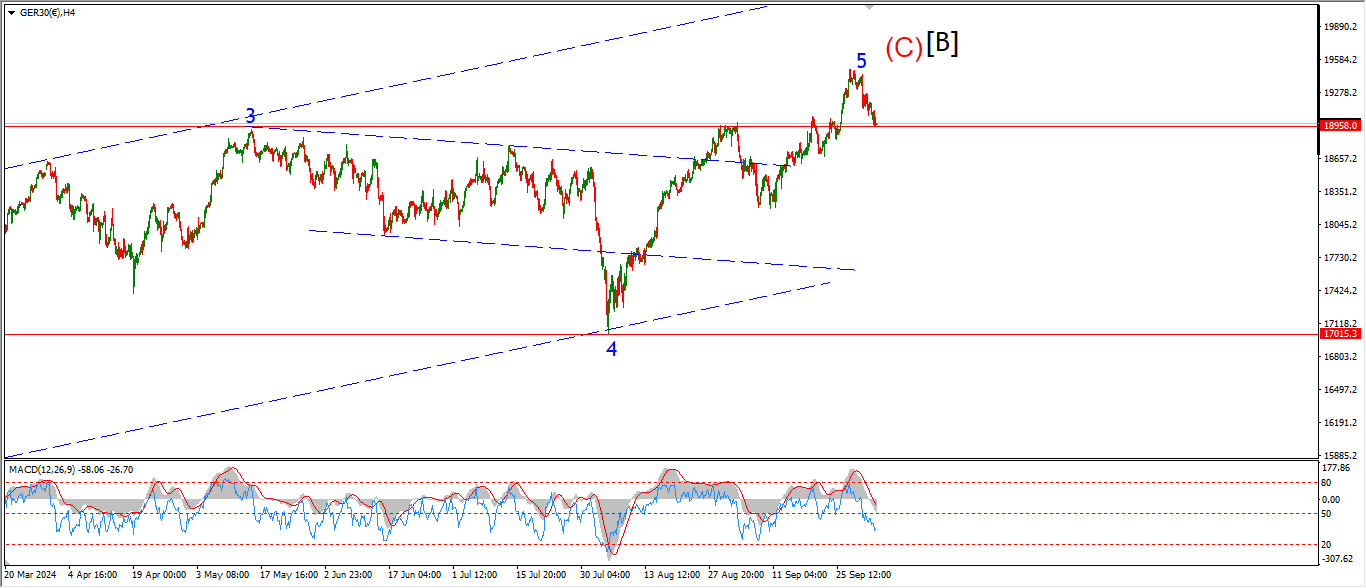
DAX 4hr

DAX daily.
….
NASDAQ 100.
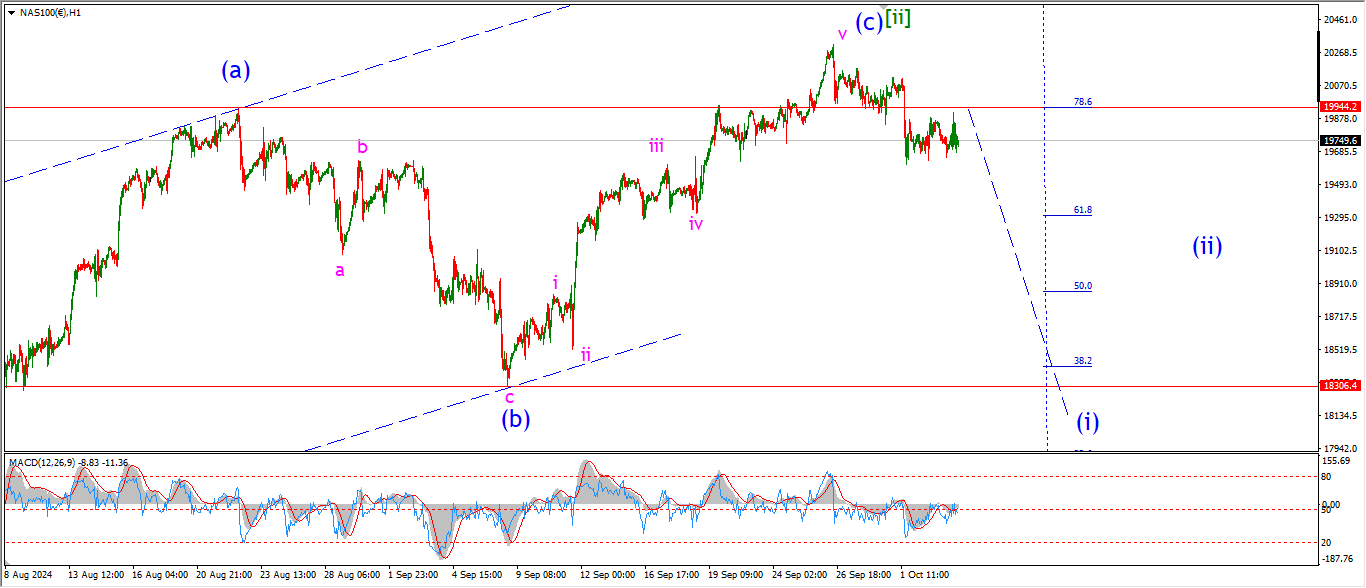
NASDAQ 1hr
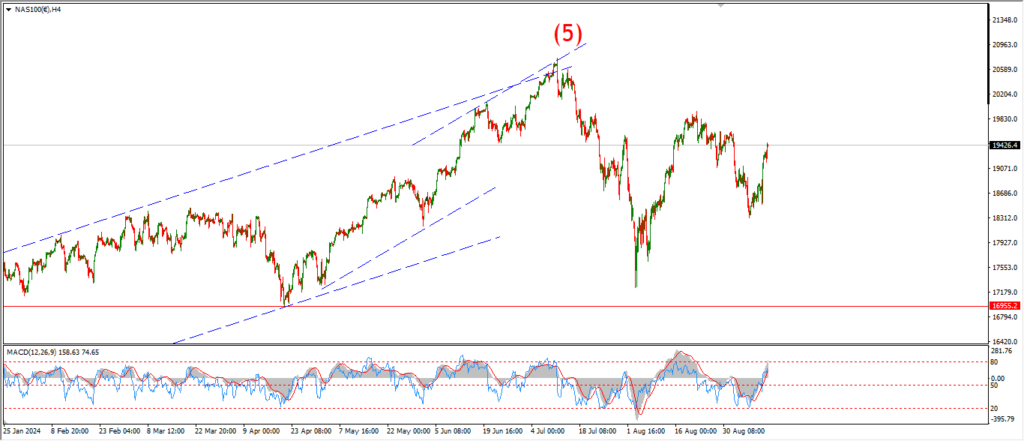
NASDAQ 4hr.
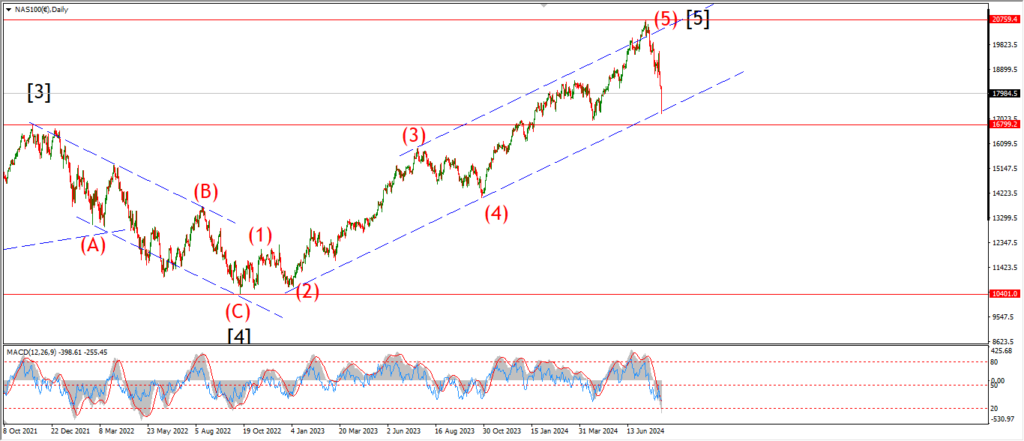
NASDAQ daily.
….