
Good evening folks, the Lord’s Blessings to you all.
With all the hysteria over the weekend in the news about economic collapse and WW3, I feel like I am now a purveyor of old news rather than reading the future patterns!
That has been my beat for the last while, and finally the world seems to have has cottoned on to the reality around us.
Funny thing is, my contrarian mind hates it when the world agrees with me! So I have a little cognitive dissonance plaguing me today!
Oh well, on with the show!
https://twitter.com/bullwavesreal
EURUSD.
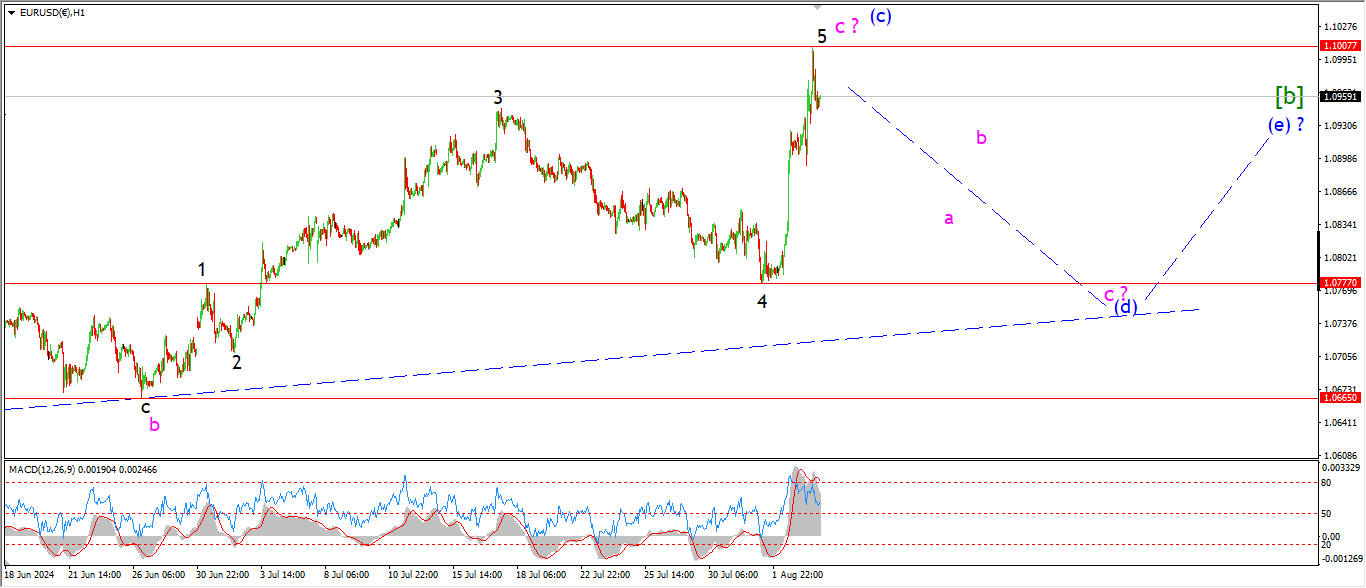
EURUSD 1hr.
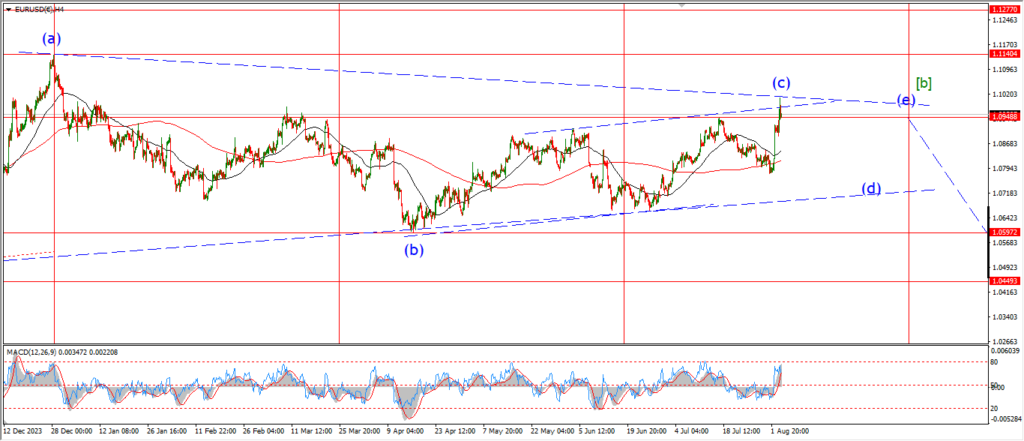
EURUSD 4hr.
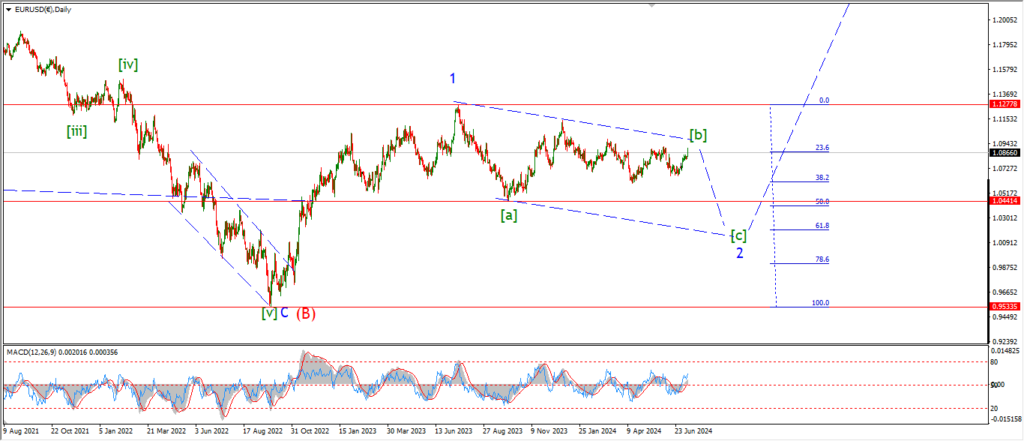
EURUSD daily.
I am a little surprised by the break out above the previous invalidation high today.
That rules out the main count that I showed on Friday.
and now I am on to the next itteration.
I have not changed the overall pattern here for wave [b] green.
That is a large contracting triangle in five waves.
The action today has not ruled out a triangle pattern for wave [b].
The action today high has forced the internal pattern of the triangle to change.
and the new high takes the wave (c) label,
and wave (d) is still expected to turn lower in three waves in the coming week.
Tomorrow;
Watch for wave (c) to hold at the current high at 1.1007.
Wave (d) must now turn lower in three waves as shown.
The initial target for wave (d) lies at the previous lows at 1.0777.
GBPUSD
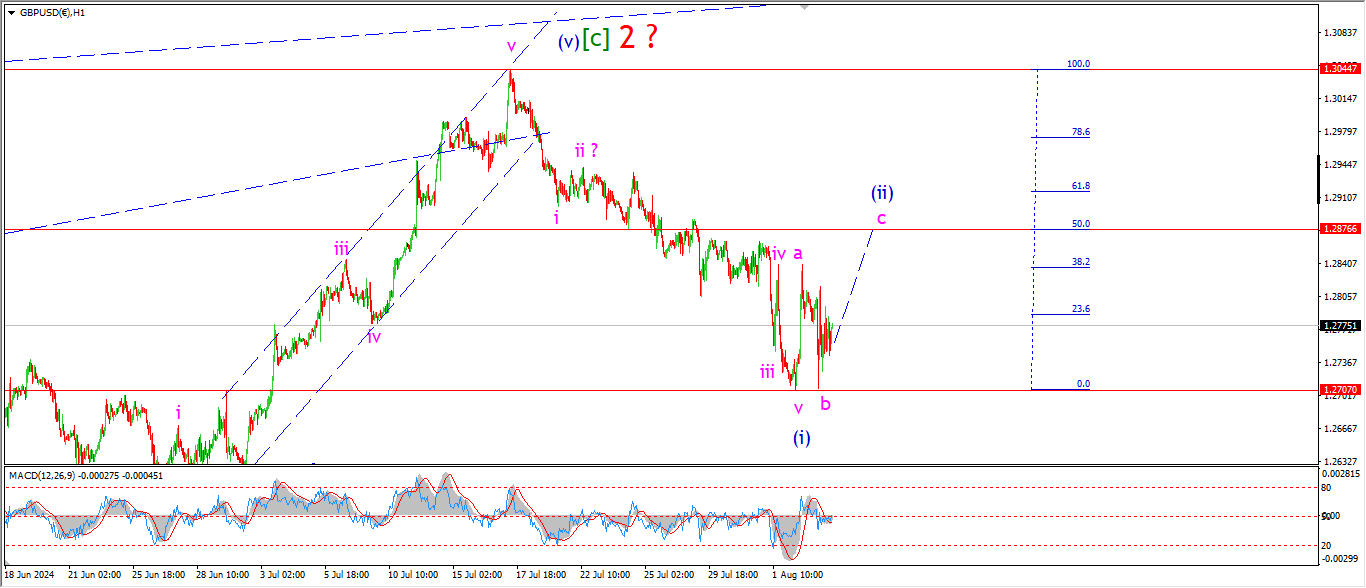
GBPUSD 1hr.
GBPUSD 4hr.
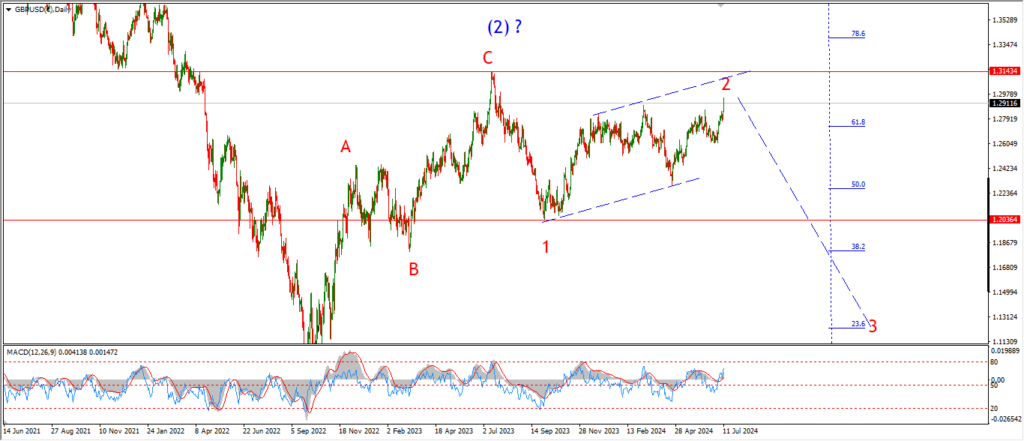
GBPUSD daily.
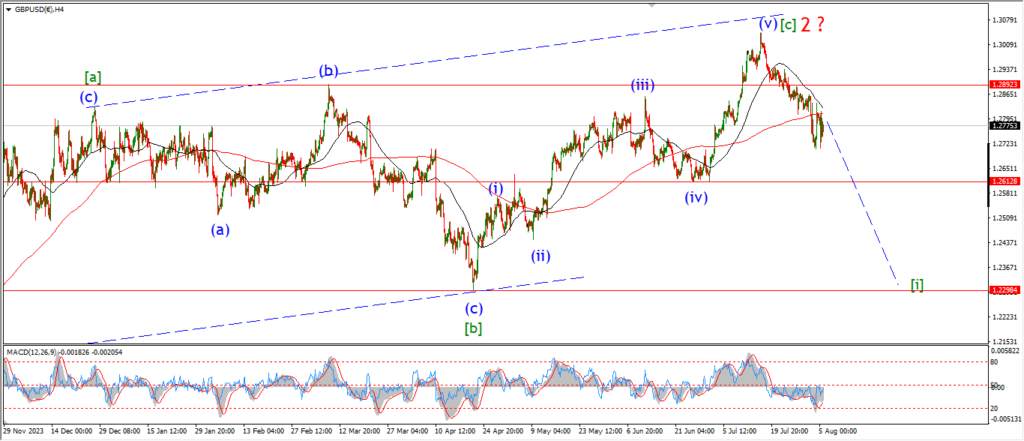
I am tracking the wave (ii) correction higher again today.
And it seems that wave ‘b’ of (ii) is now in place at the double bottom.
A rebound off that low should be the start of wave ‘c’ of (ii).
And I am looking at the 50% retracement level at 1.2876 as the initial target level.
Tomorrow;
Watch for wave ‘c’ of (ii) to complete three waves up at 1.2876.
Once we hit that area I will turn my attention lower into wave (iii) again.
USDJPY.
USDJPY 1hr.
USDJPY 4hr.
USDJPY daily.
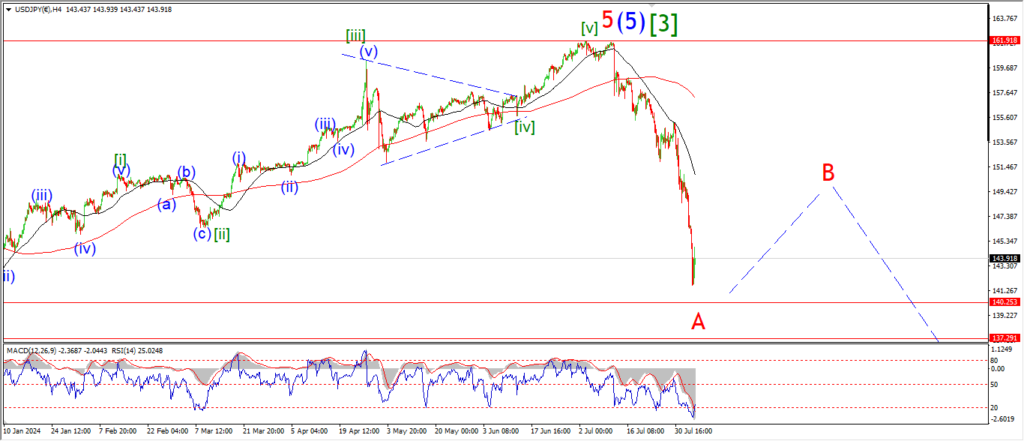
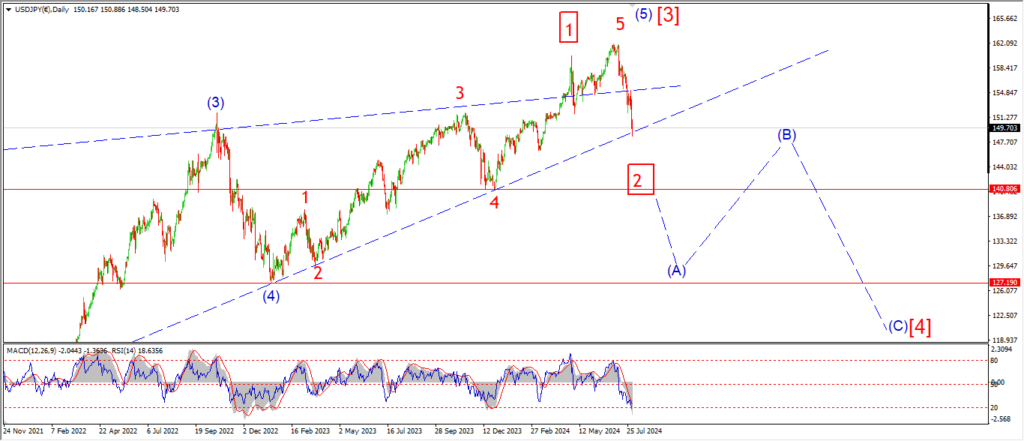
If you take a look at the daily chart and you will see where I stand on the overall wave count.
the recent top marks wave [3] and now we are starting on a correction in wave [4].
Wave (A) of [4] should trace out three waves down at least.
And the price action is moving fast into this pattern now.
The 4hr chart shows the idea for a three wave pattern in wave (A).
And we may even be close to the initial low in wave ‘A’ red as I write.
the drop over the last few days has been the fastest decline in USDJPY in the last few years.
even so,
Steep decline in this pair have a tendency to be retraced pretty quickly.
So I expect wave ‘B’ of (A) to come in soon.
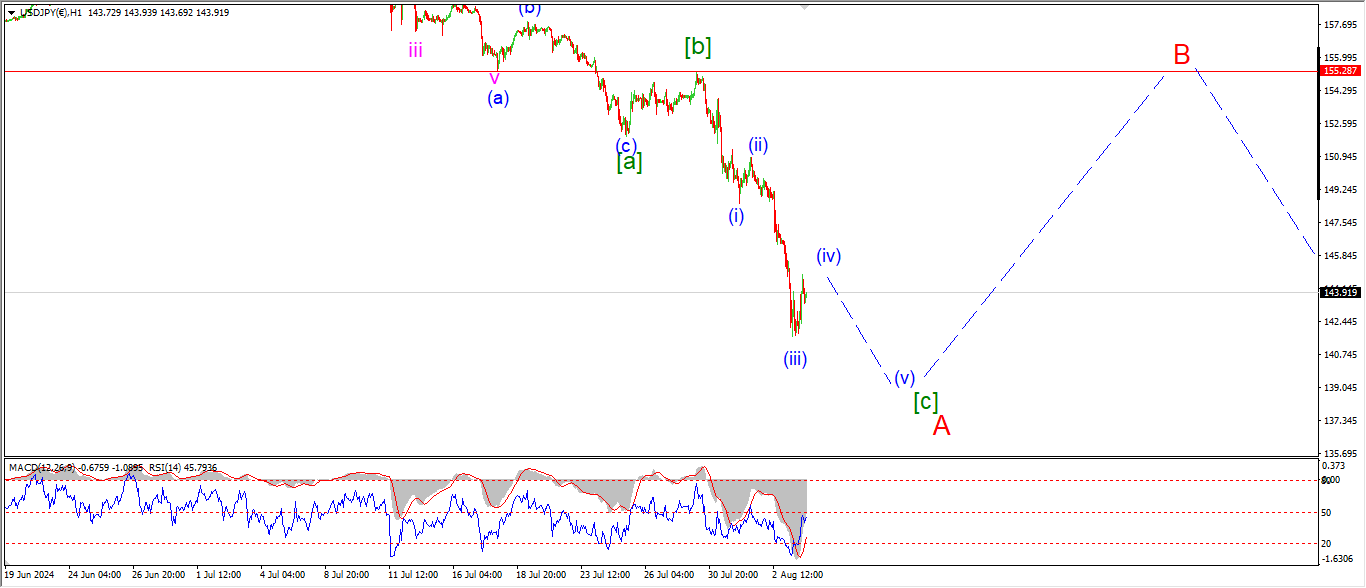
The hourly chart shows a three wave decline in play here in wave ‘A’ red.
Wave [c] of ‘A’ will complete five wavs down in the next few sessions.
And I do expect we will see a rally begin in wave ‘B’ before the end of this week.
Tomorrow;
Watch for wave (iv) of [c] to close out and the price should turn lower into wave (v) of [c].
DOW JONES.
DOW 1hr.
DOW 4hr
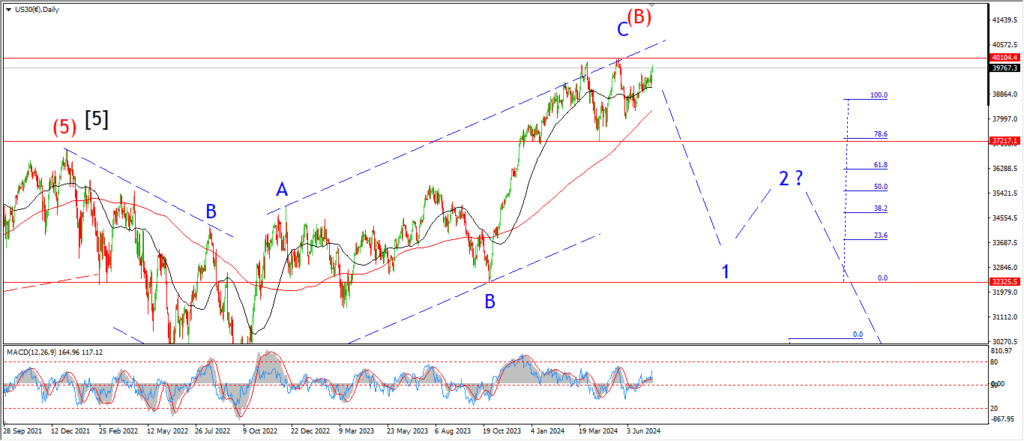
DOW daily.
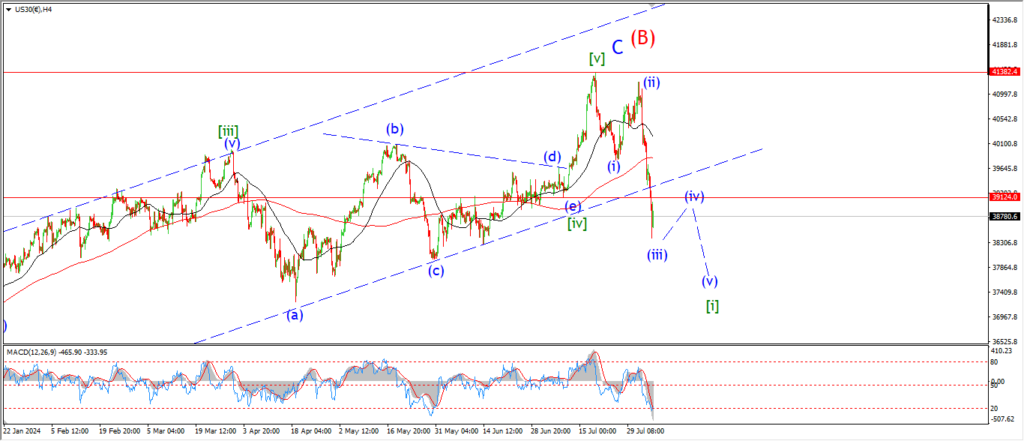
I have changed up the wave count on the 4hr chart this evening to test an idea for the previous wave [iv] green.
You can see I have shown a larger internal count for the triangle.
And wave (e) of [iv] completed at 39124 in mid July.
this count contains all of the choppy and corrective sideways action inside the triangle.
And the rally out of that wave [iv] low is purely impulsive in nature.
This clears up my messy count for wave [v] involving a failed fifth wave.
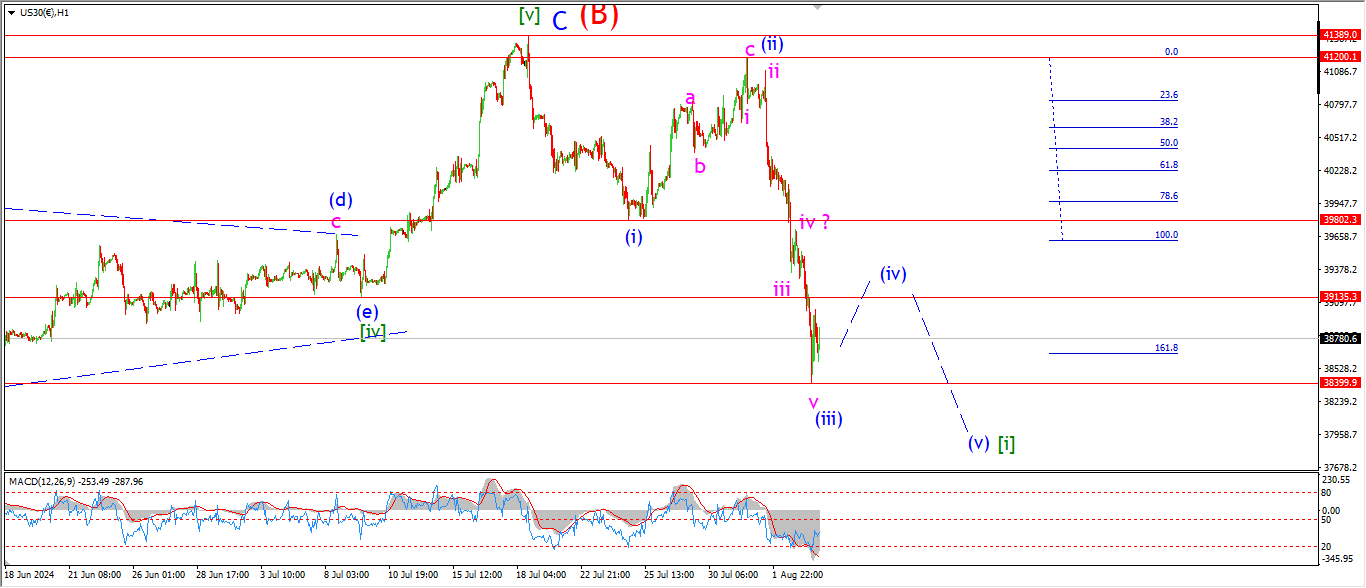
And now we have a clean (i) (ii) pattern off the high.
The recent acceleration lower was long overdue and is labelled as wave (iii) of [i] which fits the nature of the action.
Todays further drop has now broken the previous triangle lows of wave [iv].
and now we have a possible clean five wave decline in play here off the top at wave (B) red.
The hourly count labels todays lows as wave (iii) of [i].
Wave (iv) can correct higher from here as shown.
And wave (v) down will then make a new low this week if this pattern is correct.
Tomorrow;
Watch for a correction in wave (iv) to play out as shown.
This correction must complete below the wave (i) lows at 39800.
GOLD
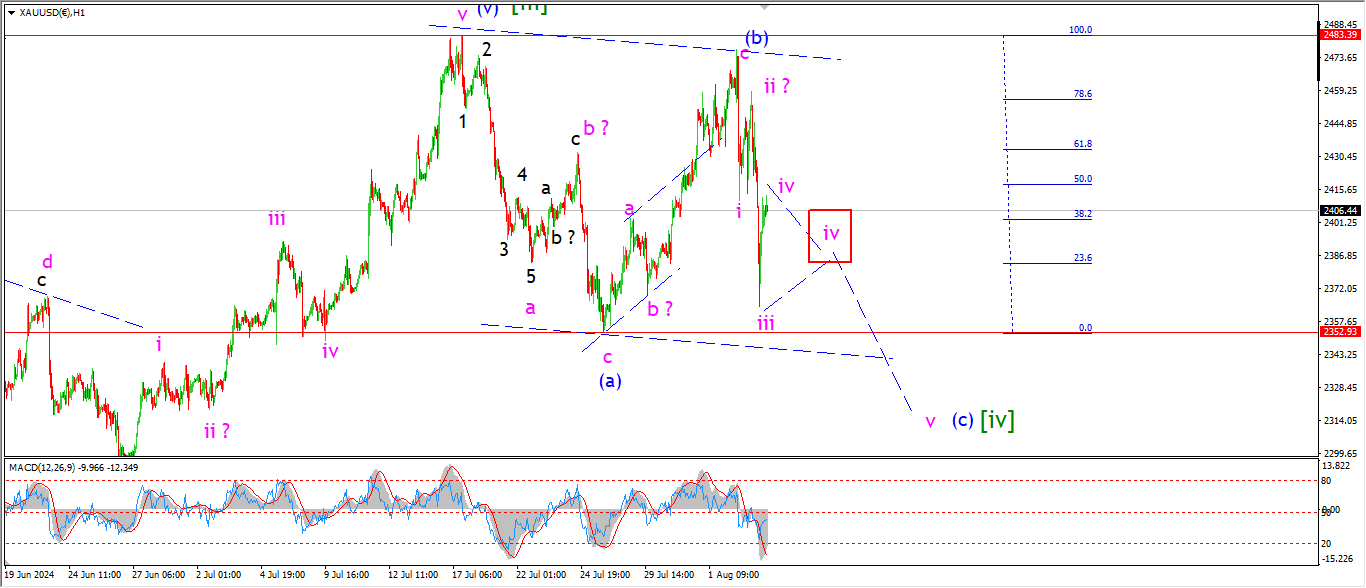
GOLD 1hr.
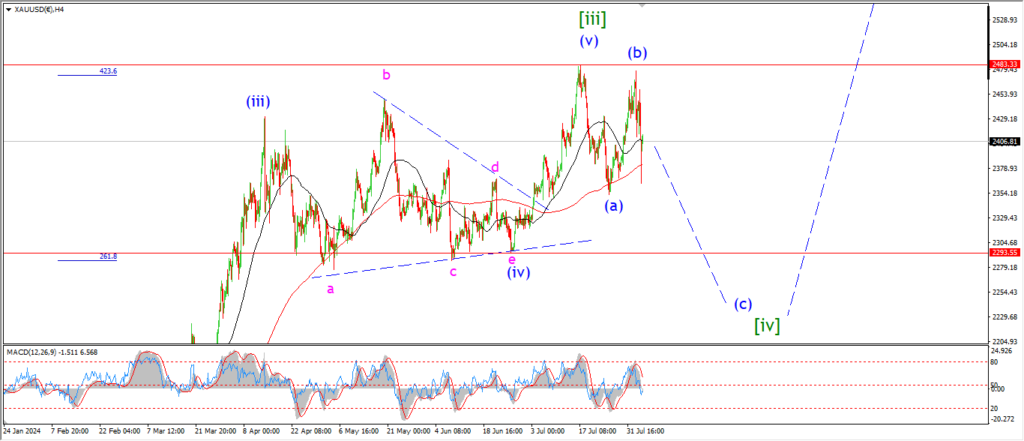
GOLD 4hr.
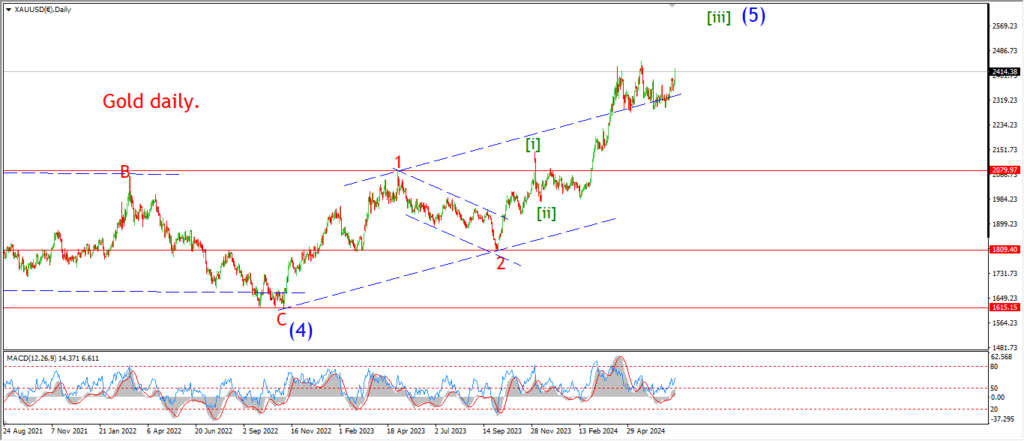
GOLD daily.
I am a little bit suspect of the action in wave (c) today as we have possible overlap between wave ‘i’ and wave ‘iv’.
this complicates the pattern in wave (c).
and if this does not clear up tomorrow then I will have to rethink wave [iv] overall.
There is still a possibility that wave ‘iv’ is developing into a more complex pattern.
A triangle in wave ‘iv’ would rule out the confusion here and clear up the pattern in wave (c).
So I am willing to give this idea a few days to see how it pans out.
Tomorrow;
Lets see if wave ‘iv’ of (c) can drop off this high and develop sideways into a triangle.
At the moment we have three waves down in place in wave (c).
And I expect wave (c) to develop into a five wave pattern.
CRUDE OIL.
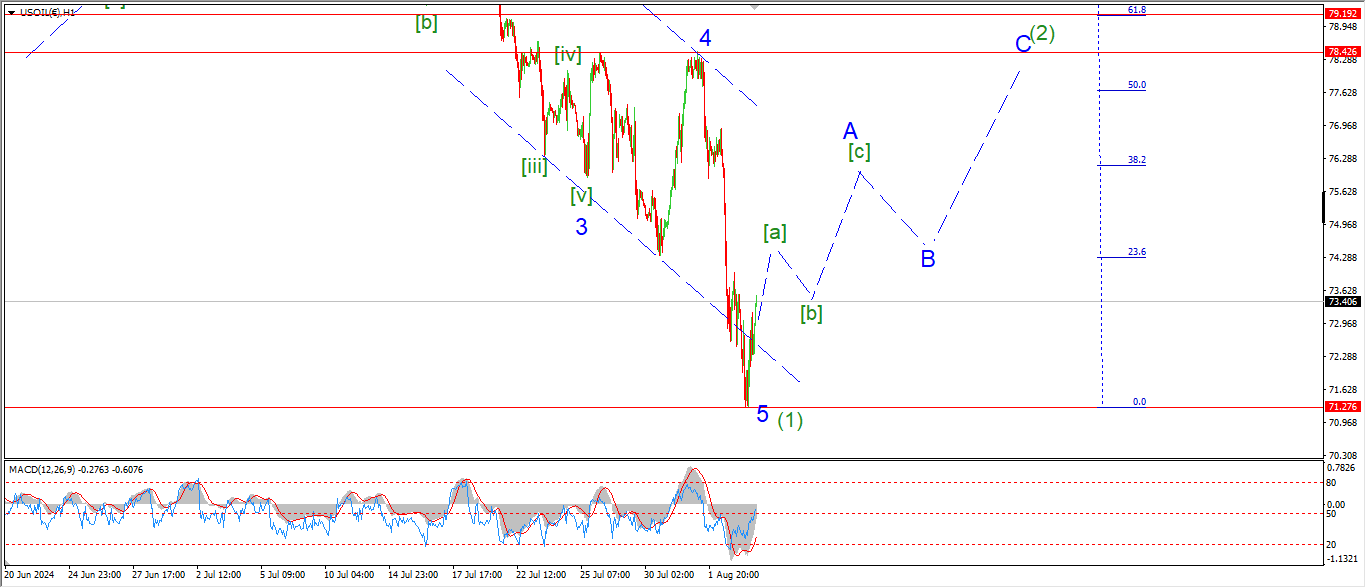
CRUDE OIL 1hr.
CRUDE OIL 4hr.
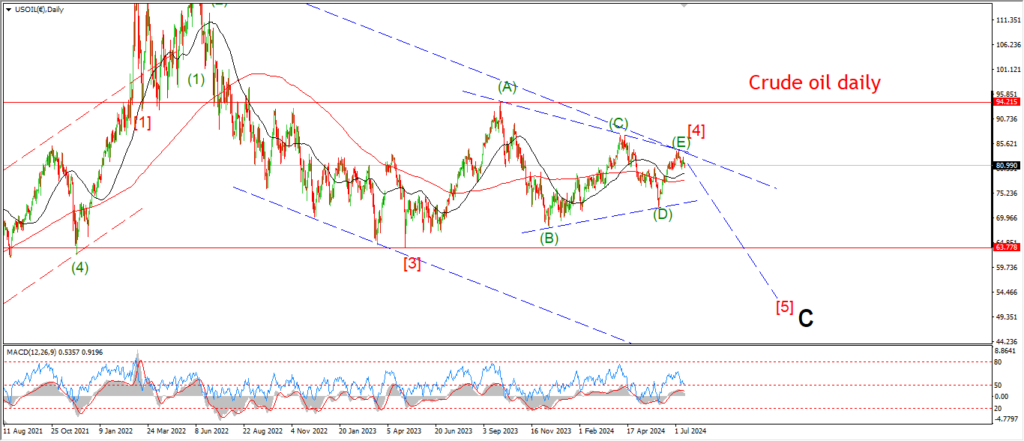
CRUDE OIL daily.
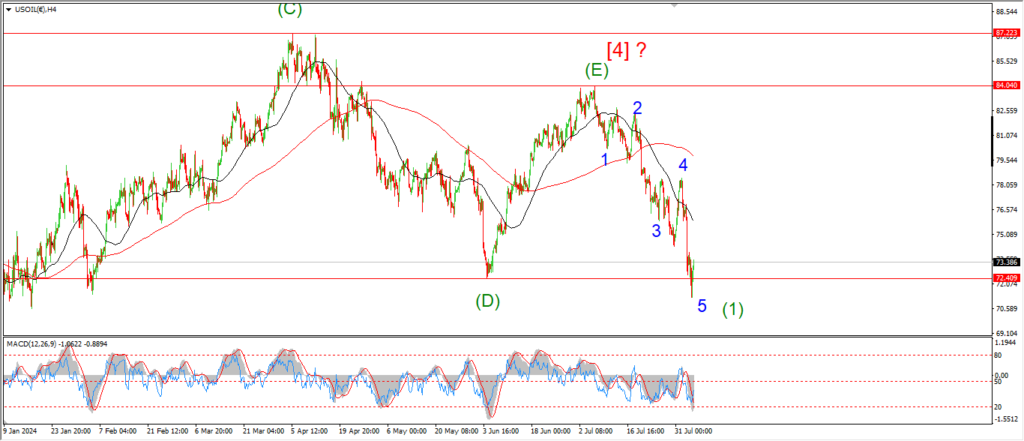
The 4hr chart now shows a clean five wave decline into wave (1) at todays lows.
The relentless decline over the last few sessions has ruled out the previous count for wave (2).
And now I am working on a reversal higher into wave (2) off todays lows.
The hourly chart shows the rebound off the session lows as wave [a] of ‘A’ of (2).
Wave (2) is expected to trace out three waves up into the wave ‘4’ high at 78.42.
Tomorrow;
Watch for the lows at wave (1) to hold,
wave ‘A’ should trace out three waves up as shown over the coming days.
S&P 500.
S&P 500 1hr
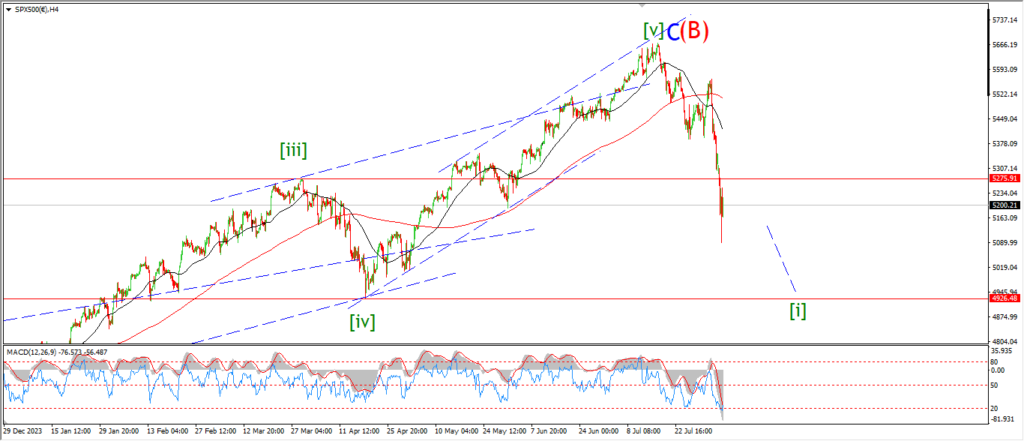
S&P 500 4hr
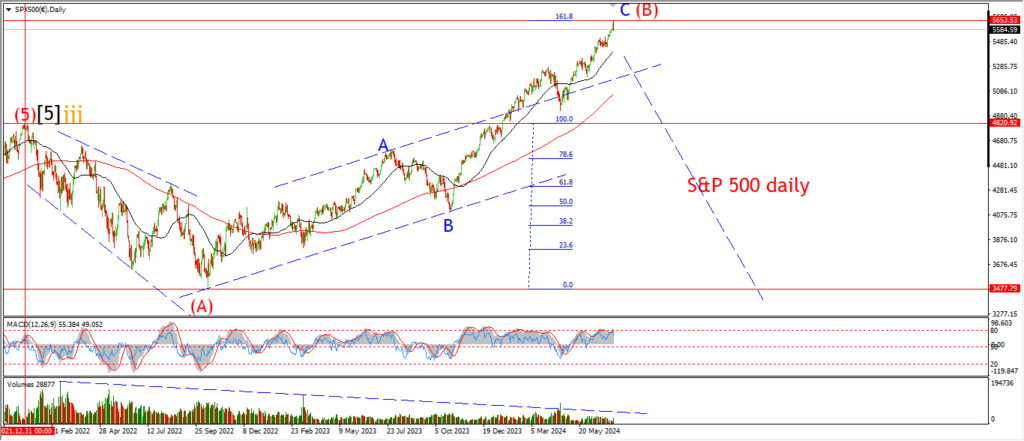
S&P 500 daily.
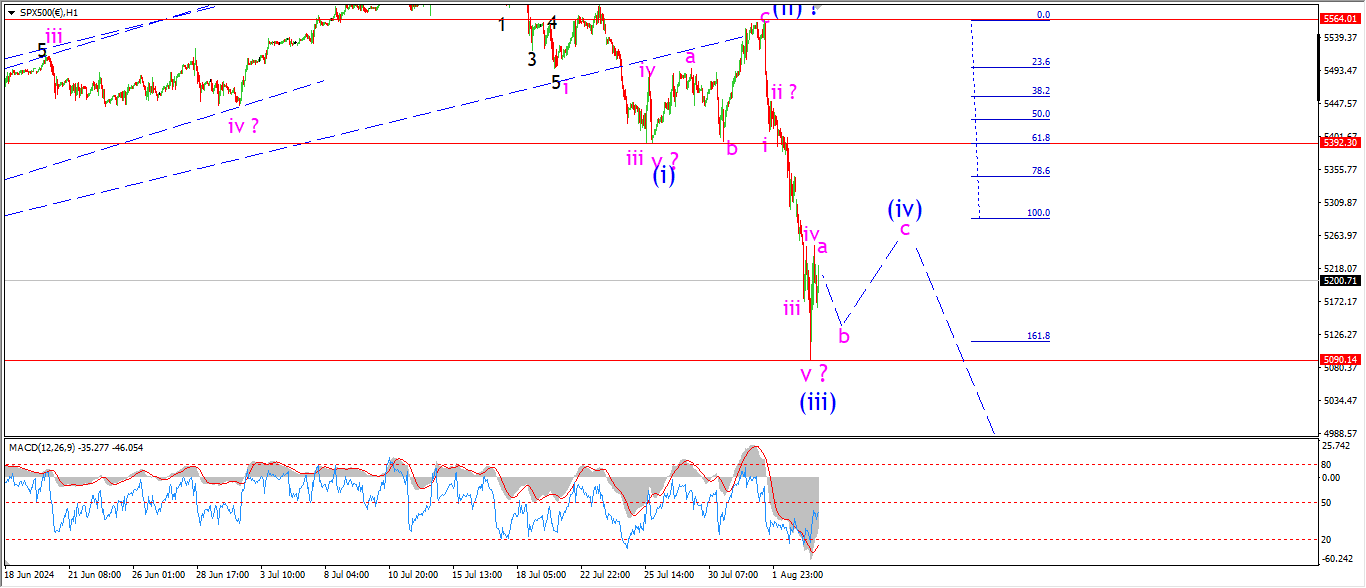
The low today may have completed wave (iii) but that is up for debate as usual!
We have a rebound off that possible wave (iii) low and that suggests wave (i) is already underway.
the pattern in wave [i] green is developing quite quickly here,
so wave (iv) may not take that long if we follow that trend.
I am looking for a simple three wave pattern higher in wave (iv) to hit the 5300 level,
and then wave (v) should fall back again by the end of this week.
That will complete wave [i] down,
and the initial target for wave [i] lies at the wave [iv] low at 4920.
Tomorrow;
Watch for wave (iv) to trace out a corrective pattern sideways over the coming day or two to complete below the 5300 level again.
SILVER.
SILVER 1hr
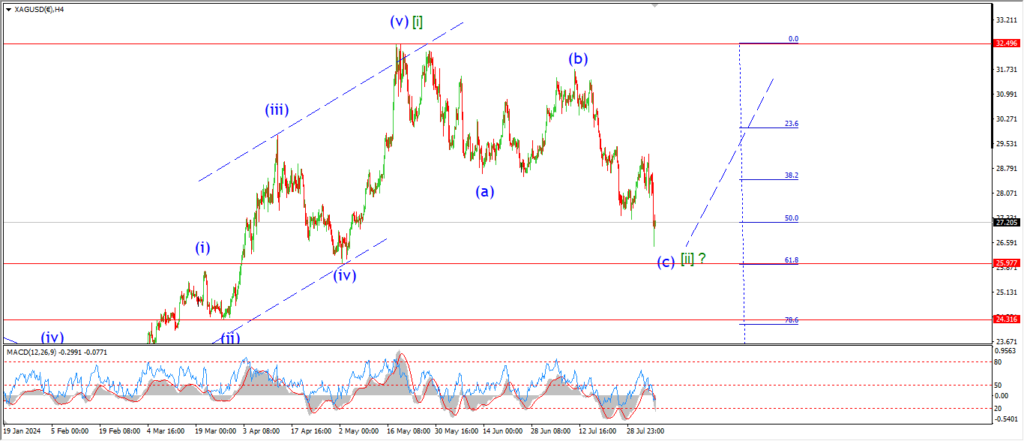
SILVER 4hr.
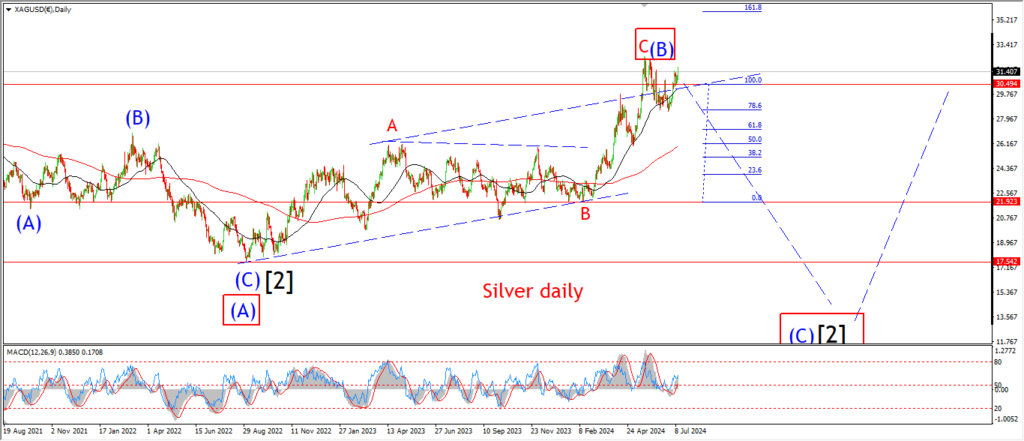
SILVER daily.
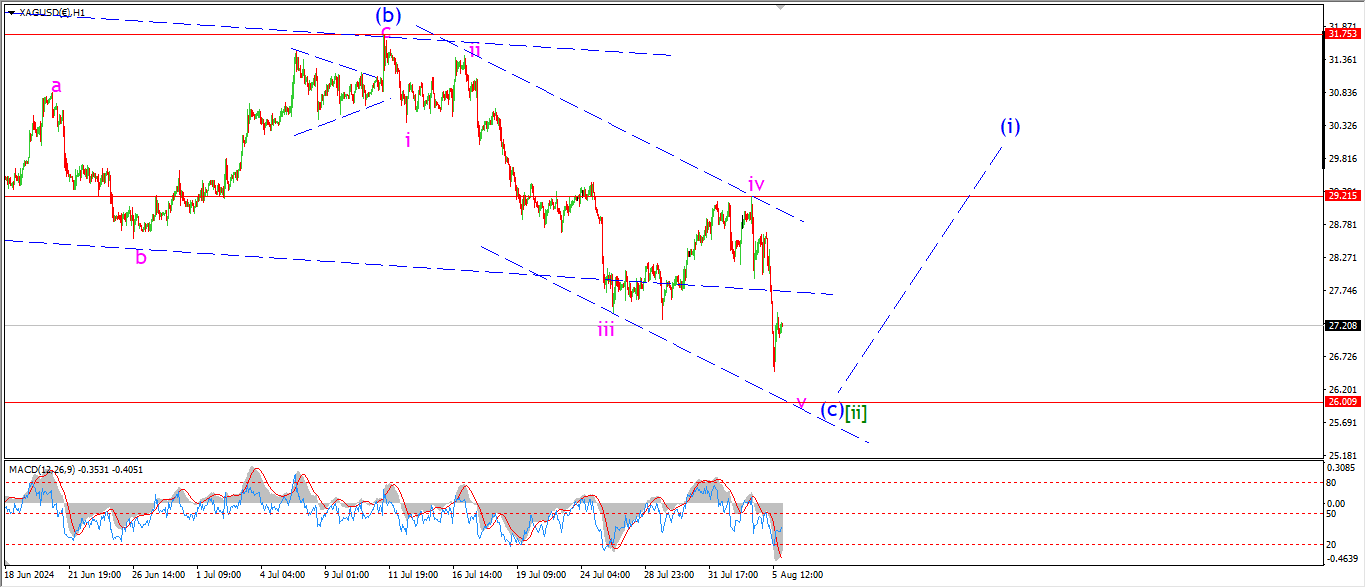
Well todays drop off has prolonged the correction in wave [ii] a little more.
This new low is happening in wave ‘v’ of (c) of [ii] again.
The previous wave [iv] low lies at 26.00,
and that level forms the next level of support for this correction.
I am looking for five waves down in wave (c) of [ii] to complete in that area before turning higher into wave (i) again.
Tomorrow;
Watch for wave ‘v’ of (c) to hit that support at 26.00 and then head higher into wave (i) blue.
BITCOIN
BITCOIN 1hr.
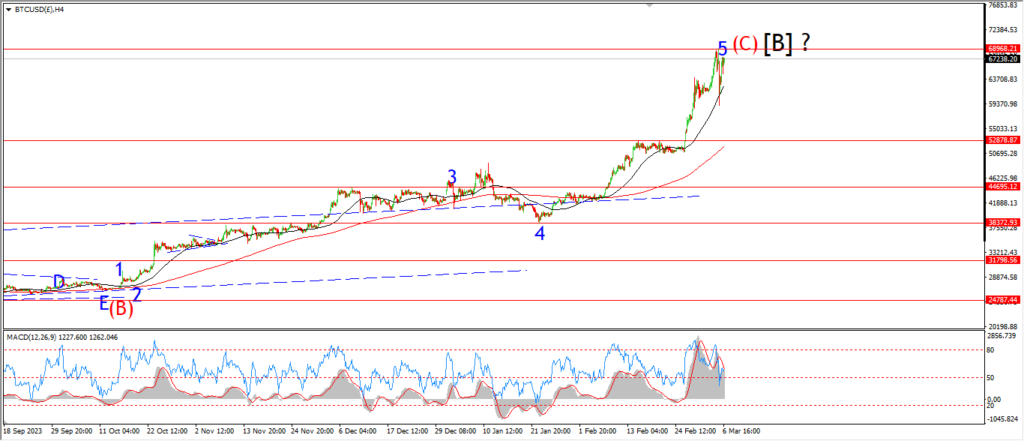
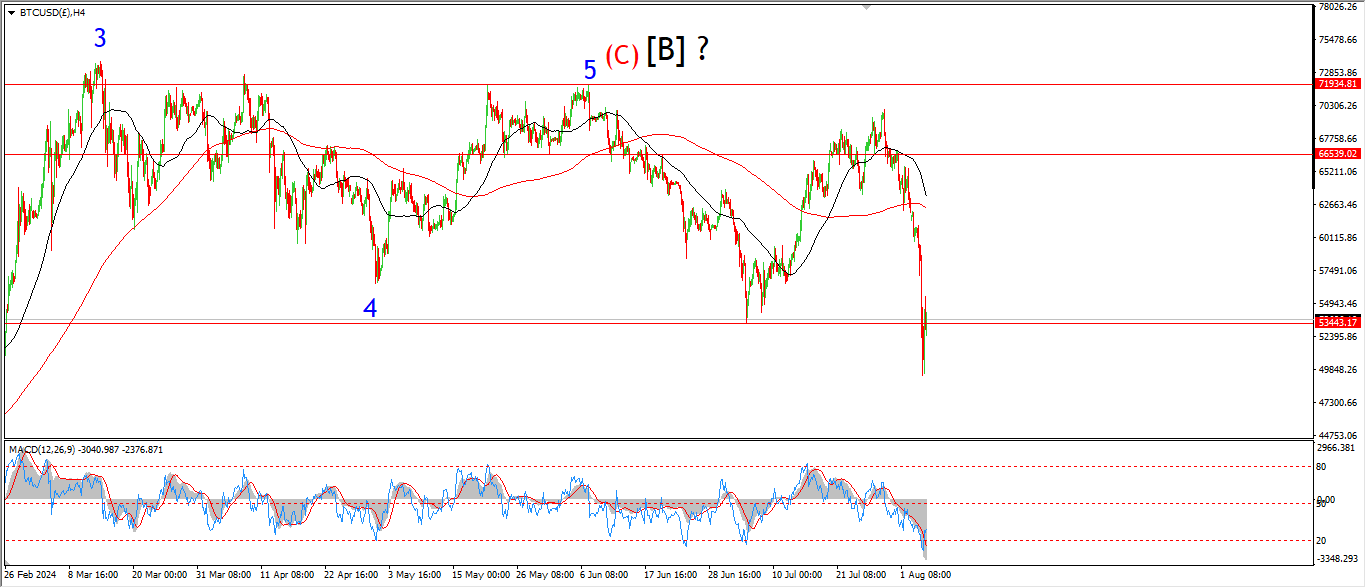
BITCOIN 4hr.
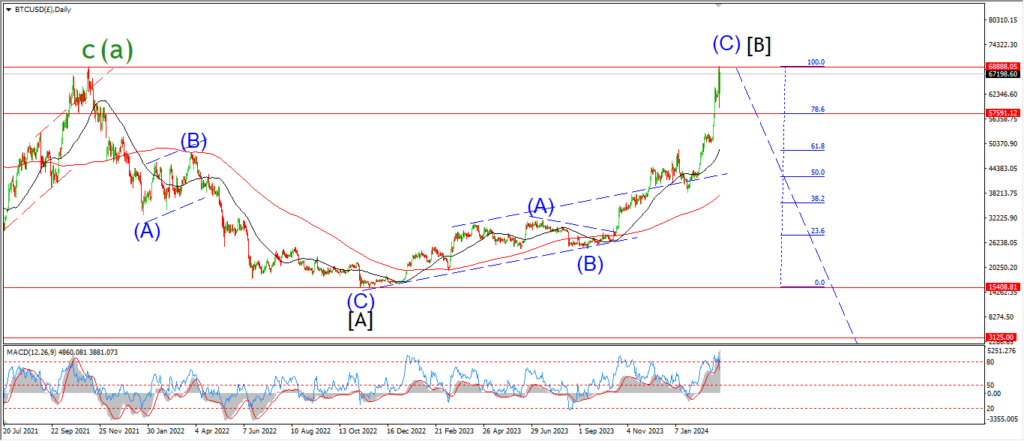
BITCOIN daily.
….
FTSE 100.
FTSE 100 1hr.

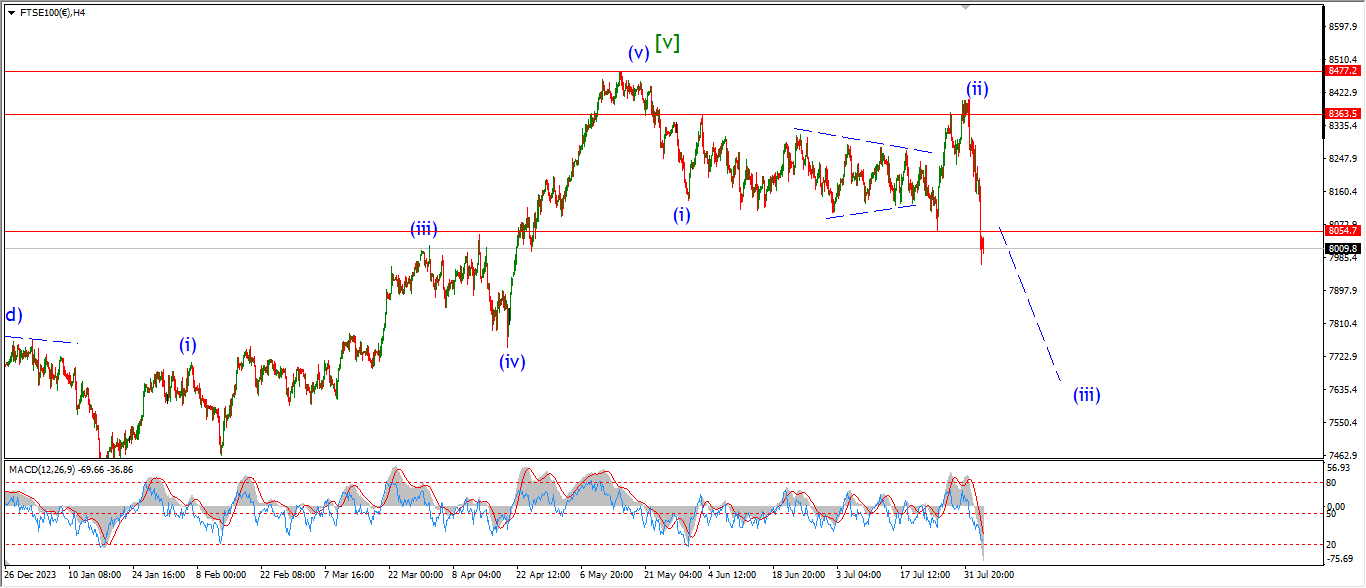
FTSE 100 4hr.

FTSE 100 daily.
….
DAX.
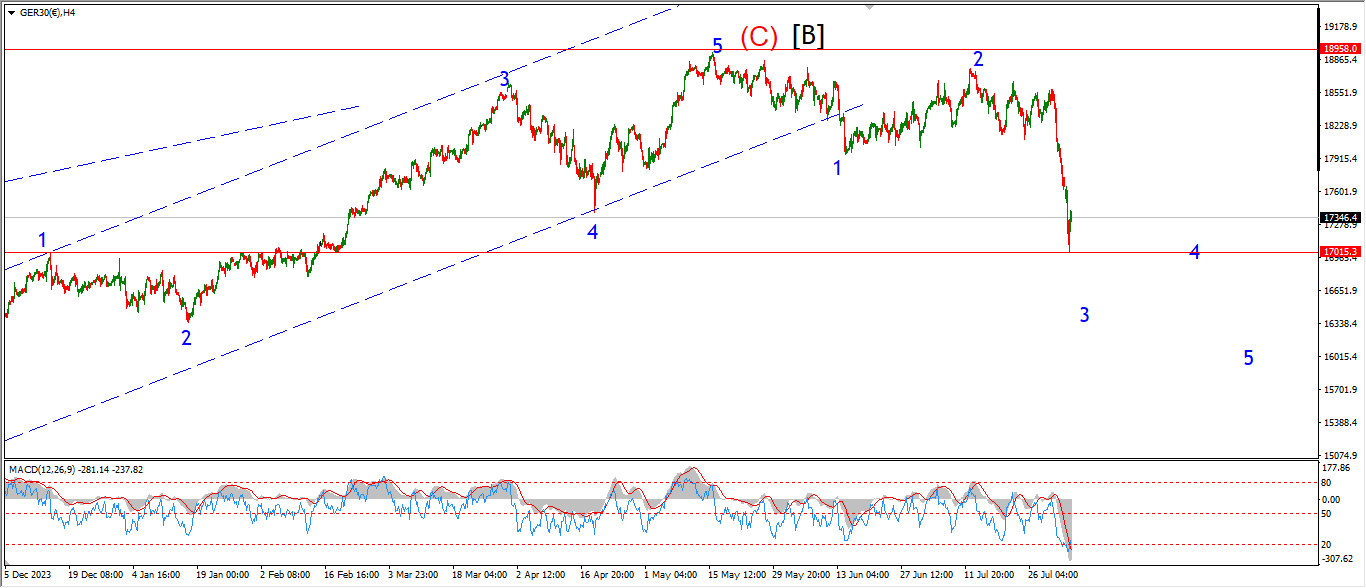
DAX 1hr
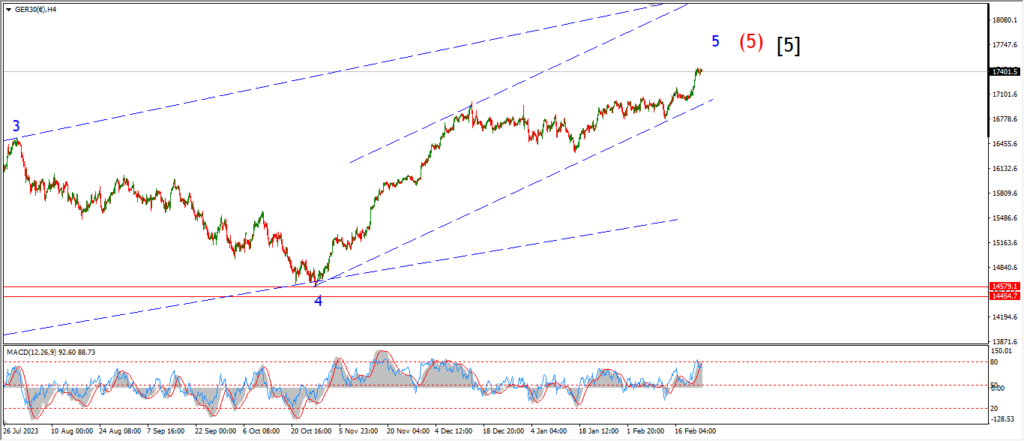
DAX 4hr

DAX daily.
….
NASDAQ 100.
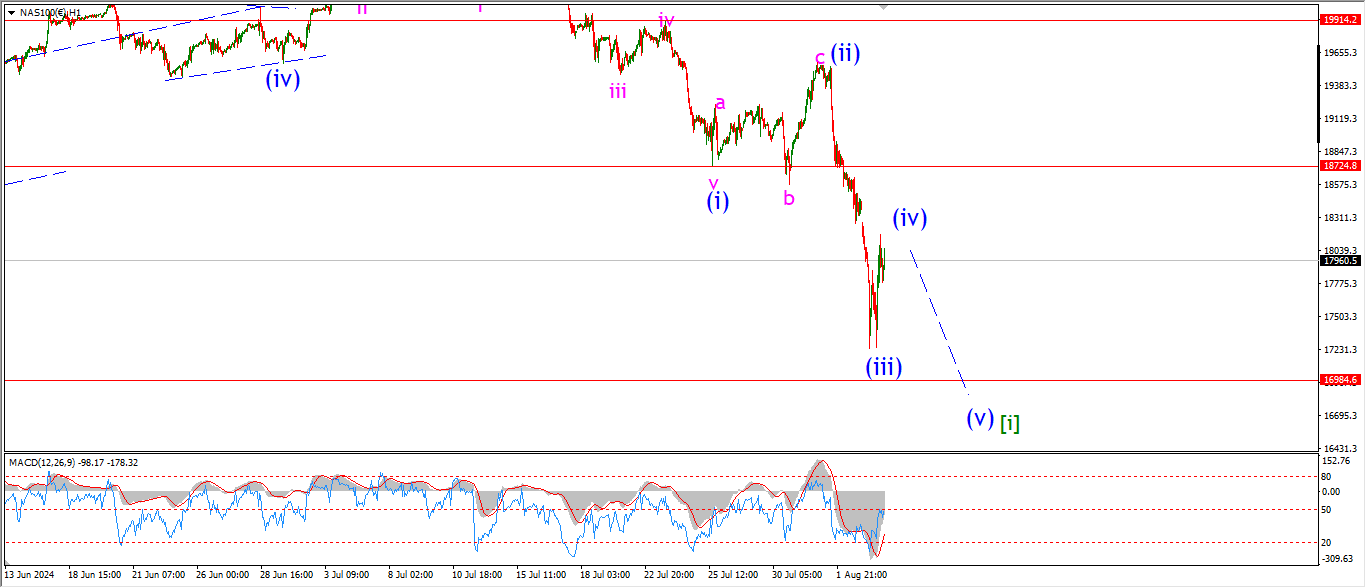
NASDAQ 1hr
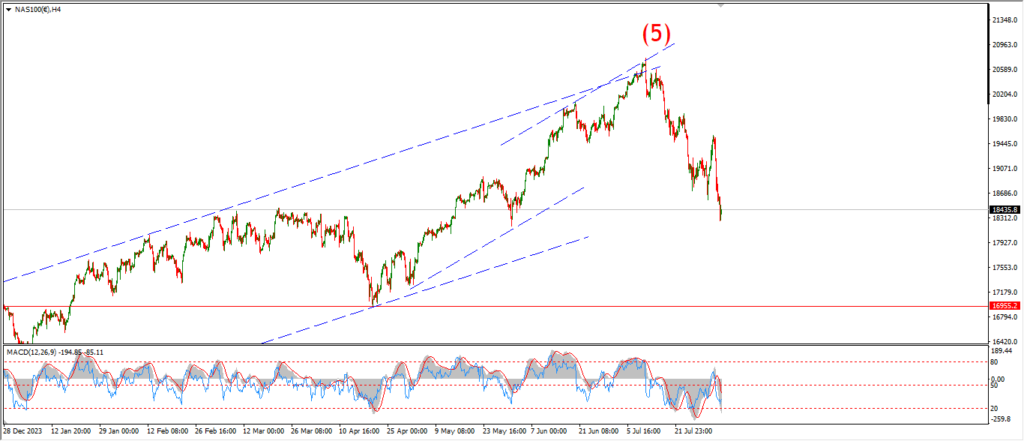
NASDAQ 4hr.
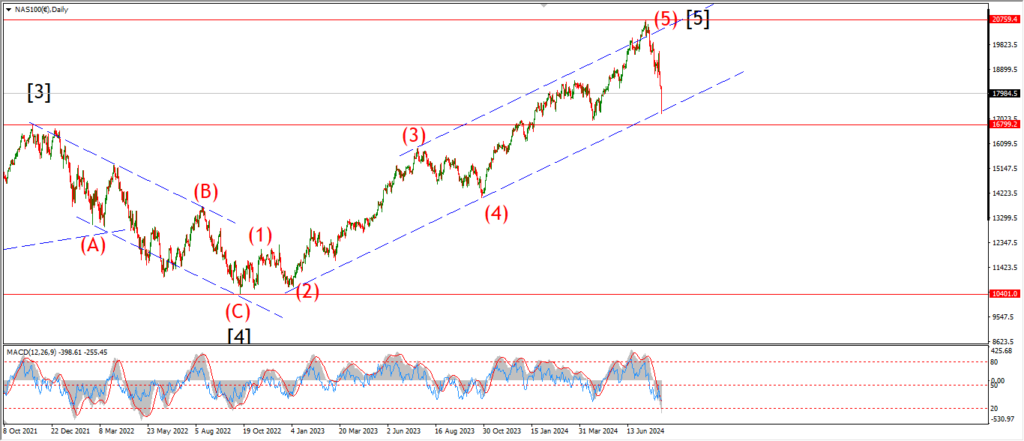
NASDAQ daily.
….