
Good evening folks, the Lord’s Blessings to you all.
I am going to go wide angle tonight on most markets as I think its time to take a look where we stand in the wider patterns in a few of these markets.
Todays action has pushed the limits in a few places,
but I think you will see why I am proposing the main patterns after tonight.
the short term action is a little shaky,
and I will deal with that if a pattern breaks.
But for the moment,
the main thesis holds for most of these markets I am following.
By the way,
The CPI printed negative 0.4% monthly,
this means prices are deflating again for the first time since the pandemic.
so it took 4 yrs to flush out the fake economic cycle created by pumping 30% of gdp through debt and deficits.
Finally we are back to reality again.
And this time we have a mountain of extra debt service as a noose around our necks.
I wonder how this plays out……..
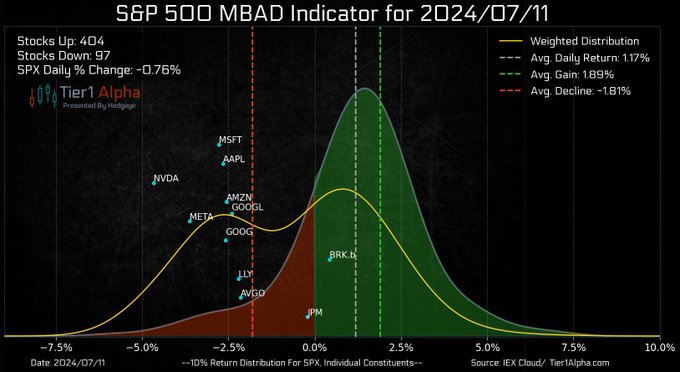
This is wild. 80% of the $SPX is in the GREEN today, while the cash index is down -75bps. Market cap distortion is in full effect.
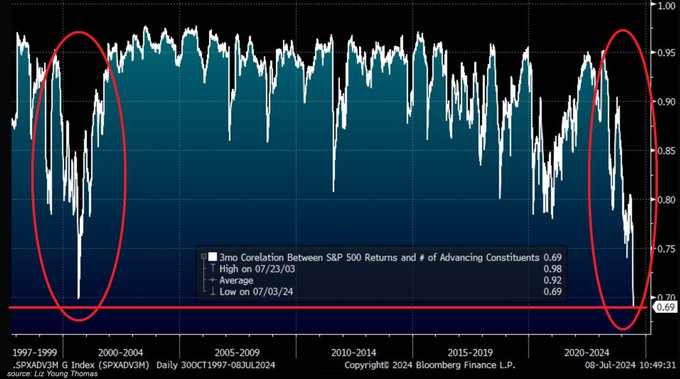
THIS HAS NEVER BEEN SEEN BEFORE: 3-month correlation between S&P 500 returns and the number of S&P 500 stocks advancing dropped to the LOWEST on record. It means that the number of stocks driving gains is the smallest EVER. Notably, 40% of S&P 500 stocks are down year-to-date.
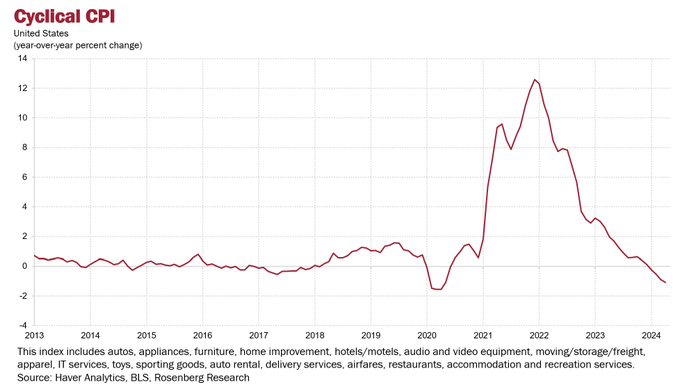
The cyclically-sensitive CPI deflated -0.4% MoM and has declined now for four months in a row. The YoY trend in the prices most sensitive to shifts in the economy is now running at –1.1% from -0.9% in May and +2% a year ago. How can Powell not be “confident” by now?? The Fed should get its head out of the sand and either cut rates on July 31st or strongly signal a move is coming on September 18th.
https://twitter.com/bullwavesreal
EURUSD.
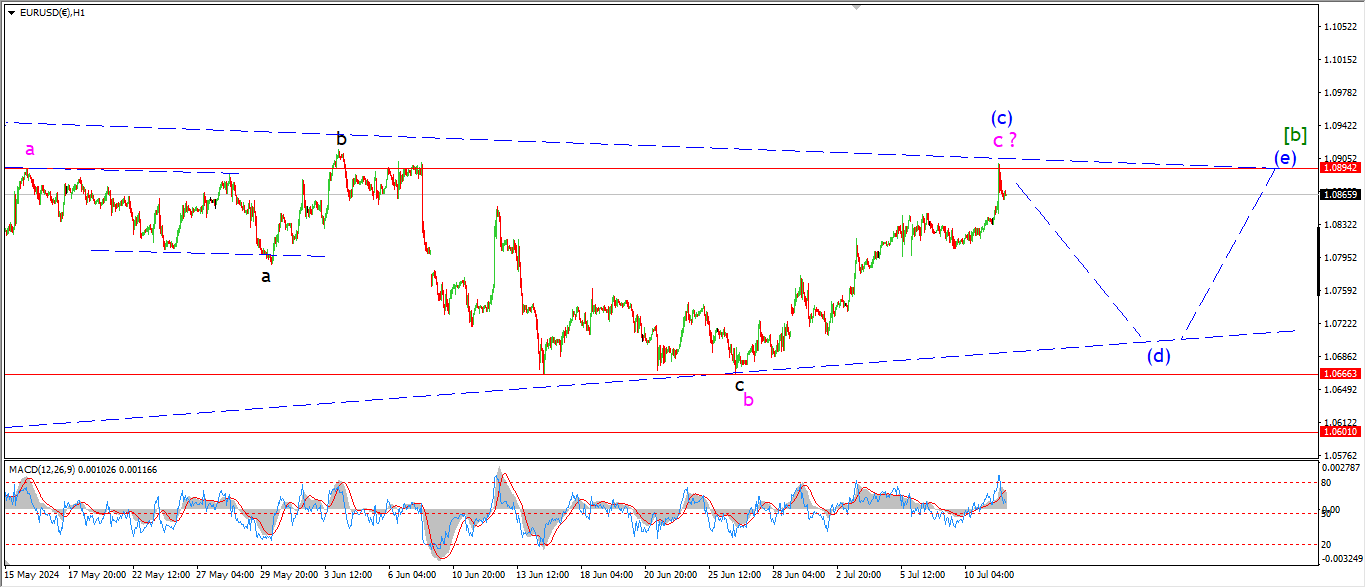
EURUSD 1hr.

EURUSD 4hr.
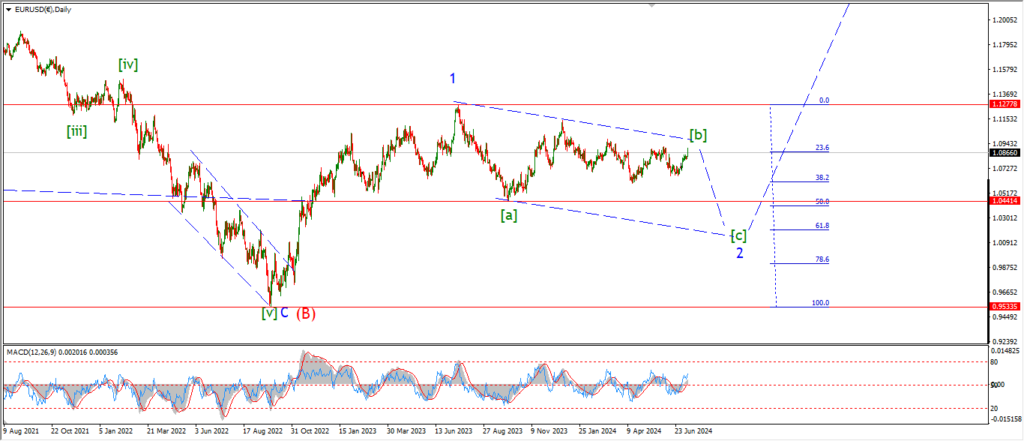
EURUSD daily.
The daily chart in EURUSD shows a three wave correction still underway i wave ‘2’.
The triangle is still in play here for wave [b] of ‘2’,
which leaves wave [c] to fall again and complete three wave pattern back down near 1.00 again later this year.
Todays rally suggests wave (c) of [b] is still developing here.
and the overall pattern in wave [b] suggests another few weeks of sideways action to complete the triangle.
Tomorrow;
Wave ‘c’ of (c) may have a top even now,
so we could see a return lower to begin wave (d) starting now.
Three waves down to 1.0700 is what I expect in wave (d).
GBPUSD
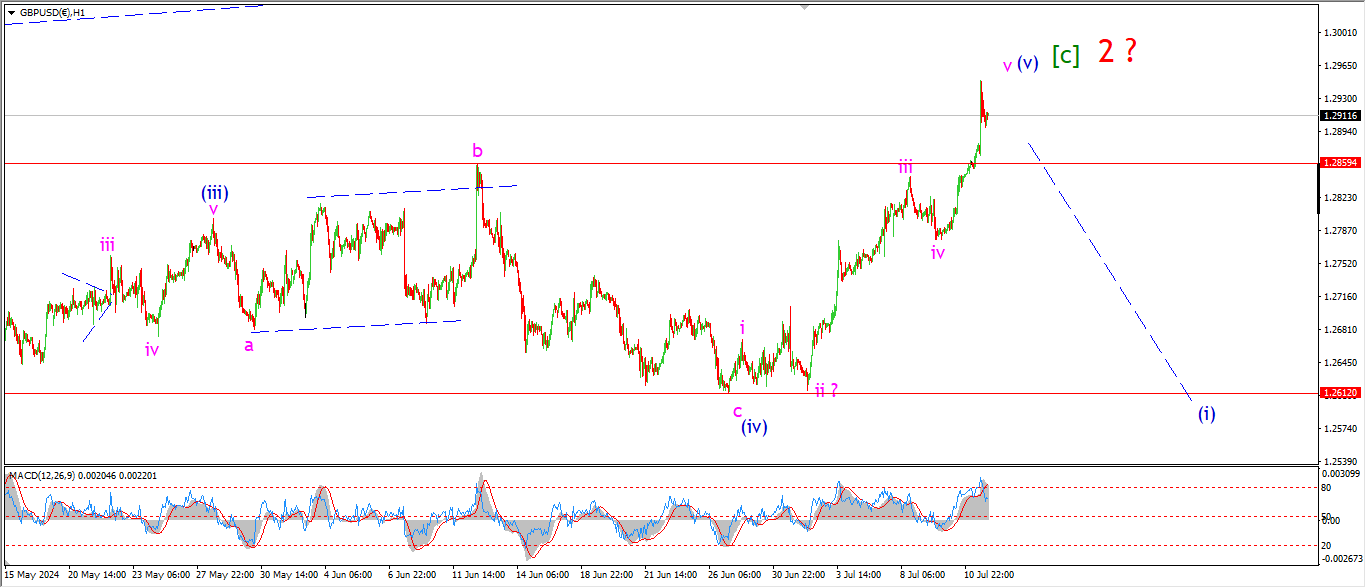
GBPUSD 1hr.
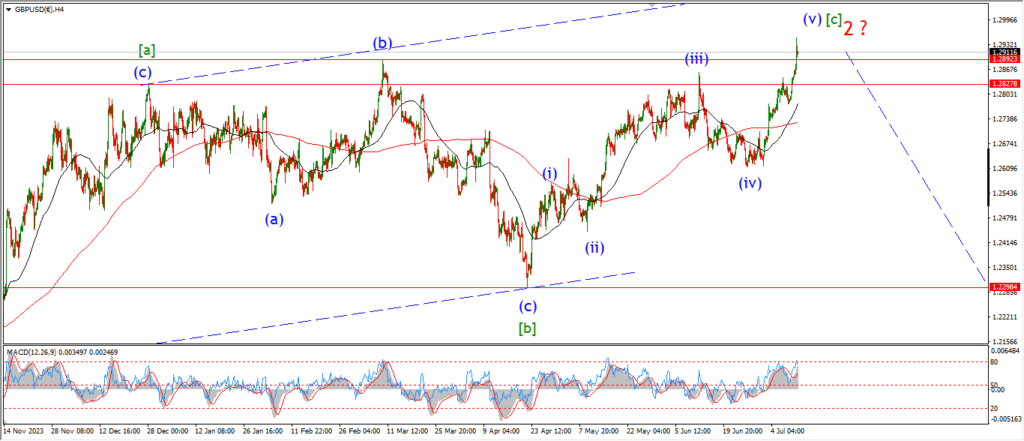
GBPUSD 4hr.
GBPUSD daily.
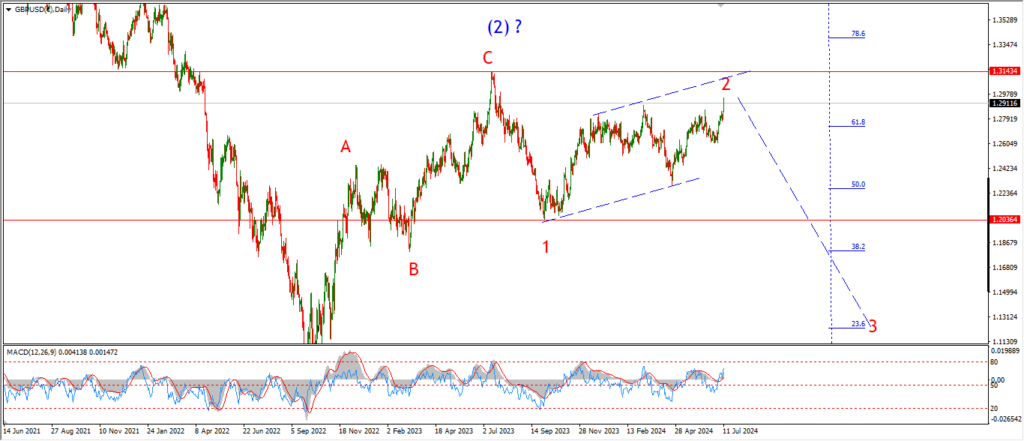
The daily chart shows three waves up in wave ‘2’ as the main idea for cable.
The 4hr chart shows a possible five wave pattern in wave [c] of ‘2’ which has already hit the minimum level to complete the pattern.
And now the new top today has clearly broken through the previous wave ‘b’ top in five waves.
That gives us a potential top for wave (v) of [c].
And next week I will look for a reversal into wave (i) again.
Tomorrow;
Watch for wave (v) to show signs of a top over the coming days.
I dont expect an immediate decline here,
but If we see a drop below 1.2800 again that will raise the chances that wave (i) has begun.
USDJPY.
USDJPY 1hr.
USDJPY 4hr.
USDJPY daily.
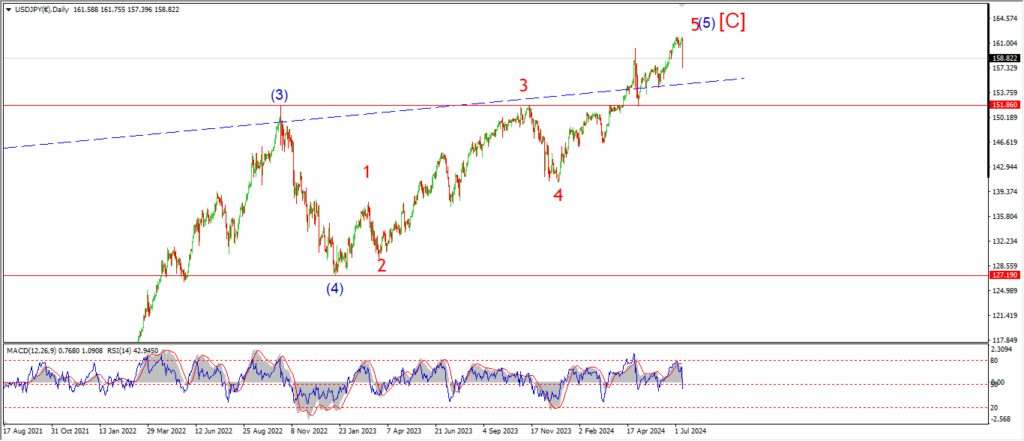
The daily chart shows a pattern that is almost complete in wave ‘5’ of (5) of [C]
Todays sharp drop has not proved the top is in yet,
but we are getting close.
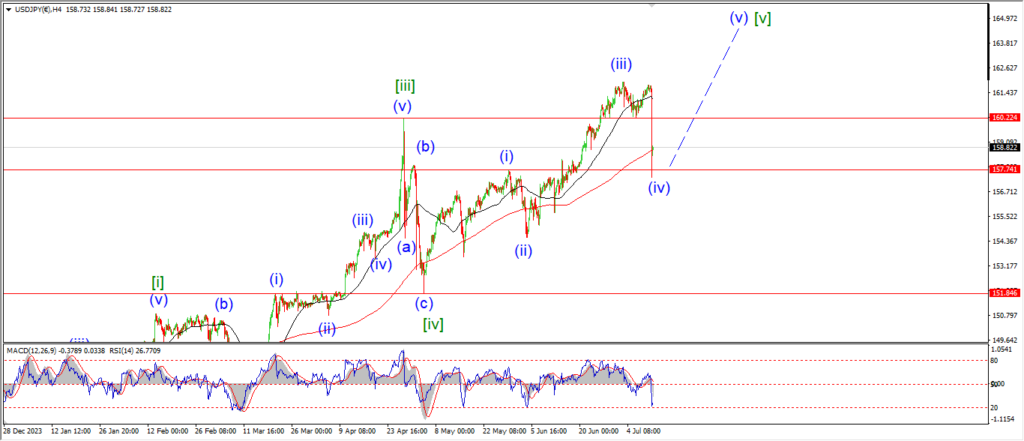
On the 4hr chart I have introduced a new pattern for wave [v] green which is an ending diagonal.
The shar drop today caused an overlap in the previous pattern which triggered the change.
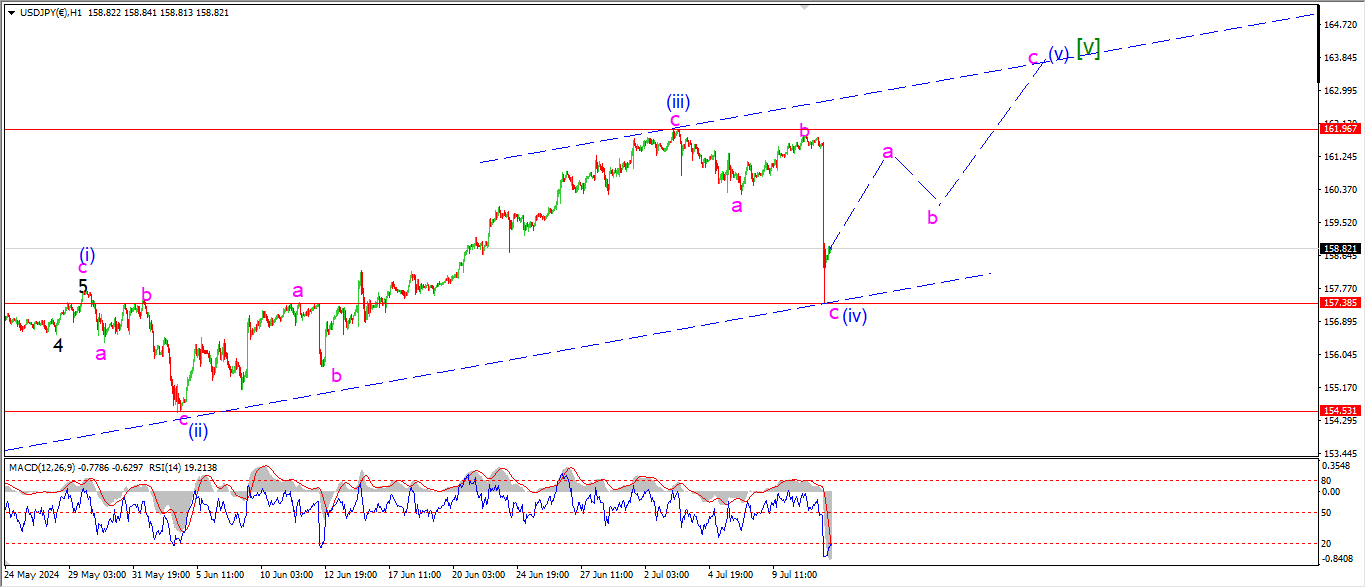
And the hourly chart shows a three wave decline in wave (iv) of [v] of ‘5’ now complete after todays sharp drop.
I am looking for another three wave rally to a new high in wave (v) to top out the larger pattern above 162.00 in the coming weeks.
Once that happens,
then I will turn my focus to the downside again.
Tomorrow;
Watch for that low to hold in wave (iv) at 157.38.
Wave ‘a’ of (v) should retrace most of that decline to confirm this pattern.
DOW JONES.
DOW 1hr.
DOW 4hr
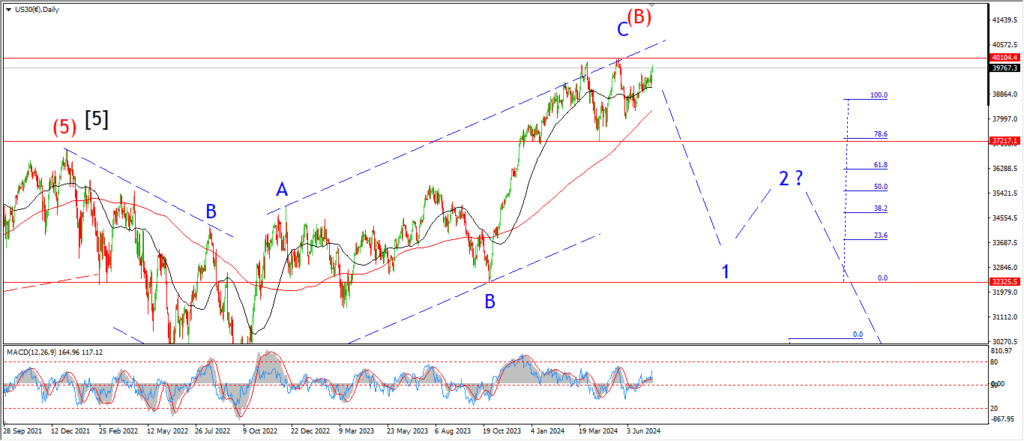
DOW daily.
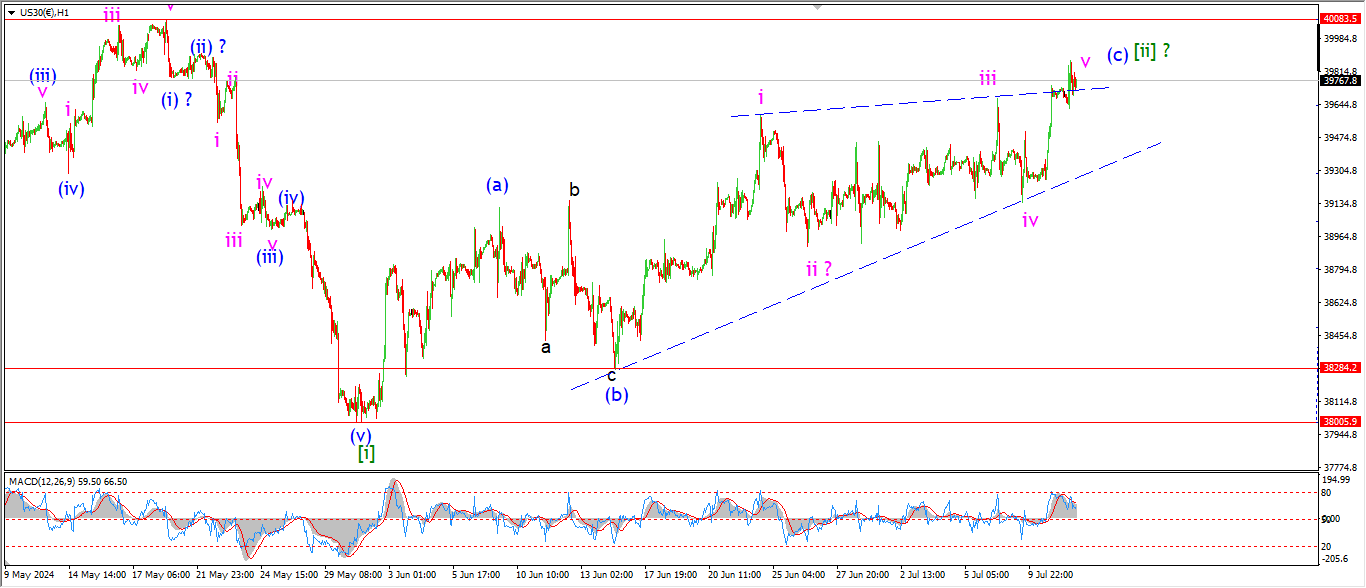
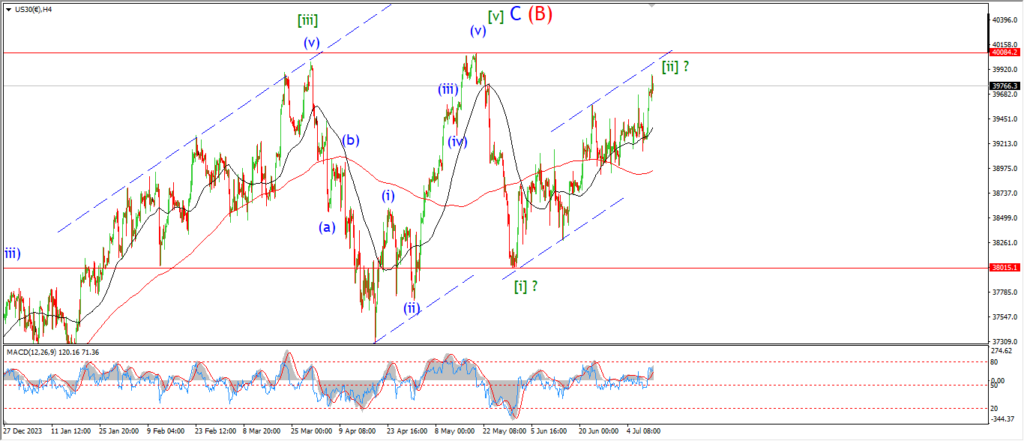
The Dow continues to form a head and shoulders around that recent high.
And as the market approaches the highs again it always causes doubt in the pattern.
At the moment the rally into this lower high is still corrective in nature rather than impulsive.
So the main pattern holds for now.
The hourly chart shows another count for that wave [ii] rally.
The recent sideways grind has complicated the overall pattern for sure.
But this can be viewed as part of an ending diagonal wave (c) as shown.
Tomorrow;
The market hit the low of wave [i] on may 30th,
it took 10 days to drop into that low.
It has been a 42 day hike back to this lower high in wave [ii].
So where does the impulsive bias lie?
I can be proved wrong again in this pattern for sure because I do not know the future!
But as long as this dynamic holds,
then I will continue to test the possibility of a topping pattern.
GOLD
GOLD 1hr.
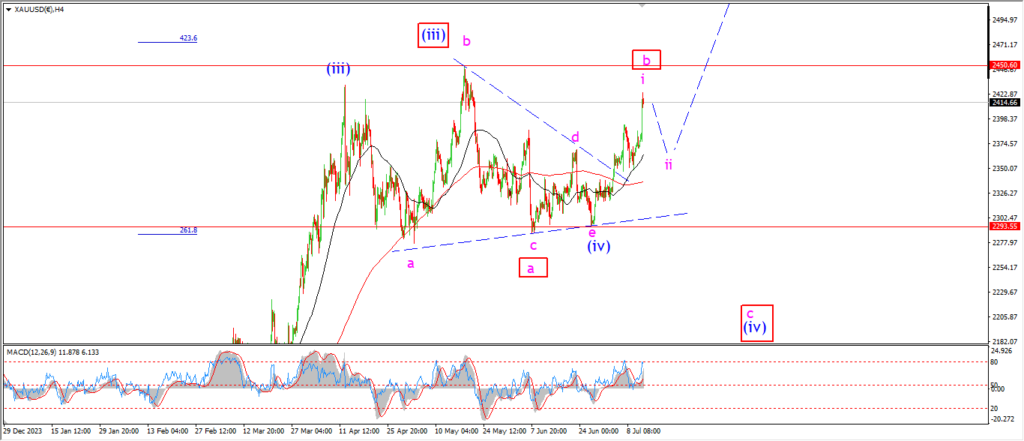
GOLD 4hr.
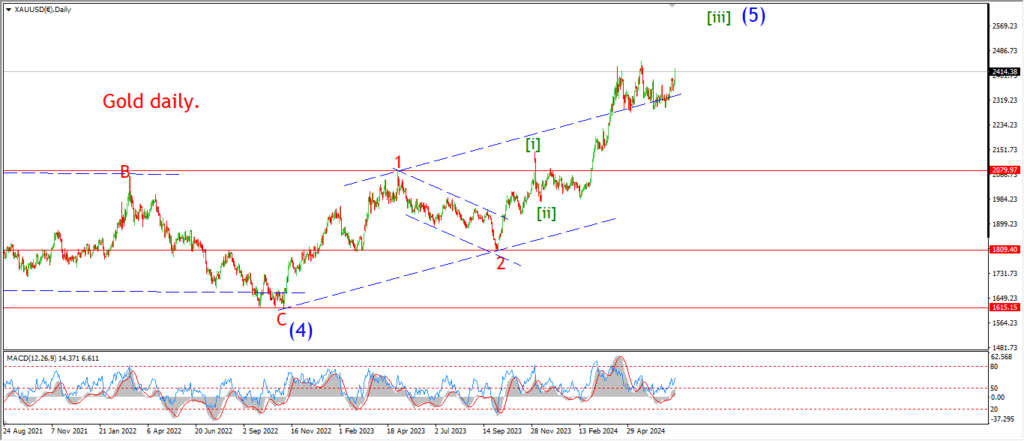
GOLD daily.
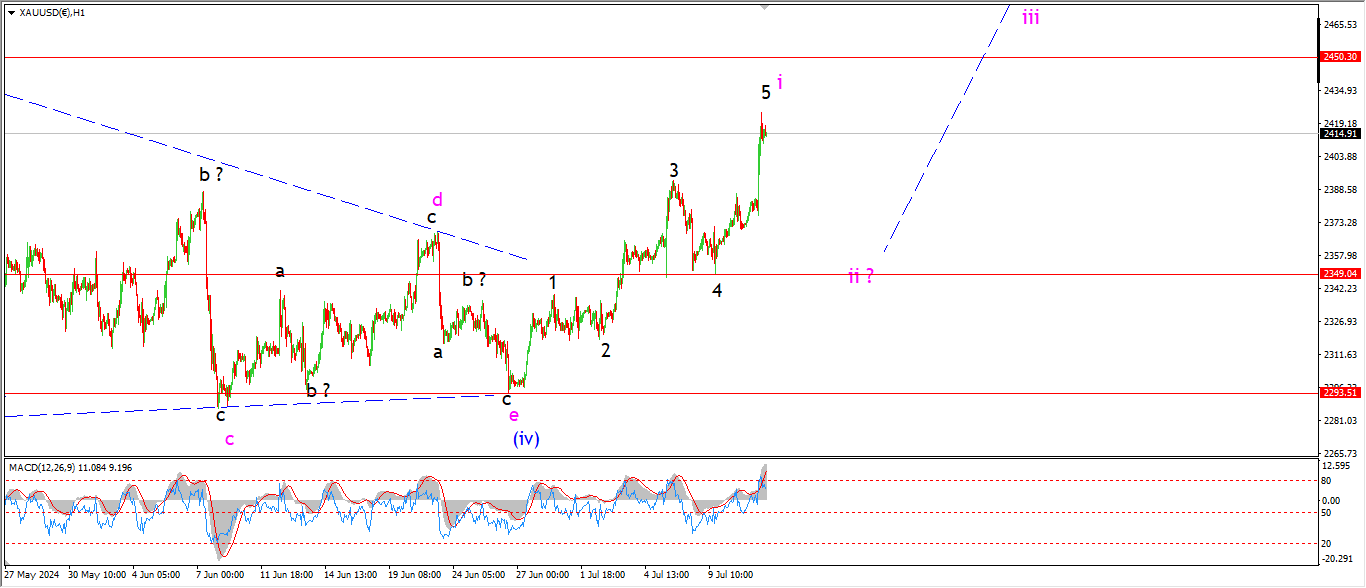
This weeks action has been positive for gold as it opens up the possibility that wave (v) has finally begun.
The 4hr chart shows a triangle complete at 2293,
and a five wave rally in wave ‘i’ of (v) now in place off that low.
There is still an alternate possibility for wave (iv) that has not been ruled out yet,
next weeks action will rule that out if all goes smoothly.
The hourly chart shows a new count for wave ‘i’ and ‘ii’ of (v).
a five wave rally is visible off the lows at wave (iv).
and now a three wave decline should begin from here in wave ‘ii’.
A bullish higher low will form next week in wave ‘ii’.
and from there wave ‘iii’ will be ready to push out to a new high.
Tomorrow;
Watch for wave ‘i’ to top out soon and then fall correctively into wave ‘ii’ back towards 2350.
CRUDE OIL.
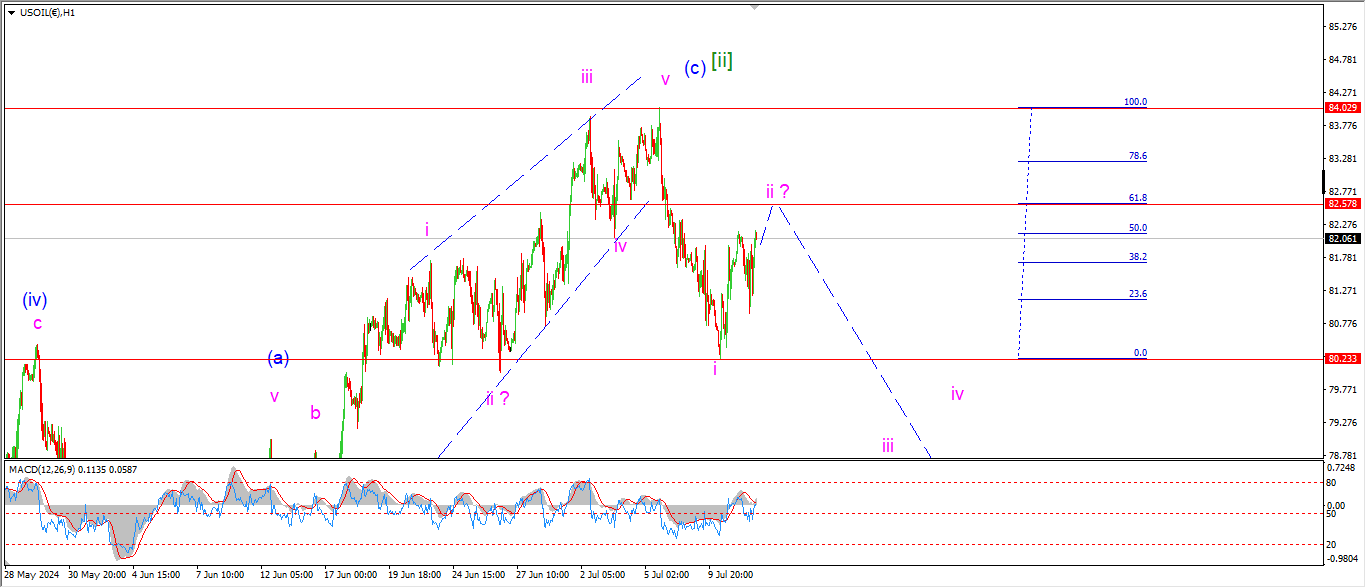
CRUDE OIL 1hr.
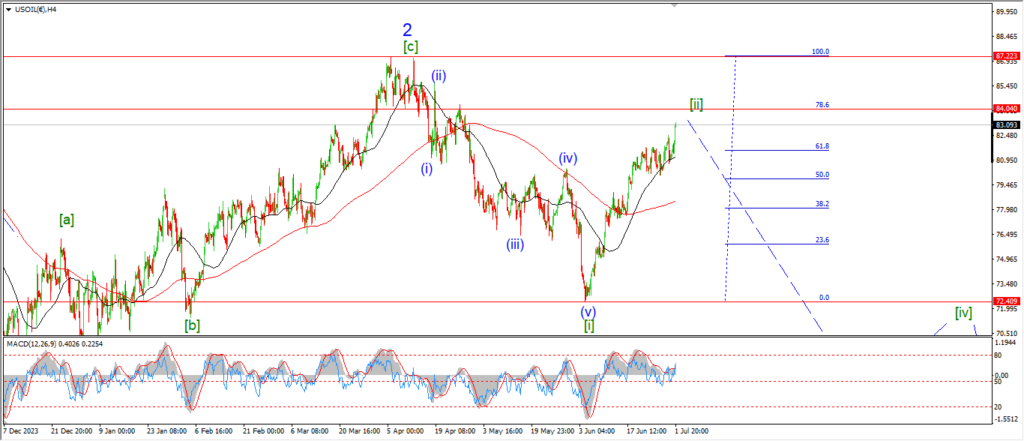
CRUDE OIL 4hr.
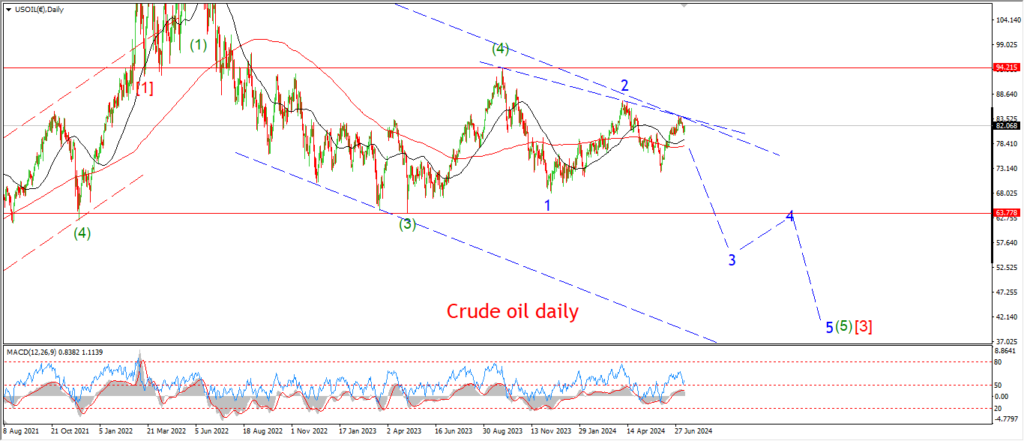
CRUDE OIL daily.
The daily chart shows a set of 1,2, patterns off the wave (4) high.
The price remains at a lower high below wave ‘2’ blue and wave ‘3’ is still in play.
The 4hr chart shows the price has cooled off from the wave [ii] high early this week.
So I am looking lower into wave [iii] of ‘3’ unless something completely changes here.
The hourly chart shows a 50% retracement into the highs today.
wave ‘ii’ is not done yet is seems,
so I will look for wave ‘ii’ to top out at the 62% retracement level at 82.50.
Tomorrow;
Watch for wave ‘i’ to complete a three wave lower high near 82.50.
S&P 500.
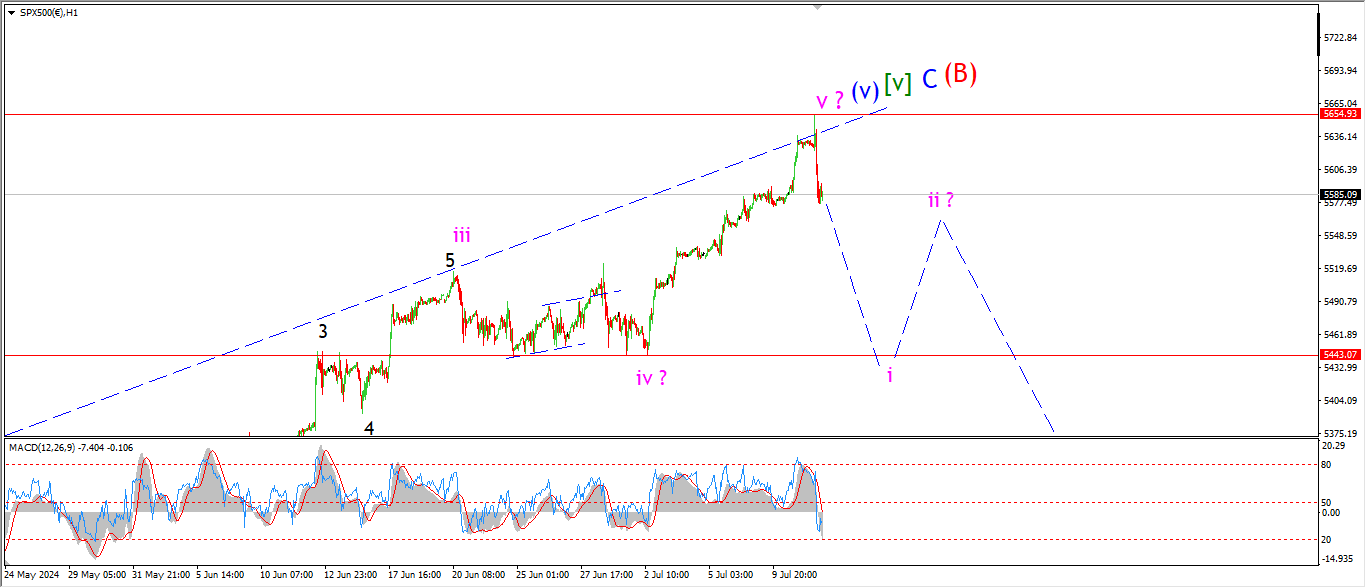
S&P 500 1hr
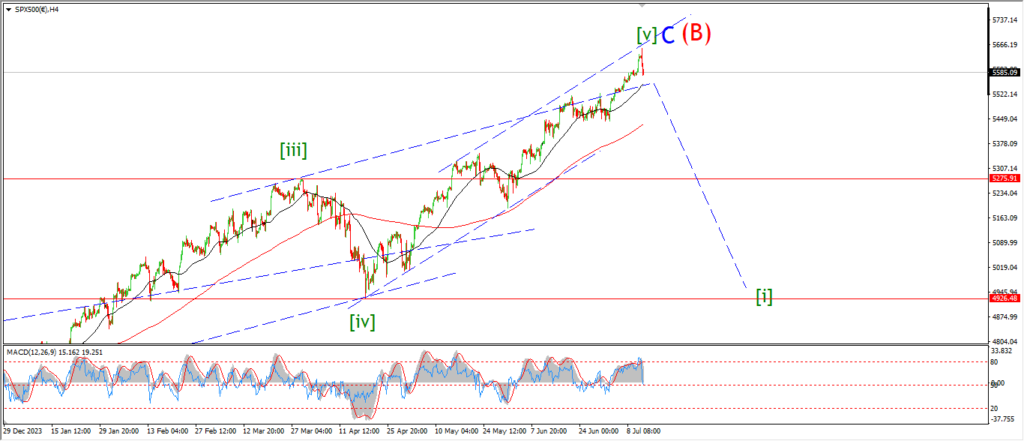
S&P 500 4hr
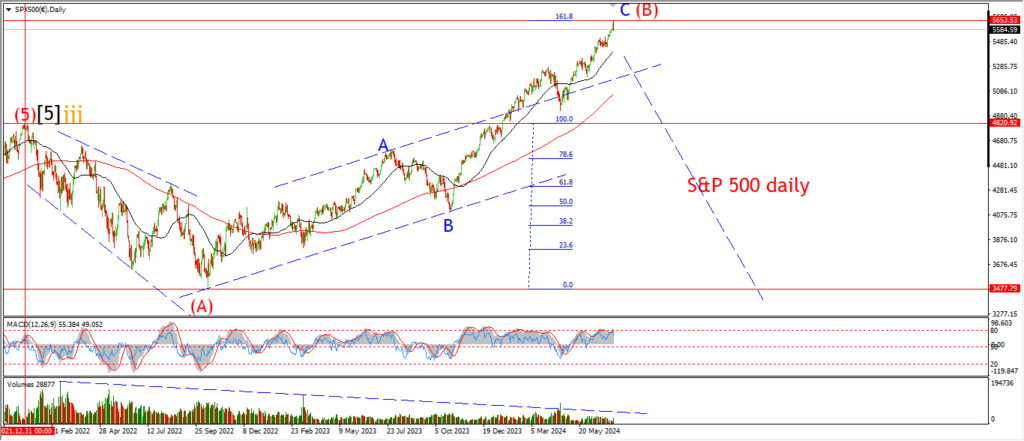
S&P 500 daily.
The last nine months has been the craziest rally with an almost unstoppable upward bias.
This cannot last,
and so it will not last.
An interesting data point was hit this week.
The rally into wave (B) has retraced 162% of the decline into wave (A).
An expanded flat wave (B) has created a new all time high in the market,
but it still holds a relationship to the decline in 2022 in wave (A).
So I think this pattern has merit,
and it surely explains the unhinged nature of the market to the reality on the ground.
Wave (B) is a fake wave,
this economy is a bubble created by massive stimulus,
and therefore,
fake to the core.
Wave (C) will bring us back to reality again for sure.
Tomorrow;
The market hit the upper trend channel line today and then reversed quite sharply.
WE will see if this drop can develop into something more interesting next week.
Wave ‘i’ beckons,
so I am watching 5440.
SILVER.
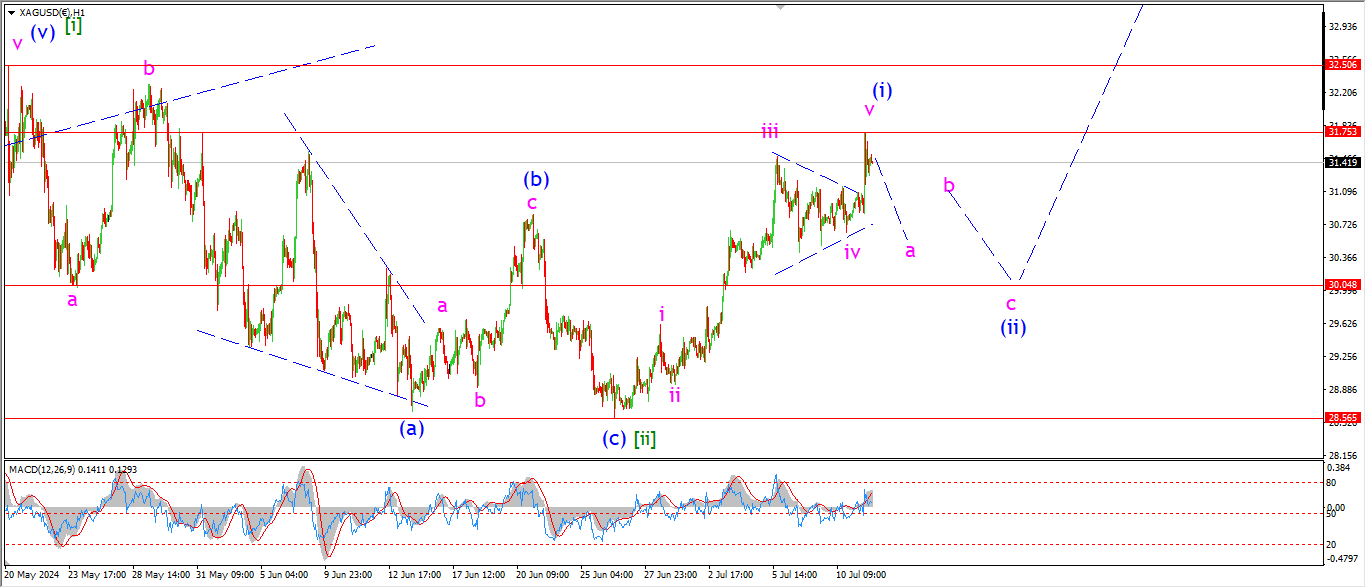
SILVER 1hr
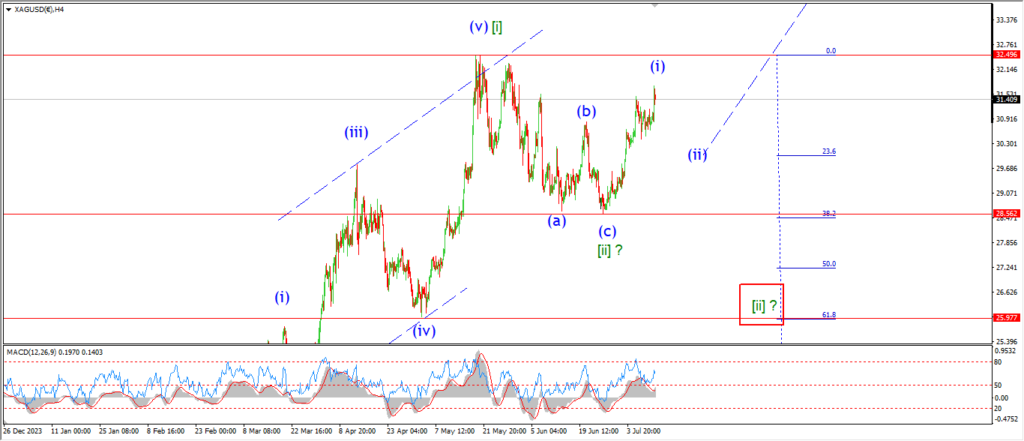
SILVER 4hr.
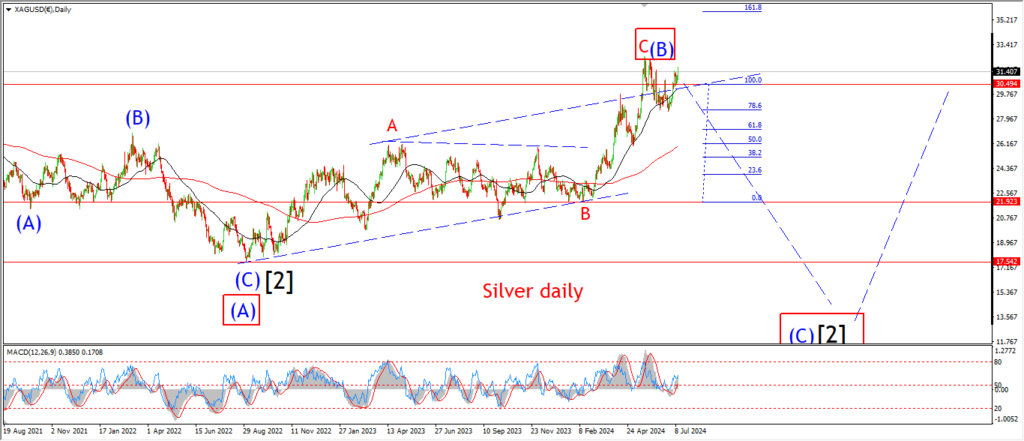
SILVER daily.
I am looking at another possibility for the recent rally today.
The 4hr chart shows a possible completed pattern in wave [ii] green.
Wave (i) of [iii] has rallied off that low at 28.56.
And wave (ii) is expected to turn lower soon.
Wave (ii) should follow over the coming days and trace out a three wave decline towards 30.00
and that will setup for a rally into wave (iii) later next week.
The rally into wave (i) has not been challenged at all yet,
so I would wait for a reasonable retracement into the 30.00 area before considering a larger rally into wave (iii).
Tomorrow;
Watch for wave (ii) to take up most of the next few days.
A fall into the low of wave ‘iv’ will signal wave ‘a’ of (ii) is in play.
BITCOIN
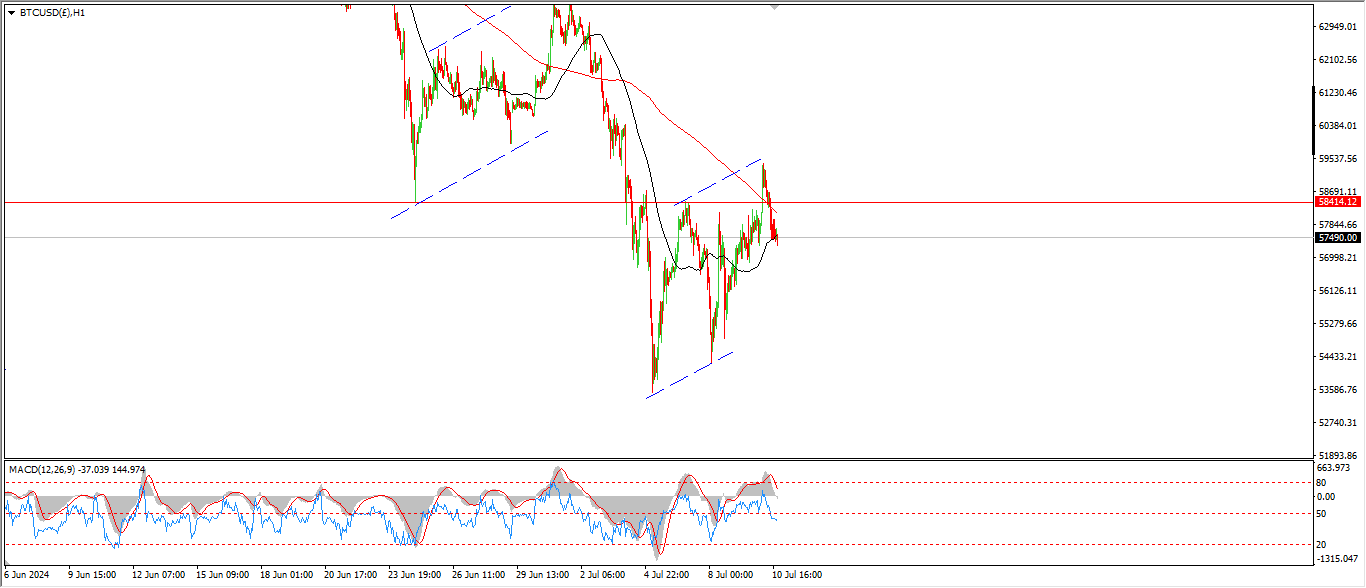
BITCOIN 1hr.
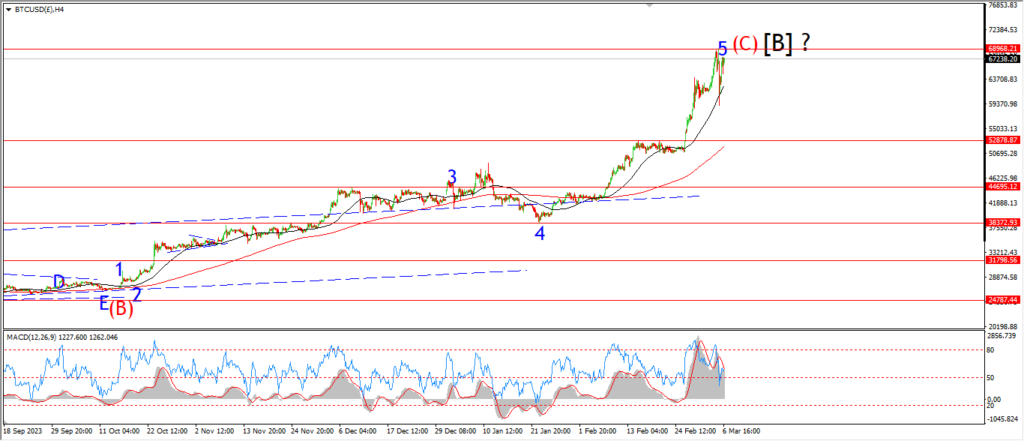
BITCOIN 4hr.
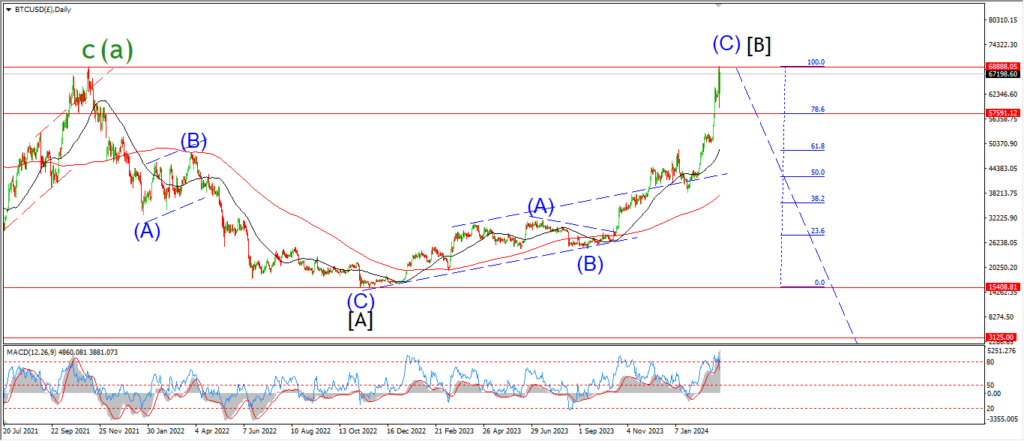
BITCOIN daily.
….
FTSE 100.
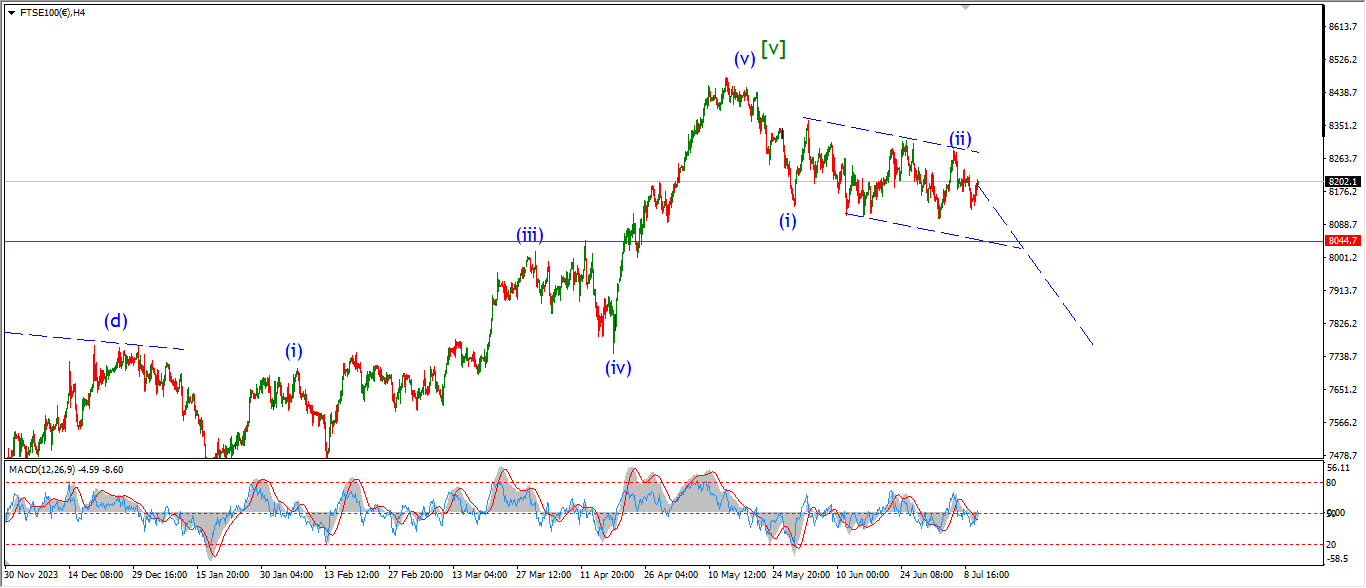
FTSE 100 1hr.

FTSE 100 4hr.

FTSE 100 daily.
….
DAX.
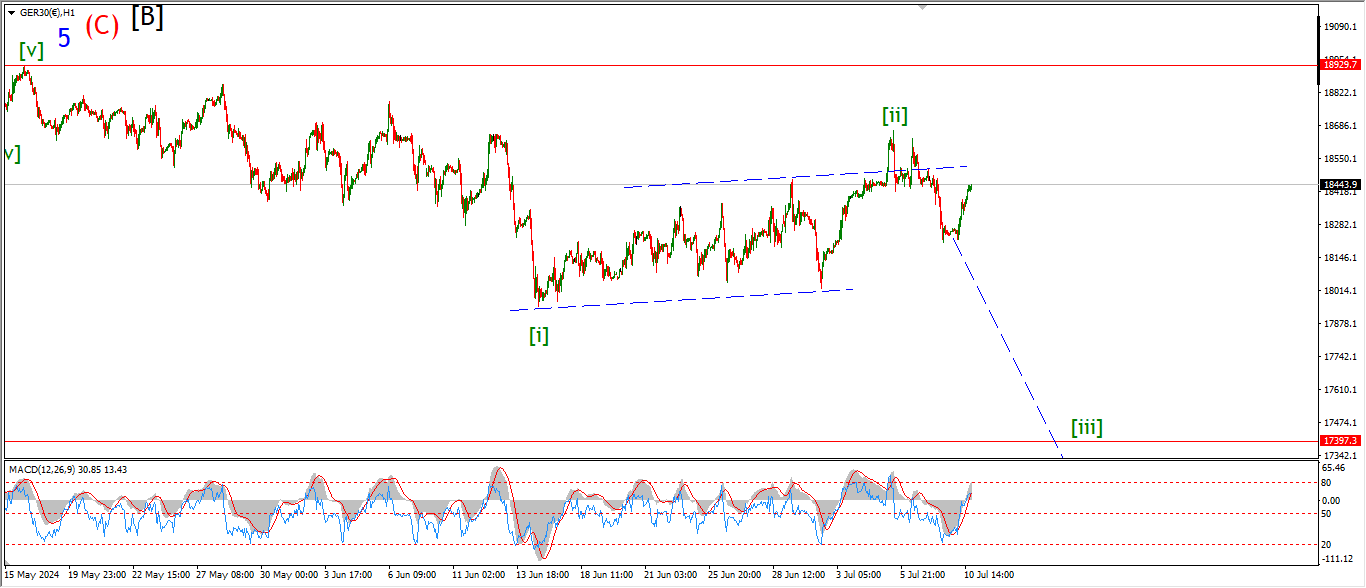
DAX 1hr
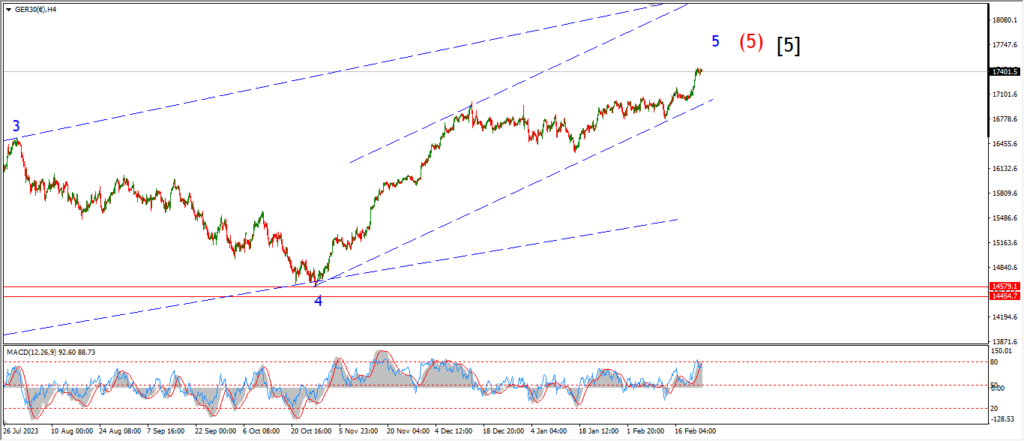
DAX 4hr

DAX daily.
….
NASDAQ 100.
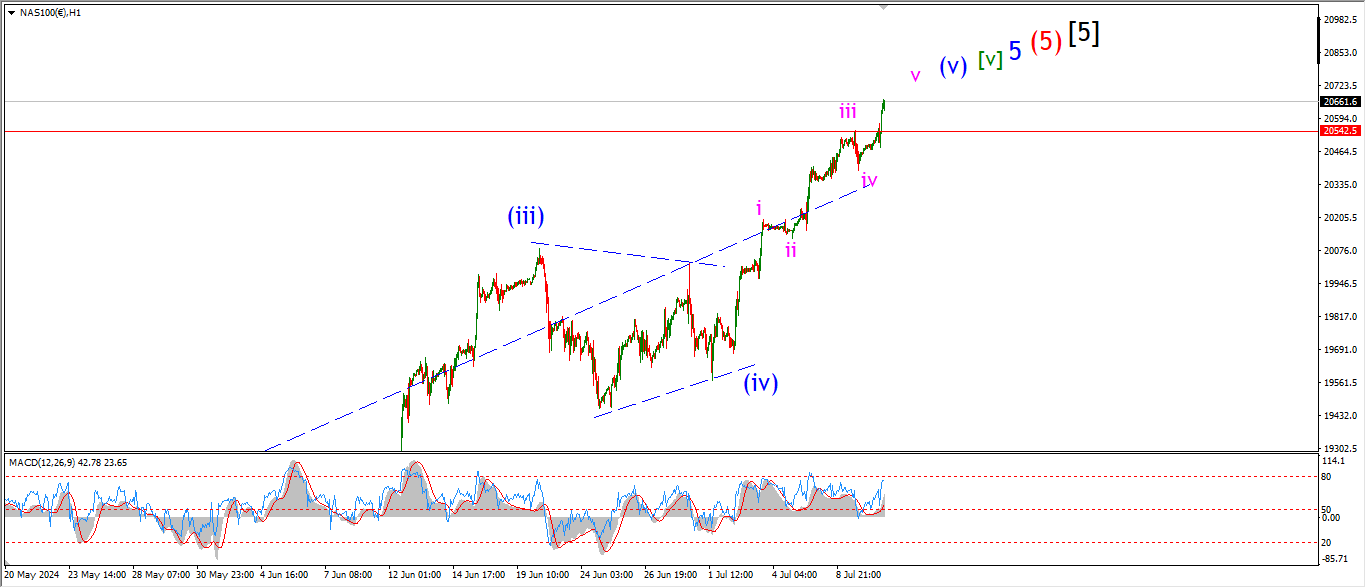
NASDAQ 1hr
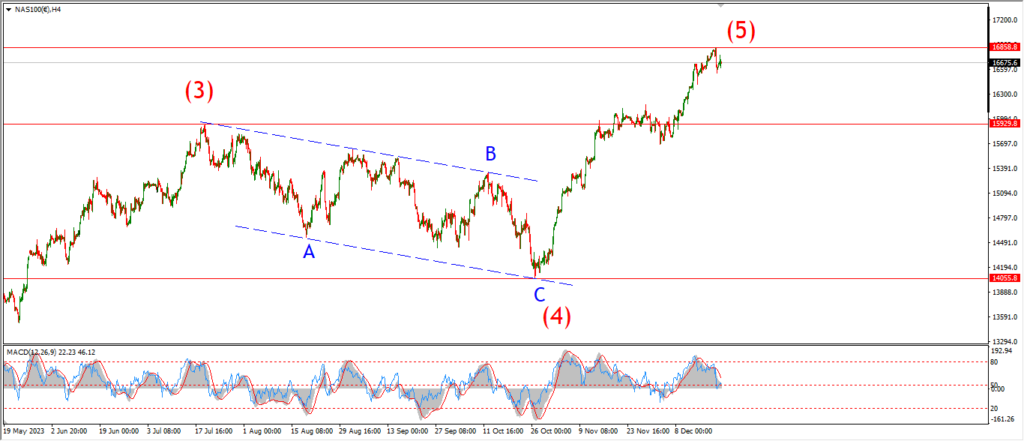
NASDAQ 4hr.
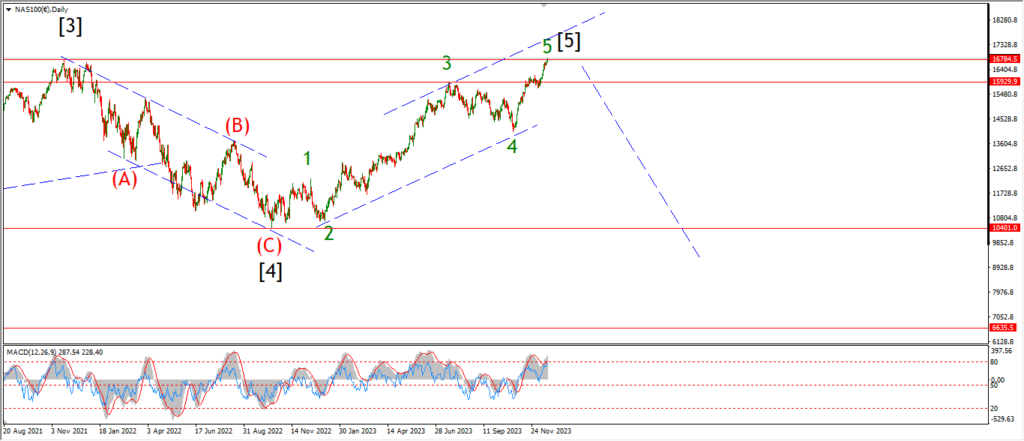
NASDAQ daily.
….