Good evening folks, the Lord’s Blessings to you all.
https://twitter.com/bullwavesreal
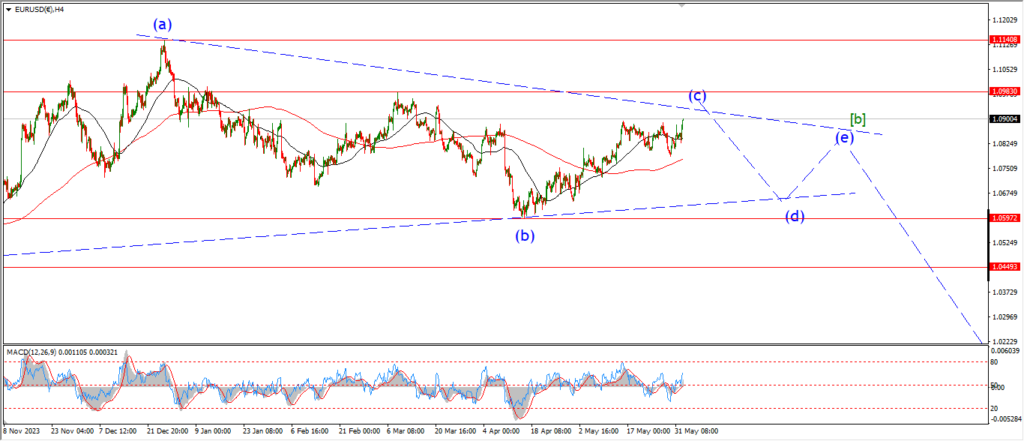
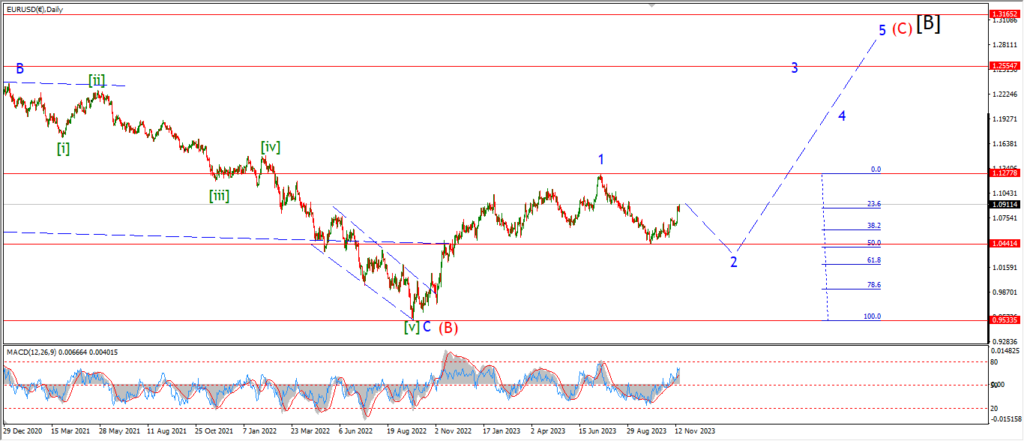
EURUSD.
EURUSD 1hr.
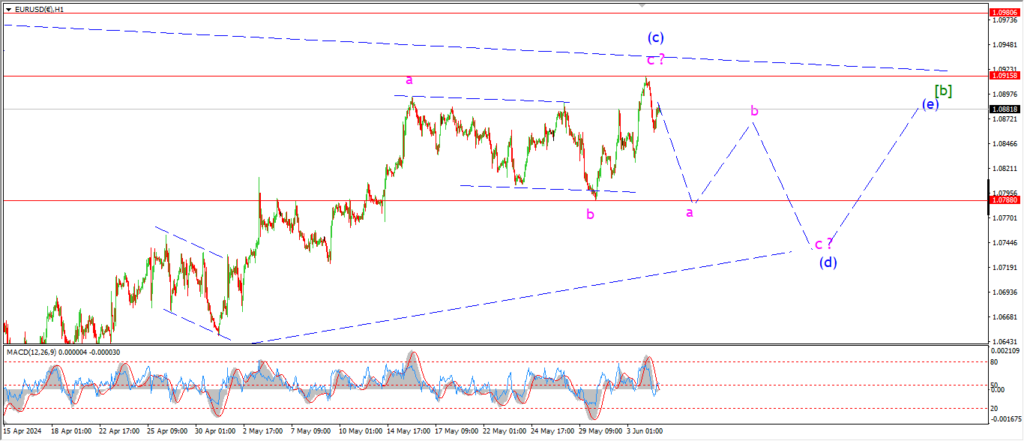
EURUSD has retraced much of yesterdays rally and that has only added a layer of complexity to be honest.
I can suggest that wave ‘c’ of (c) has again formed a potential top today.
But I will need to see a drop back below 1.0788 to confirm wave (d) is in play.
Tomorrow;
Watch for 1.0915 to hold.
Wave ‘a’ of (d) should fall back below 1.0788 to confirm wave (c) has topped and wave (d) is underway.
GBPUSD
GBPUSD 1hr.
GBPUSD 4hr.
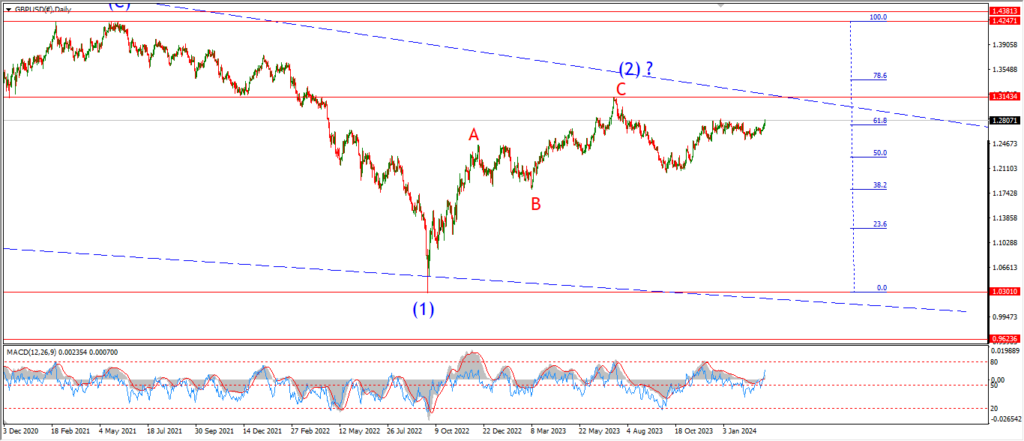
GBPUSD daily.
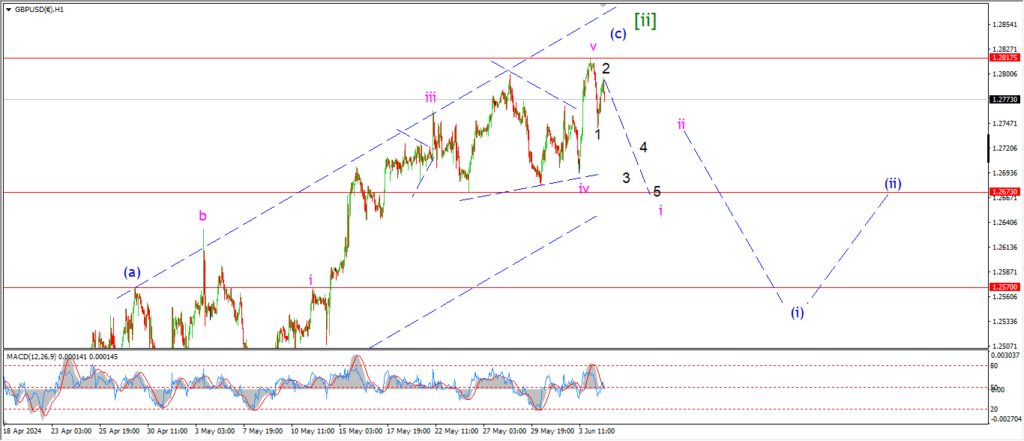
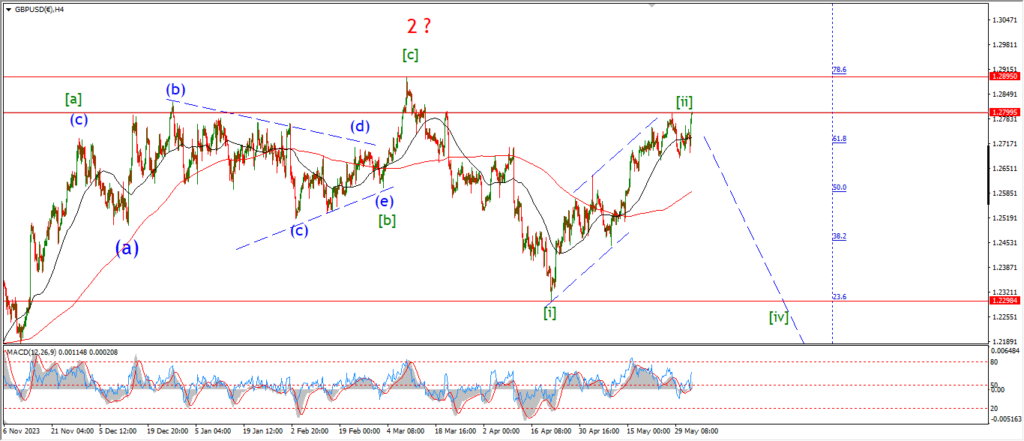
Cable did drop off Mondays high also today and there is a potential that wave ‘i’ is underway here.
I have shown todays spike lower as wave ‘1’ and ‘2’ of ‘i’.
If this count plays out,
then we will see a larger impulse patter lower build over the rest of the week in wave (i) blue.
Tomorrow;
A break below 1.2670 will signal wave ‘i’ pink is underway.
Lets see if the top at 1.2817 will hold to allow this pattern to build.
USDJPY.
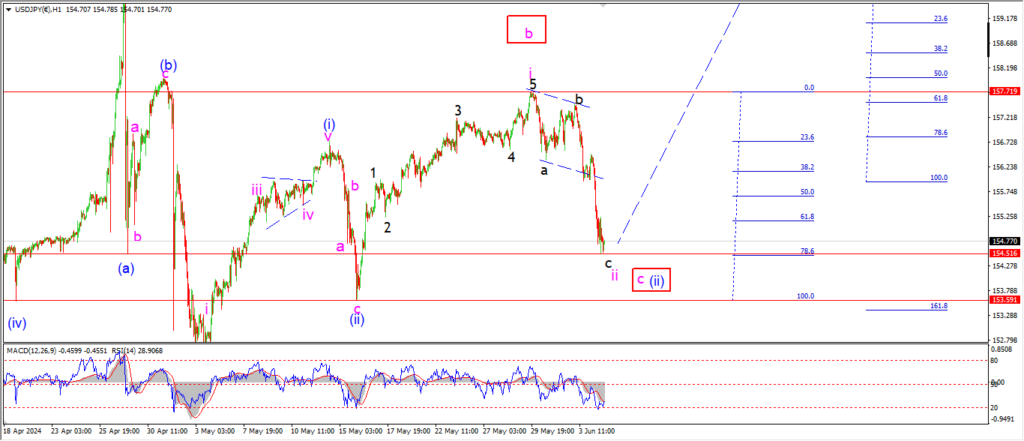
USDJPY 1hr.
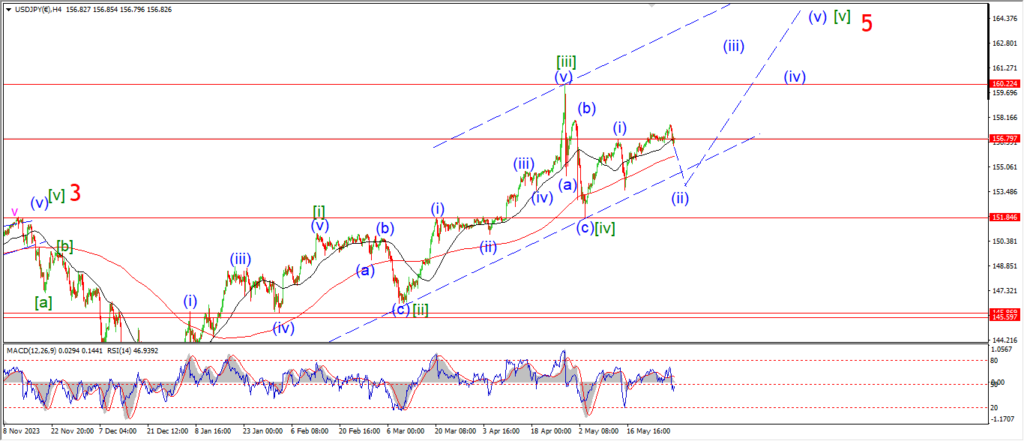
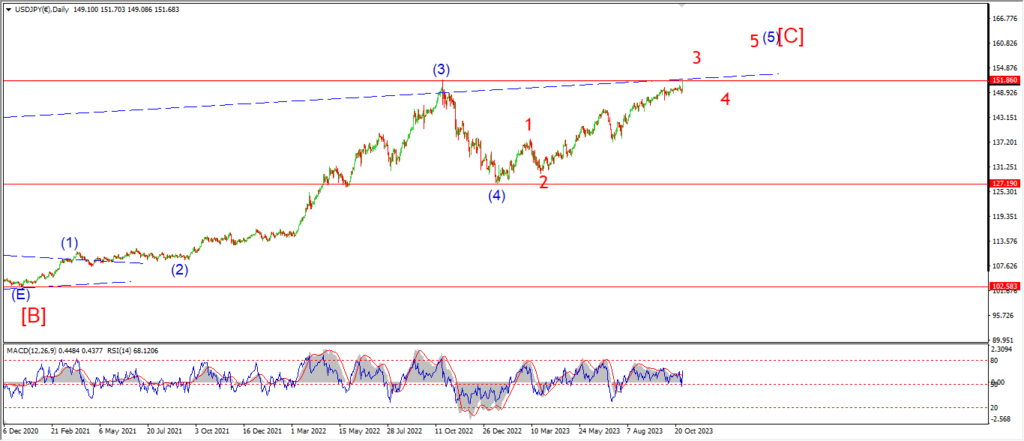
Well USDJPY took a hit today that has pushed us back towards that alternate wave (ii) count.
The main idea has not been invalidated yet though.
A break of 153.60 again will do that.
So far wave ‘ii’ has retraced to the 78.6% Fib level at todays lows,
but,
the price must turn higher again very soon in order to stick with this pattern in wave ‘ii’ pink.
Tomorrow;
Watch for wave ‘ii’ to hold above 153.60.
wave ‘iii’ up must begin tomorrow.
DOW JONES.
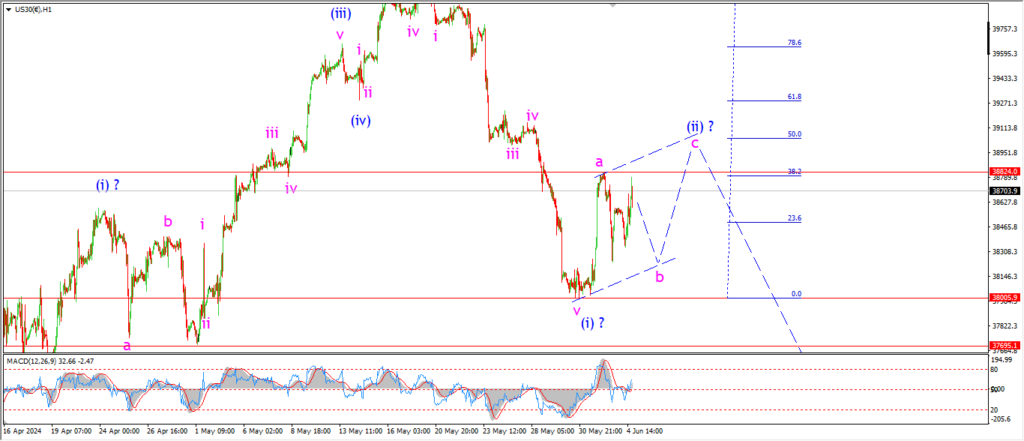
DOW 1hr.
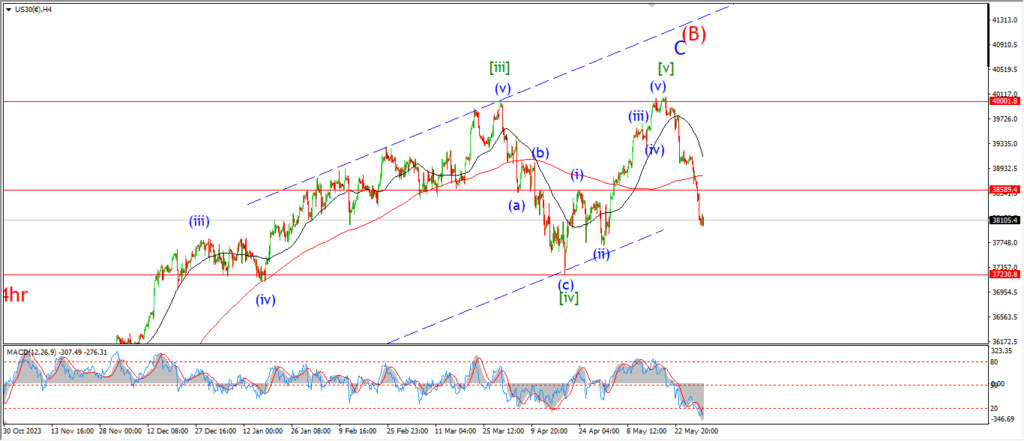
DOW 4hr
DOW daily.
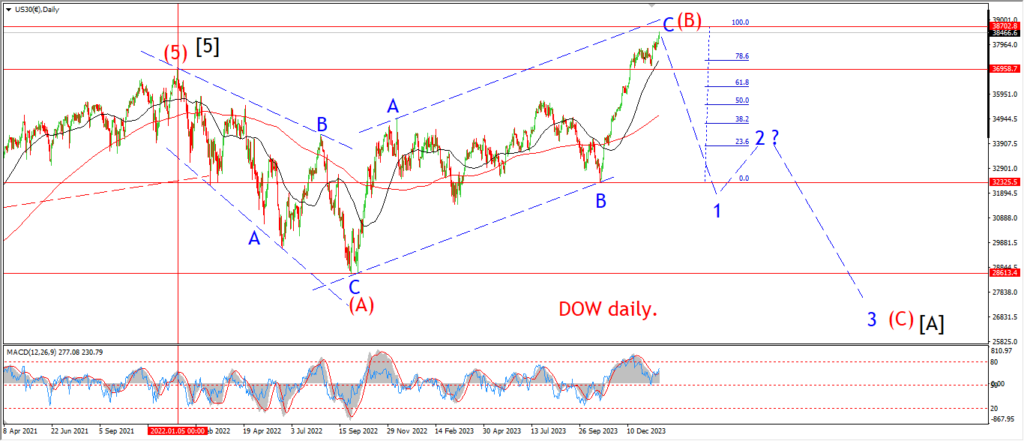
Wave ‘c’ of (ii) did make an attempt to break above the wave ‘a’ high at 38824.
The market has failed so far below that level.
And this evening brings a drop back off the session high to end the session.
I will not change the wave count for wave (ii) yet because there is a possibility that wave ‘b’ of (ii) may be tracing out a larger three wave pattern as shown.
If this count is correct for wave (ii),
then we will see a rally back above 38824 to complete the pattern later this week.
Tomorrow;
Watch for wave (ii) to continue to develop in three waves as shown over the coming days.
Wave ‘b’ of (ii) should complete above the wave (i) high by tomorrow evening.
GOLD
GOLD 1hr.
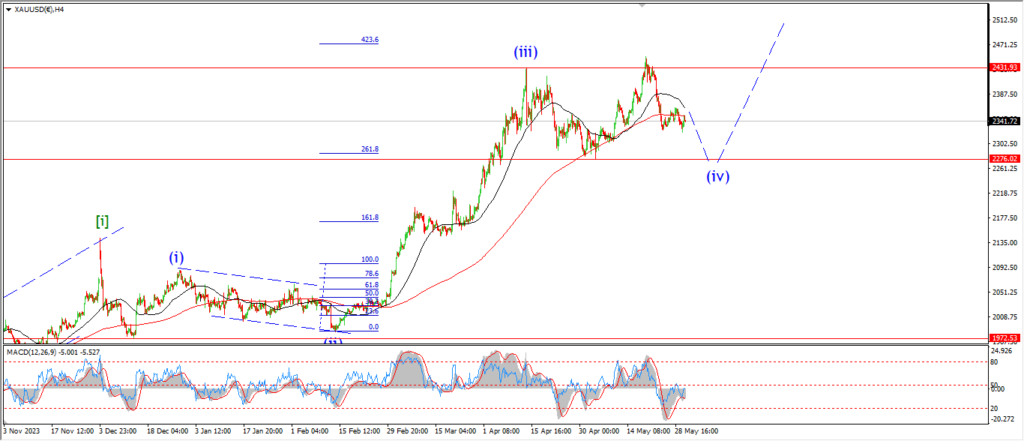
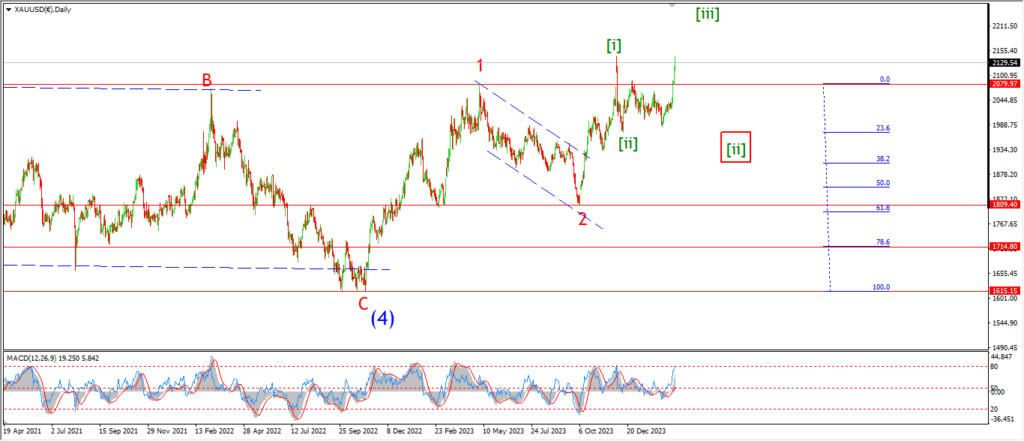
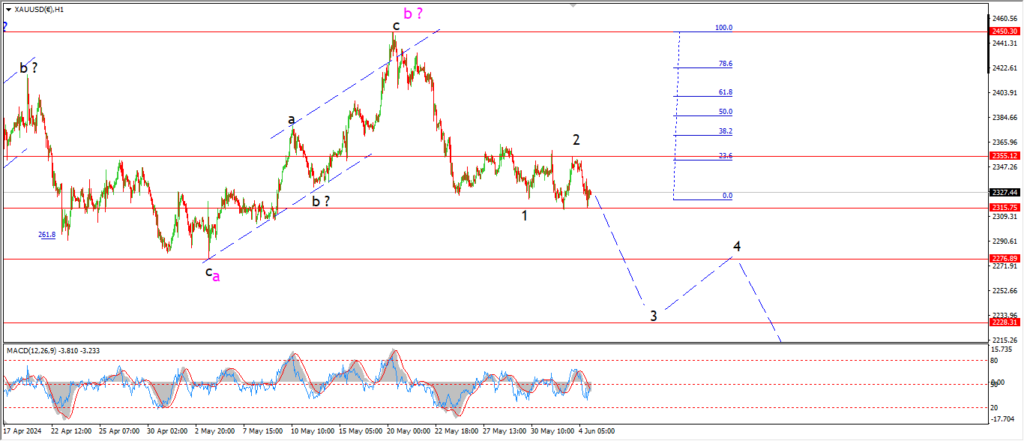
The wave count has not changed for wave ‘c’ today but I am still uncertain about that wave ‘2’ pattern.
the price has fallen today to a double bottom this week,
the move is not big enough to confirm wave ‘3’ is underway.
I want to see a drop back below 2276 to confirm wave ‘3’ of ‘c’.
So hopefully tomorrow this pattern can finally fill out to the downside and later this week we could be looking at a significant low in wave (iv).
Tomorrow;
Watch for wave ‘3’ of ‘c’ to fall back below 2276.
CRUDE OIL.
CRUDE OIL 1hr.
CRUDE OIL 4hr.
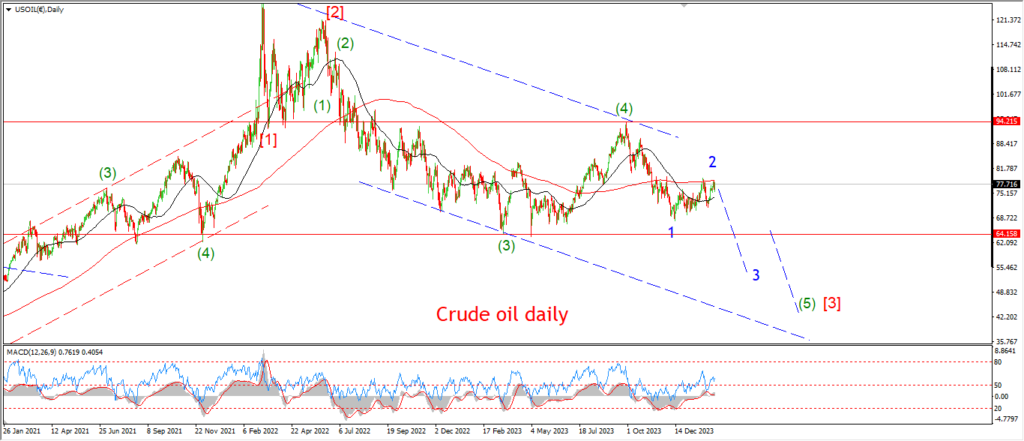
CRUDE OIL daily.
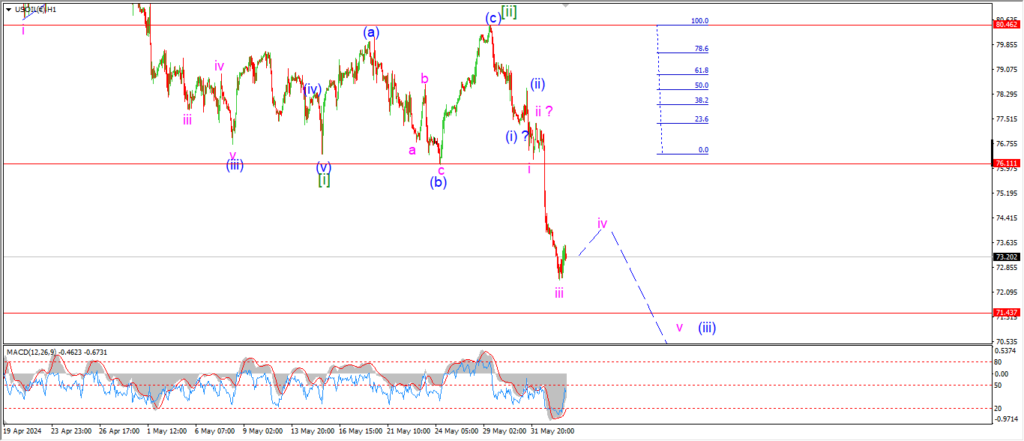
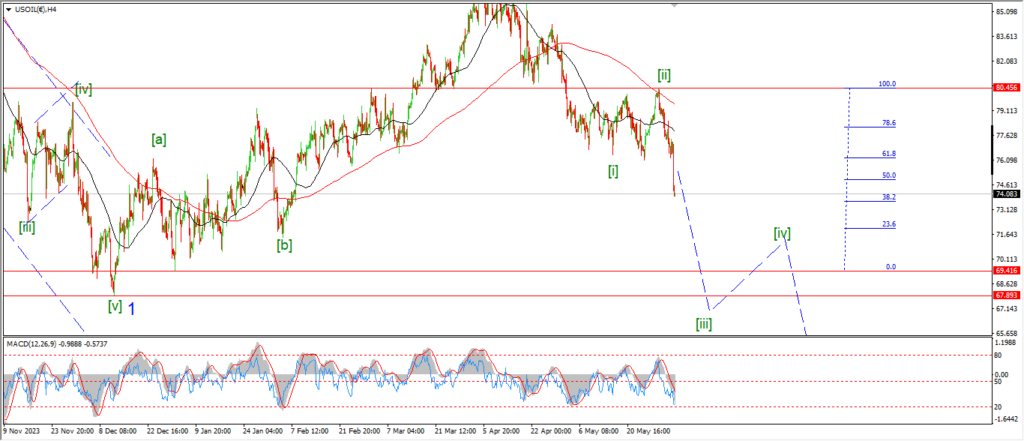
Crude is holding just above the lows of the session this evening.
It seems that wave ‘iii’ of (iii) is complete at the lows,
and wave ‘iv’ is now underway.
I don’t want to see any rally into wave ‘iv’.
Wave ‘iv’ must hold below that 76.00 level for this count to remain valid.
But I would like to see wave ‘iv’ complete as a very shallow sideways pattern to be honest.
And then wave ‘v’ of (iii) must turn lower again.
Tomorrow;
Watch for wave ‘iv’ to consolidate the action below 74.50.
And wave ‘v’ of (iii) can then turn lower to break 71.00 again.
S&P 500.
S&P 500 1hr
S&P 500 4hr
S&P 500 daily.
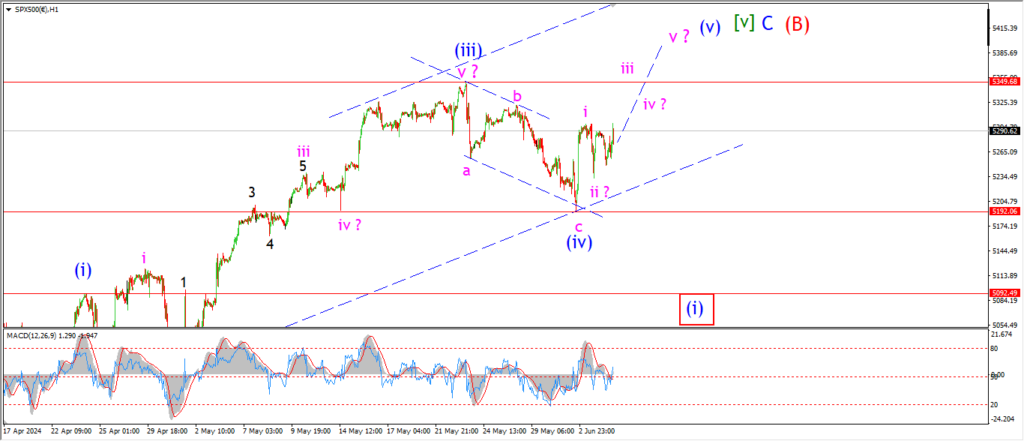
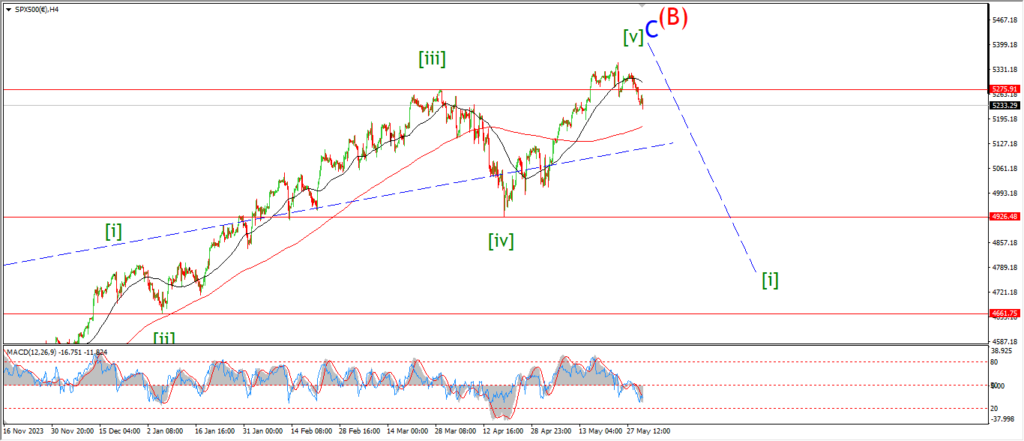
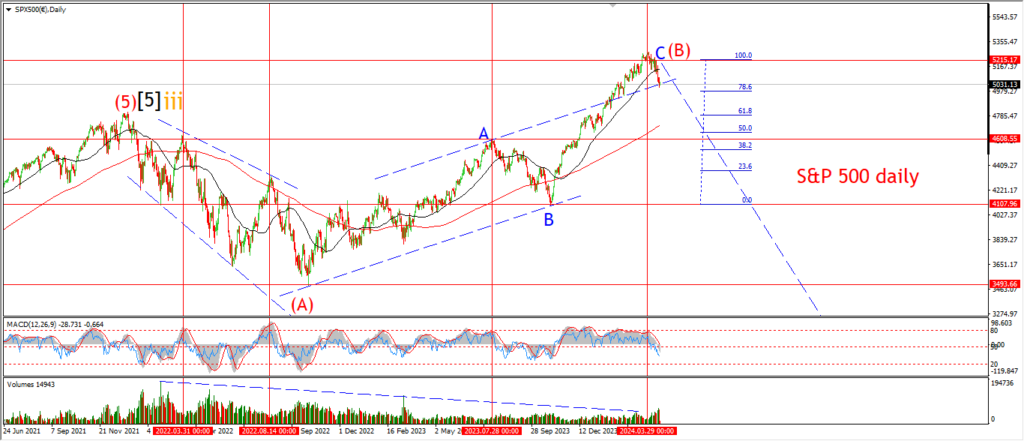
There has not been much progress in the pattern today so the wave count has not changed.
Wave (v) is expected to break to a new high in this scenario this week.
So as long as the wave (iv) low holds at 5192,
then I can stick with this count.
Tomorrow;
Watch for wave ‘iii’ of (v) to push back to the highs again to confirm this pattern.
SILVER.
SILVER 1hr
SILVER 4hr.
SILVER daily.
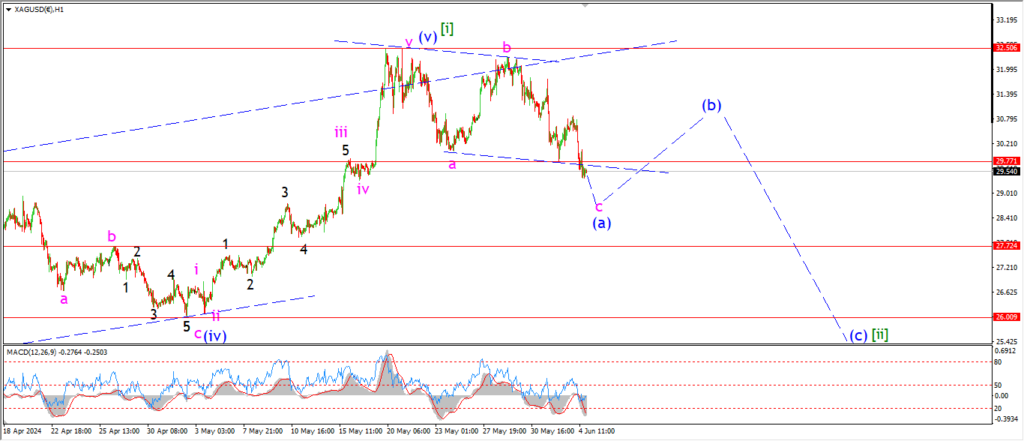
Wave ‘c’ of (a) has dropped below the wave ‘a’ low today which meets the minimum target for wave (a).
I was looking for a lower close to wave (a) near 29.00.
We will see if we get there tomorrow before turning up into wave (b).
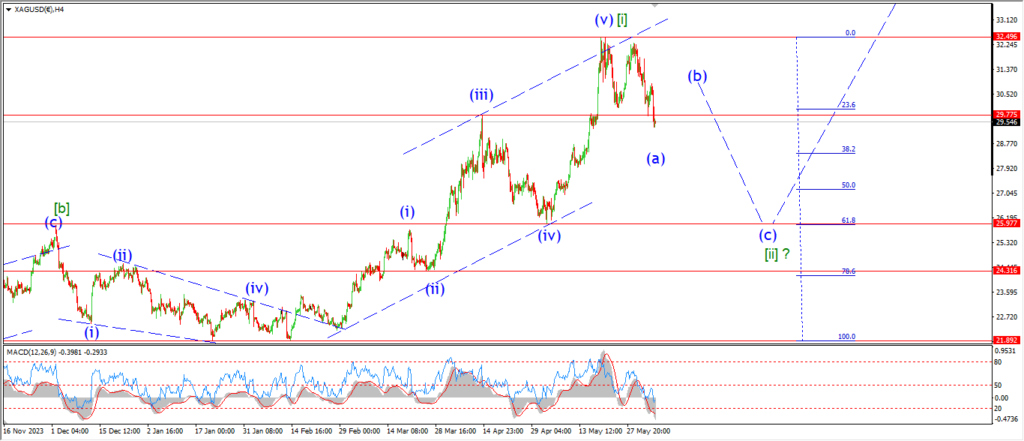
On the 4hr chart you can see that the price has not reached the previous wave (iii) high again.
That level is offering some support for the moment.
this area may be the close to wave (a) and any rise from here will be the beginning of wave (b).
Tomorrow;
Watch for wave ‘c’ of (a) to find a low near the 29.00 area and then turn higher into wave (b).
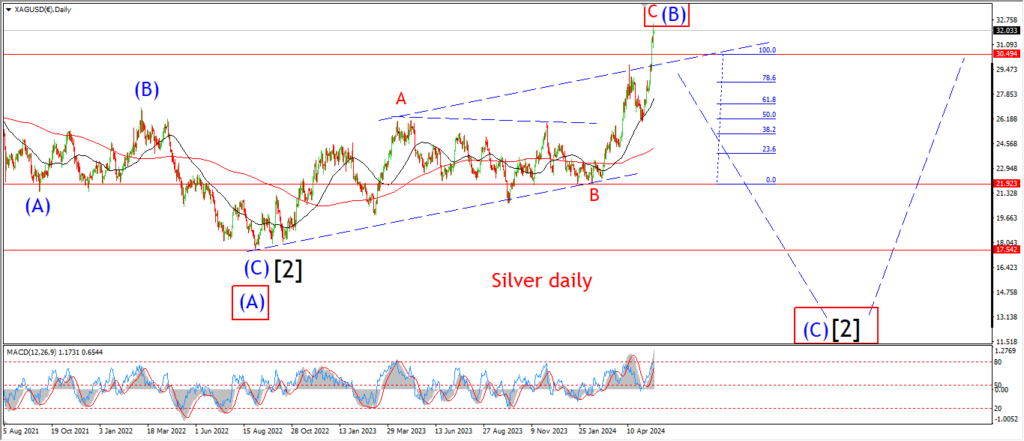
If the price continues lower tomorrow that will suggest wave [ii] is more progressed than I suspected.
BITCOIN
BITCOIN 1hr.
….
FTSE 100.
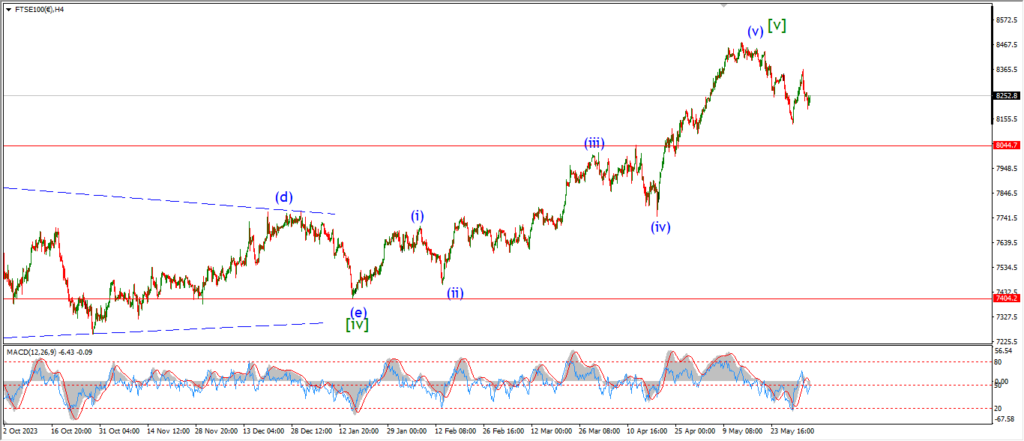
FTSE 100 1hr.
….
DAX.
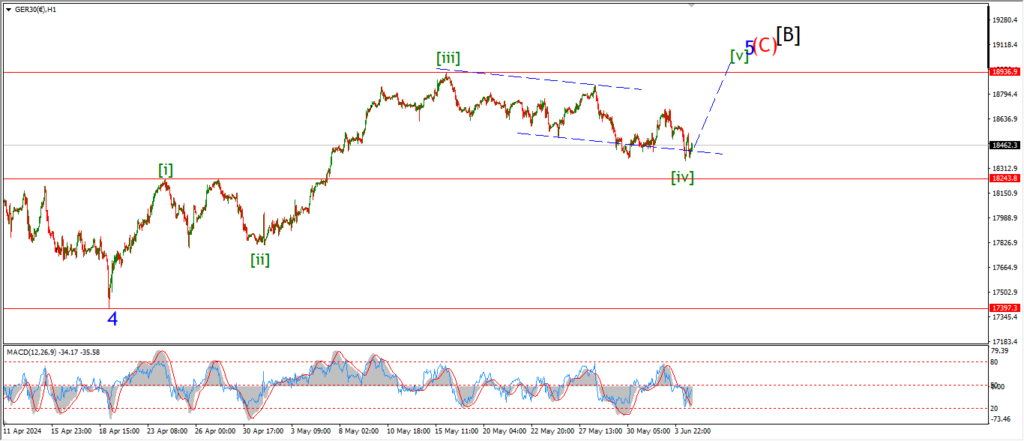
DAX 1hr
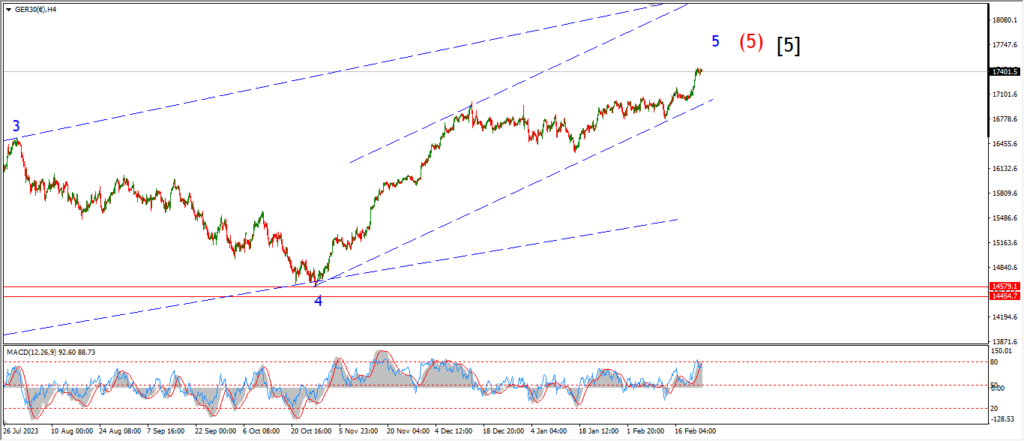
DAX 4hr
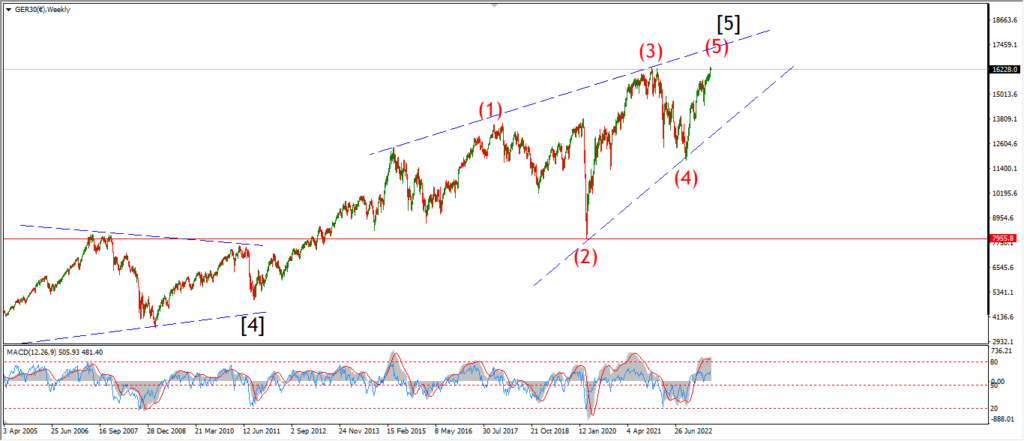
DAX daily.
….
NASDAQ 100.
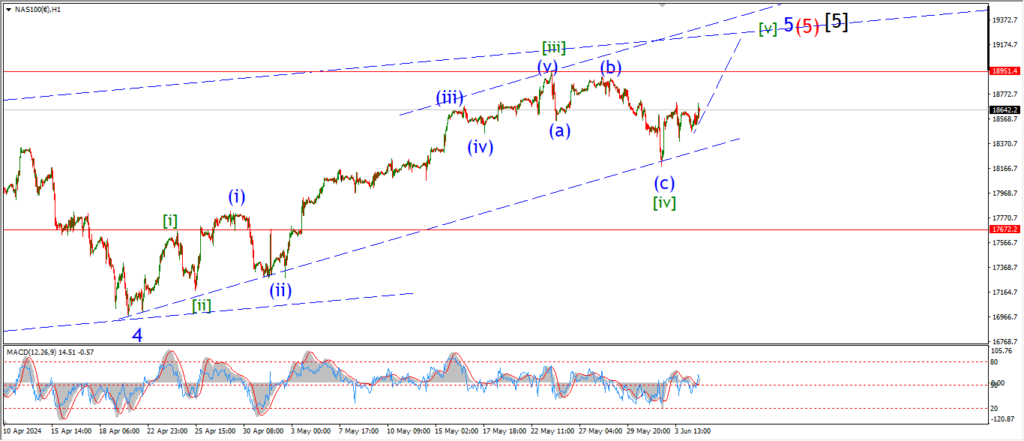
NASDAQ 1hr
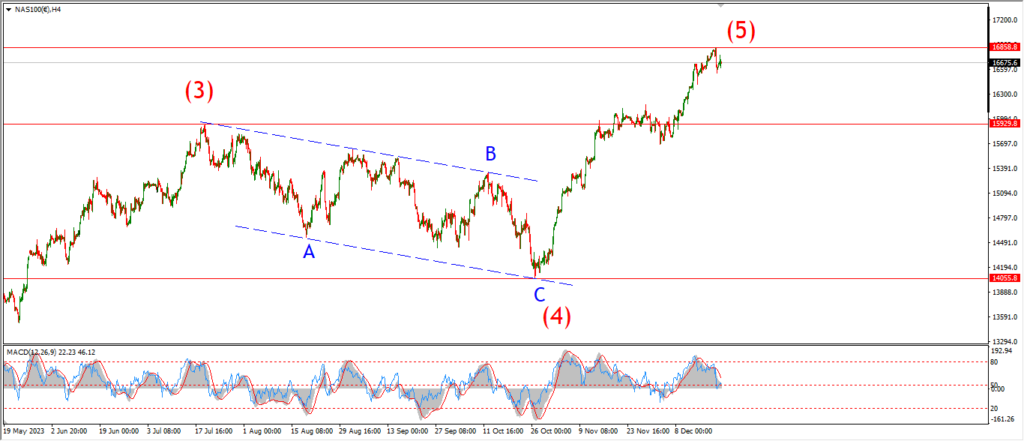
NASDAQ 4hr.
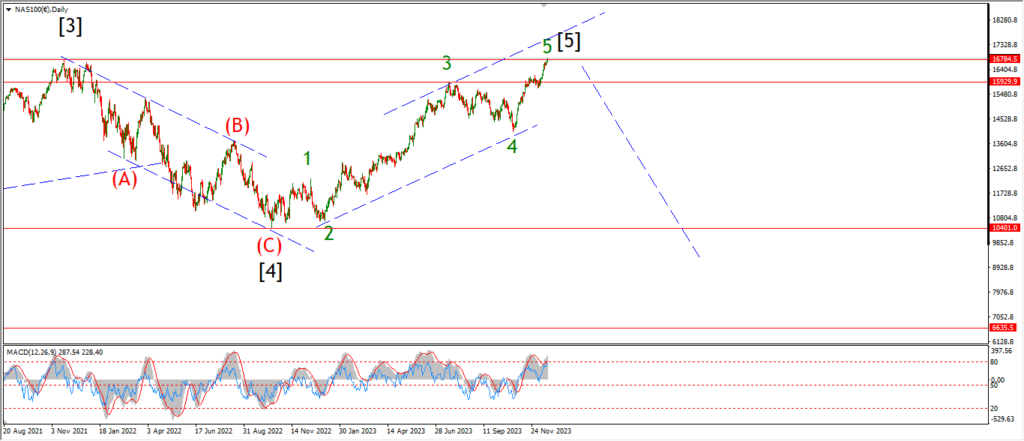
NASDAQ daily.
….
