
Good evening folks, the Lord’s Blessings to you all.
https://twitter.com/bullwavesreal
EURUSD.
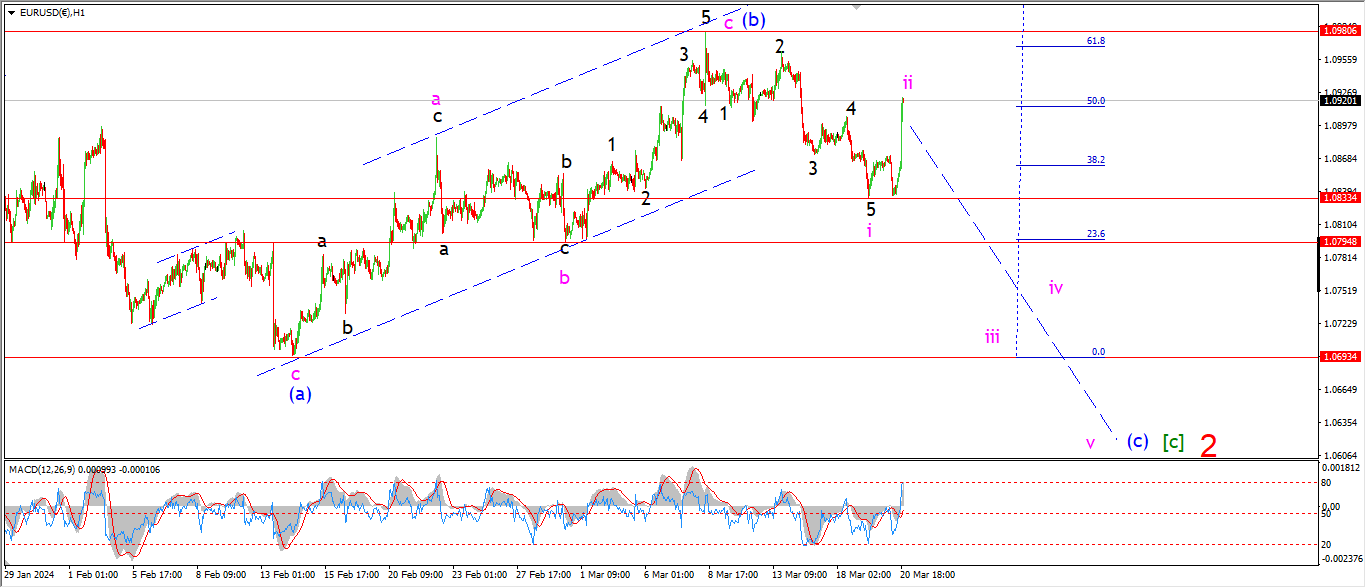
EURUSD 1hr.
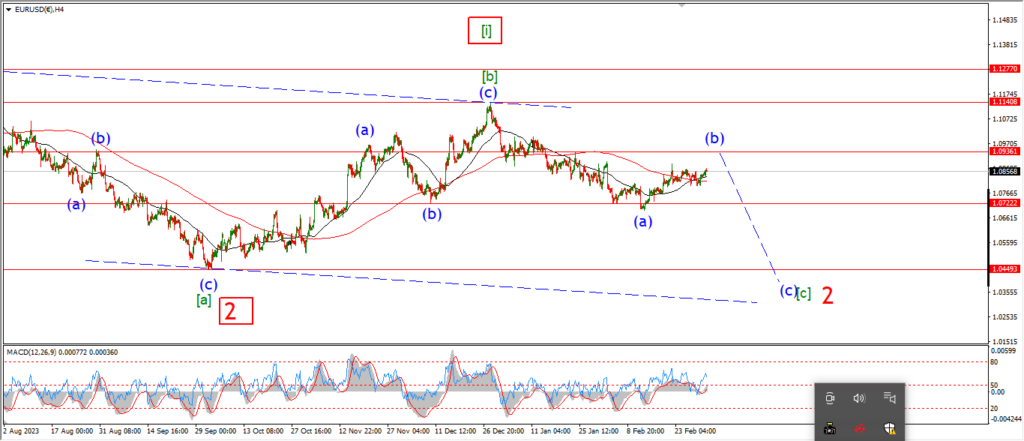
EURUSD 4hr.
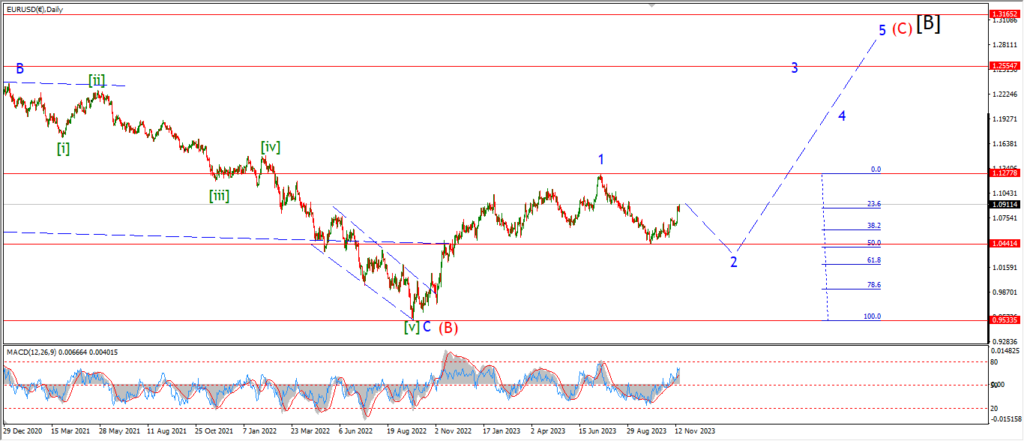
EURUSD daily.
I might be going out on a limb here,
but we now have a possible wave ‘i’ and ‘ii’ lower high in place for EURUSD.
The decline into wave ‘i’ is a little messy,
but,
if we see an early drop tomorrow morning,
that will signal wave ‘iii’ of (c) has begun.
Wave ‘iii’ will be confirmed with a break below 1.0795 at wave ‘b’.
Tomorrow;
The high at 1.0980 must hold.
Wave ‘iii’ of (c) is now set to begin.
A break of the wave ‘i’ low at 1.0833 will be the first signal that wave ‘iii’ is underway.
GBPUSD
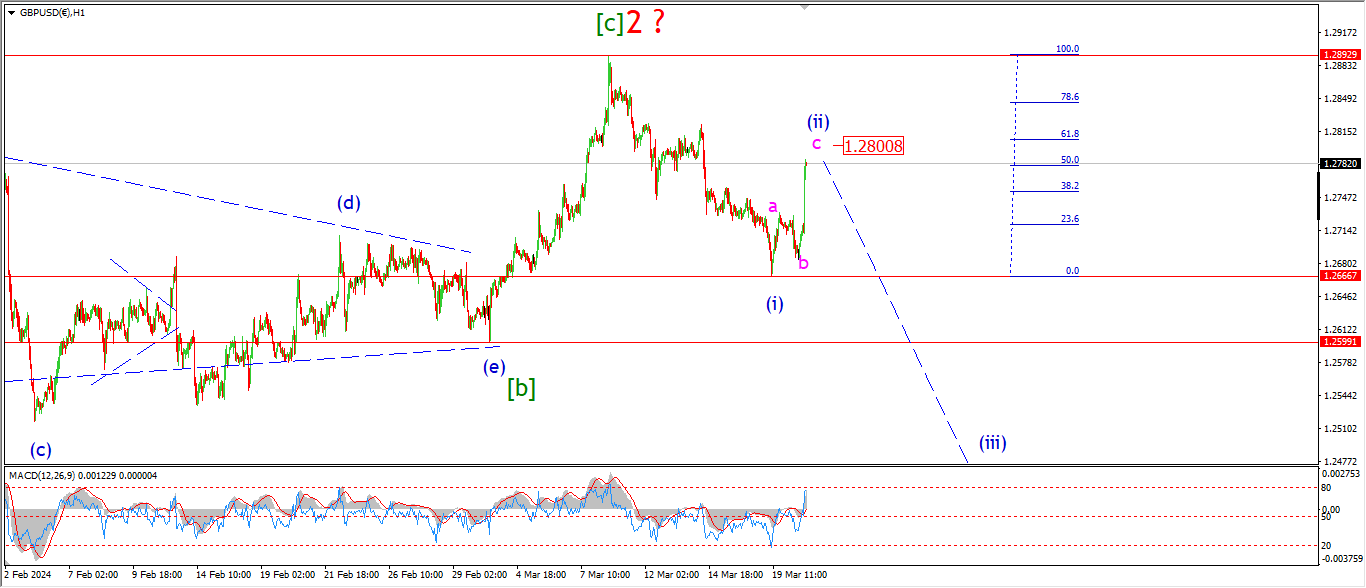
GBPUSD 1hr.
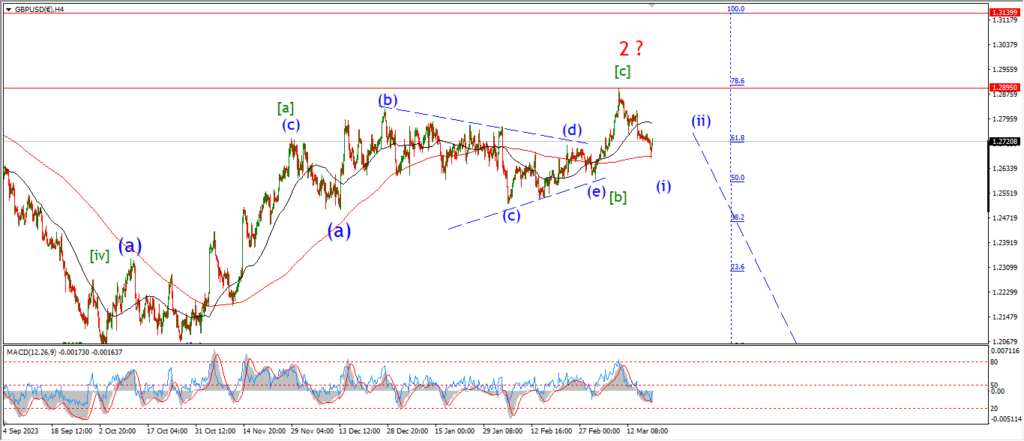
GBPUSD 4hr.
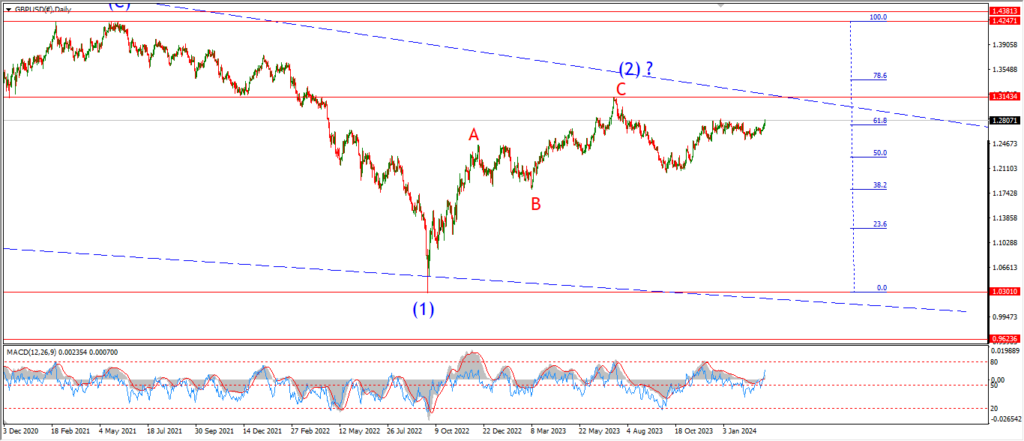
GBPUSD daily.
I am looking at three waves up in wave (ii) blue tonight also.
the price has reached towards the 1.2800 level now in wave ‘c’ of (ii).
That rally in wave ‘c’ has hit the 50% retracement level of wave (i).
So I am now looking for a top to form in wave (ii),
and the initial move lower into wave (iii) to begin tomorrow.
Tomorrow;
Watch for wave (ii) to complete a three wave corrective rally soon.
A break of the wave (i) low at 1.2666 will signal wave (iii) is underway.
USDJPY.
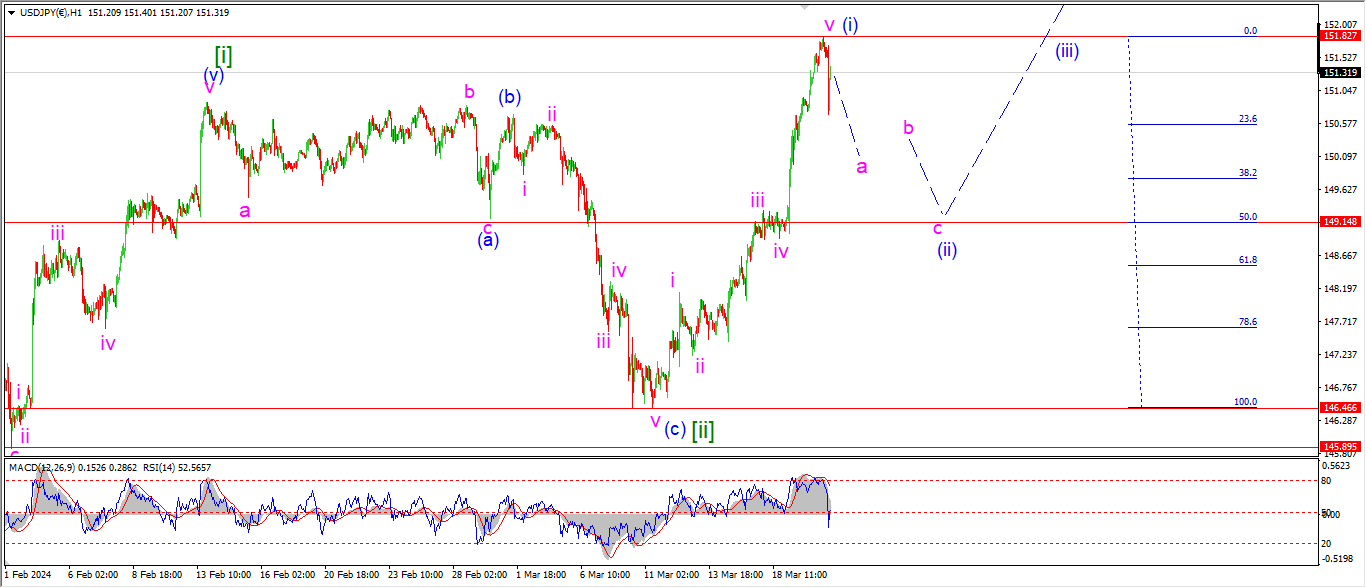
USDJPY 1hr.
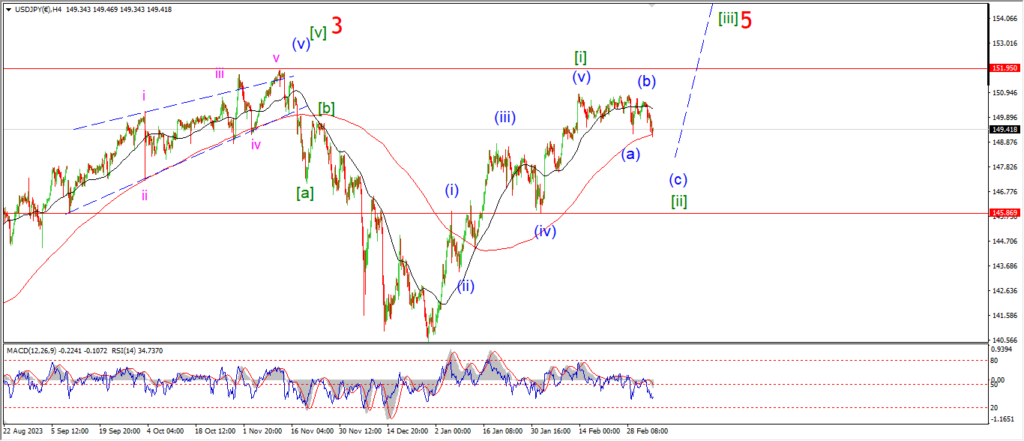
USDJPY 4hr.
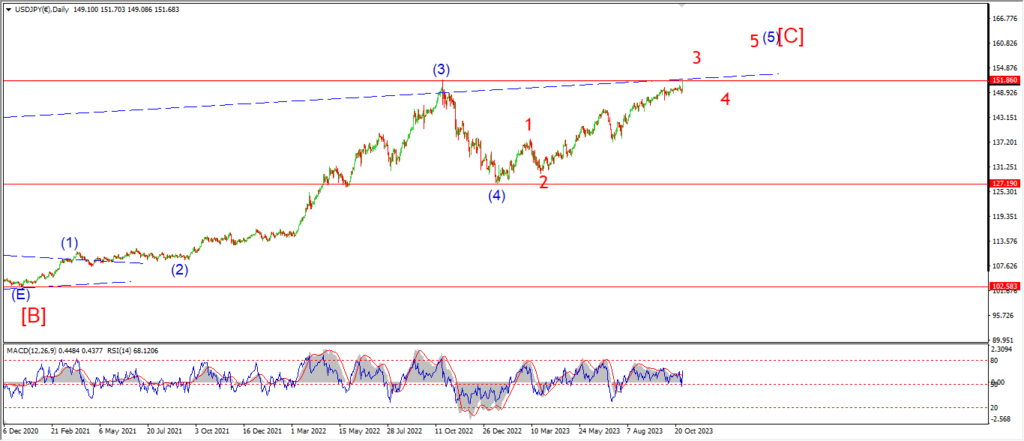
USDJPY daily.
After a sharp jump in price again today,
the rally into wave (i) of [iii] has now completely retraced the previous declines.
That should be enough to top out wave (i).
The price reacted to the previous highs with a reversal,
and now I am suggesting that wave ‘a’ of (ii) is underway.
A 50% retracement in wave (ii) will bring the price down to the 149.15 area again.
So lets see how this correction develops in the next few days.
Tomorrow;
Watch for wave ‘a’ to fall in three waves towards the 150.00 handle again.
DOW JONES.
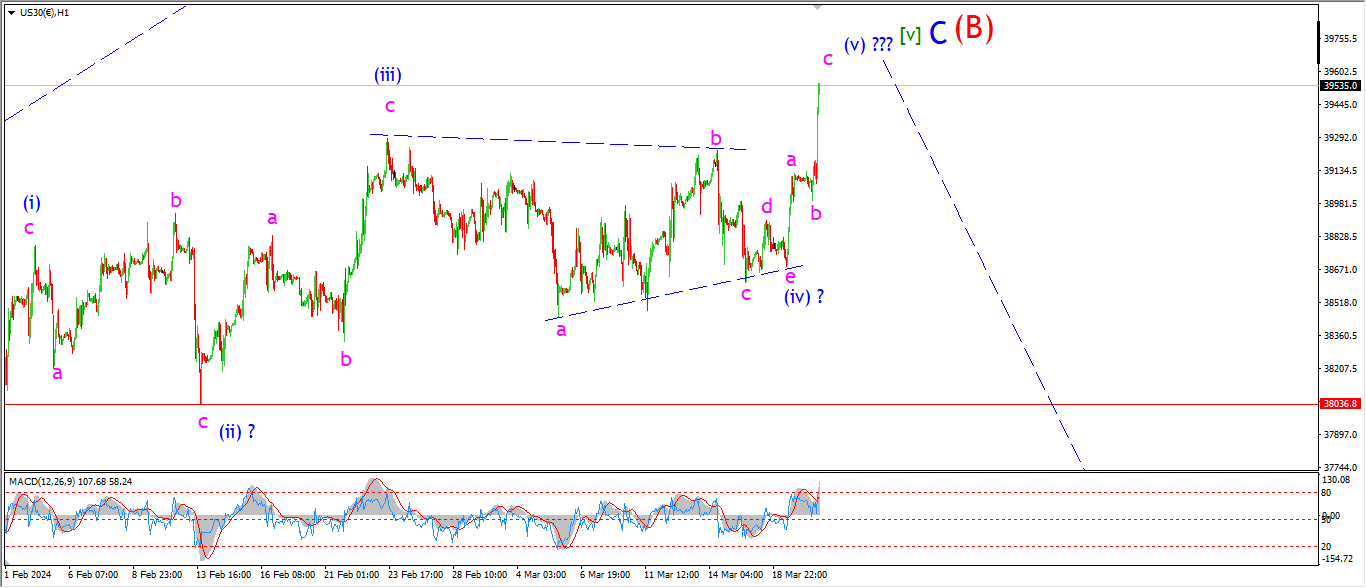
DOW 1hr.
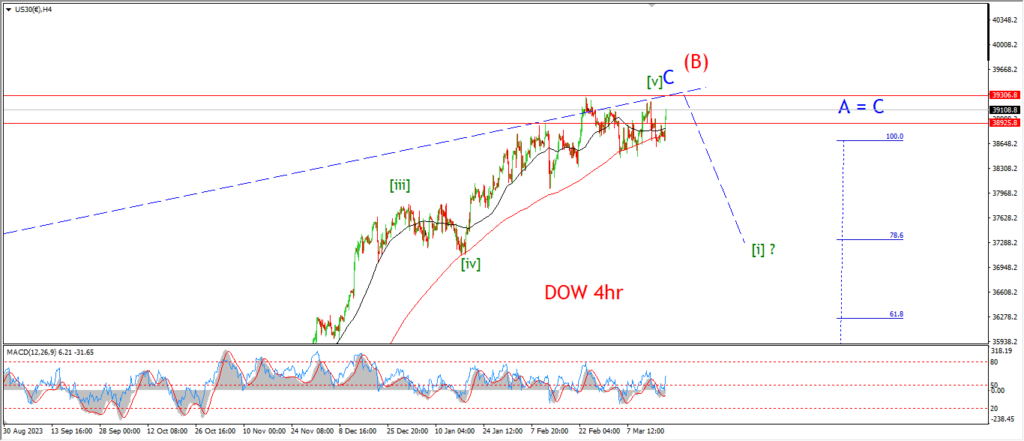
DOW 4hr
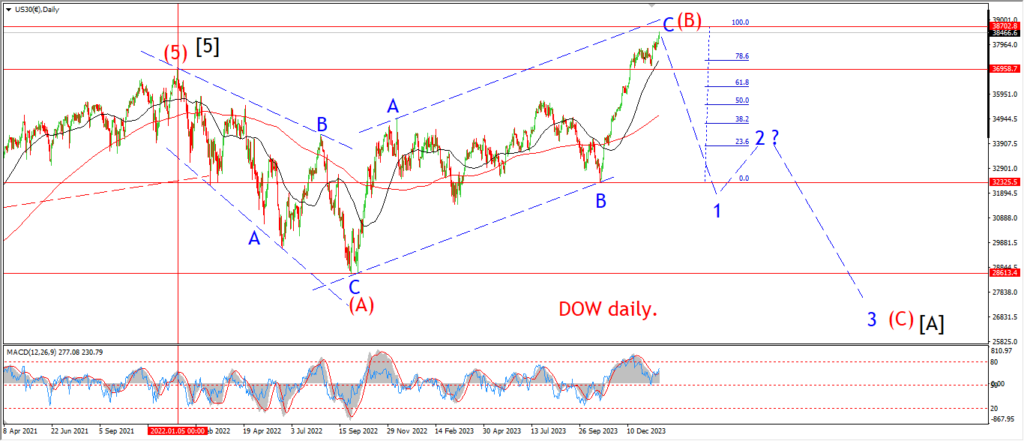
DOW daily.
I am looking at another possibility for wave [v] green again tonight.
the ending diagonal pattern is in play again.
But the sideways correction in wave (iv) is shown as a possible triangle.
The price has rallied out of the wave (iv) low in a three wave pattern so far and reached a new high.
And,
as things stand right now.
The pattern for wave [v] green is complete here.
Lets see if the market action over the next few sessions suggests a top is forming for wave [v] of ‘C’ here.
Tomorrow;
WAtch for wave ‘c’ of (v) to form a top and fall back again in an impulsive manner.
GOLD
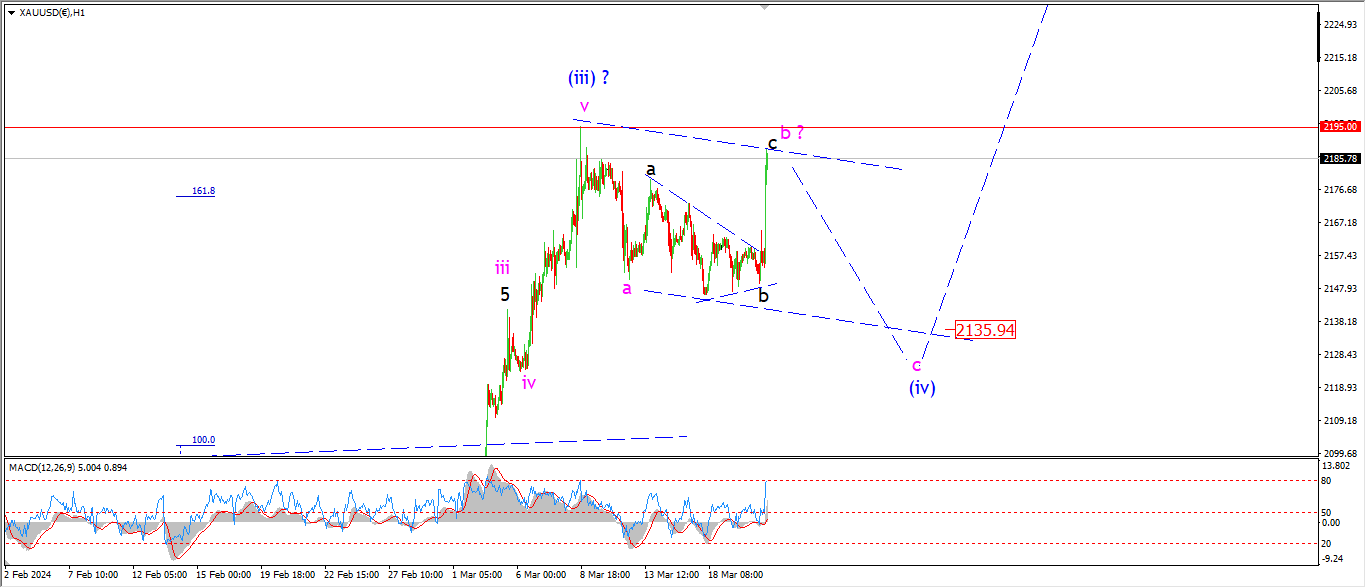
GOLD 1hr.
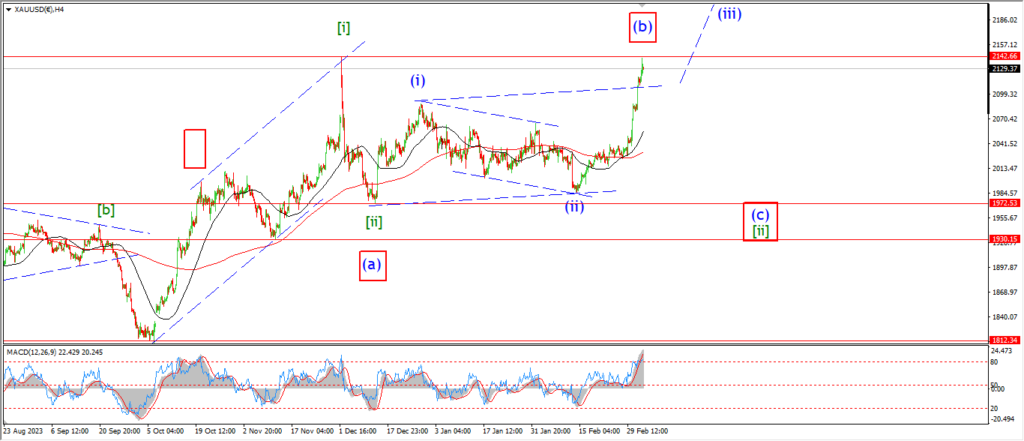
GOLD 4hr.
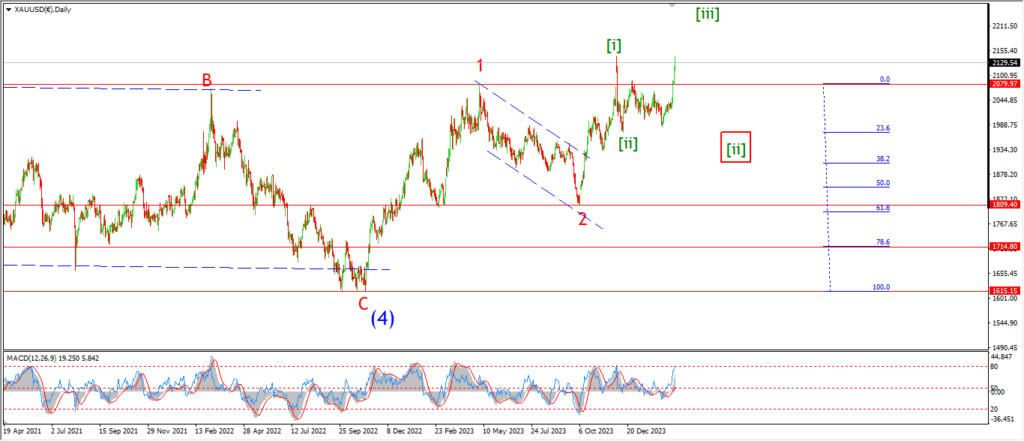
GOLD daily.
The knee jerk reaction in the markets today has forced a rethink in this pattern also.
I can see a three wave pattern off the top of wave (iii) which is labelled wave ‘a’ of (iv).
The market moved sideways from there overall.
But I think we can trace a three wave pattern higher in wave ‘b’ also.
Wave ‘b’ should be complete at todays highs.
and now we have a decline into wave ‘c’ left to come.
In this scenario,
wave (iv) is going to be shallower than I previously suggested.
But we should still see a drop into wave ‘c’ of (iv) in the coming days.
tomorrow;
Watch for wave ‘b’ to hold below the recent highs.
Wave ‘c’ will close out the trend channel at about 2135.
CRUDE OIL.
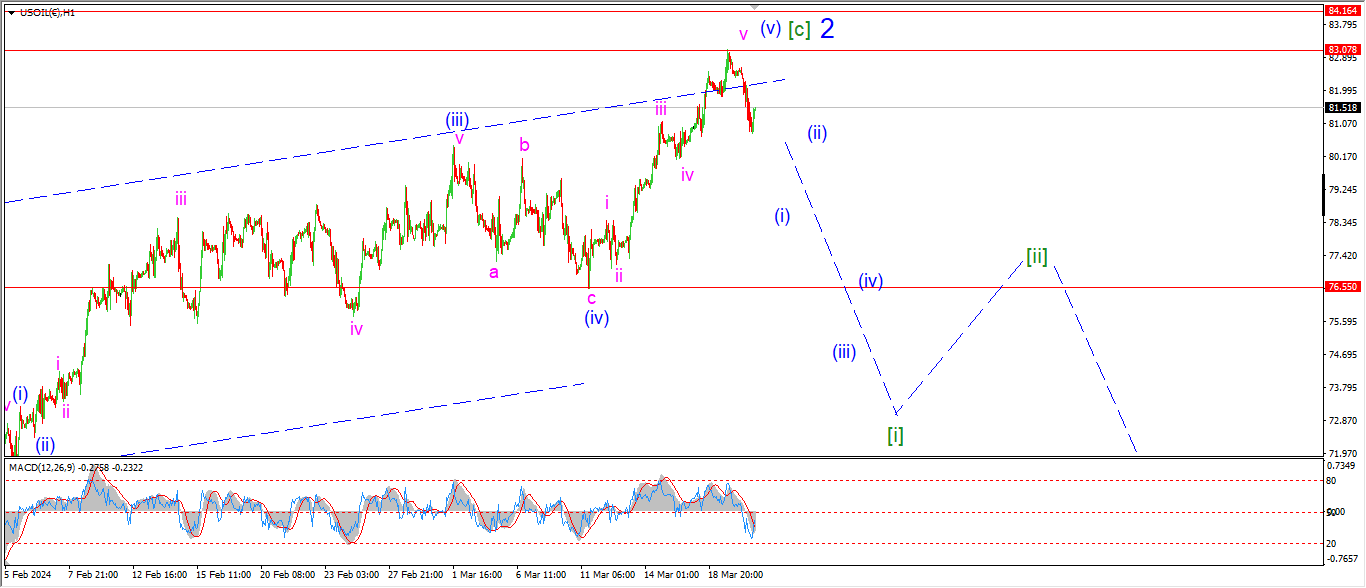
CRUDE OIL 1hr.
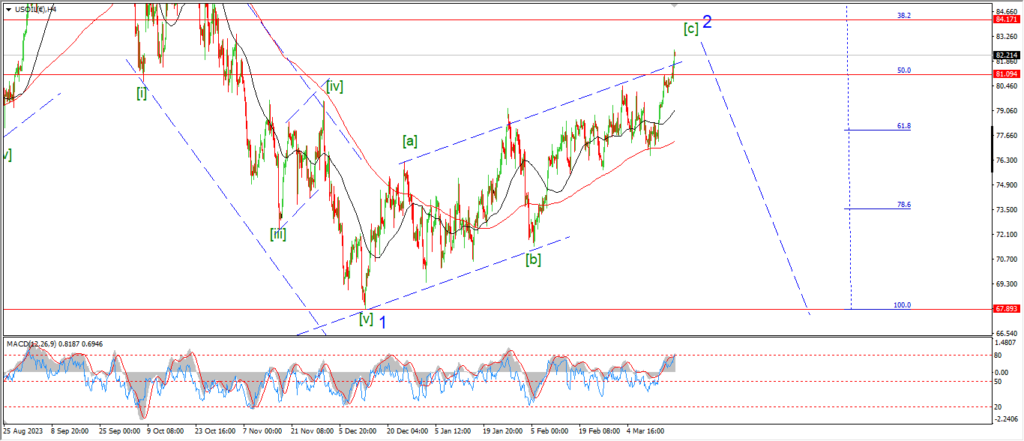
CRUDE OIL 4hr.
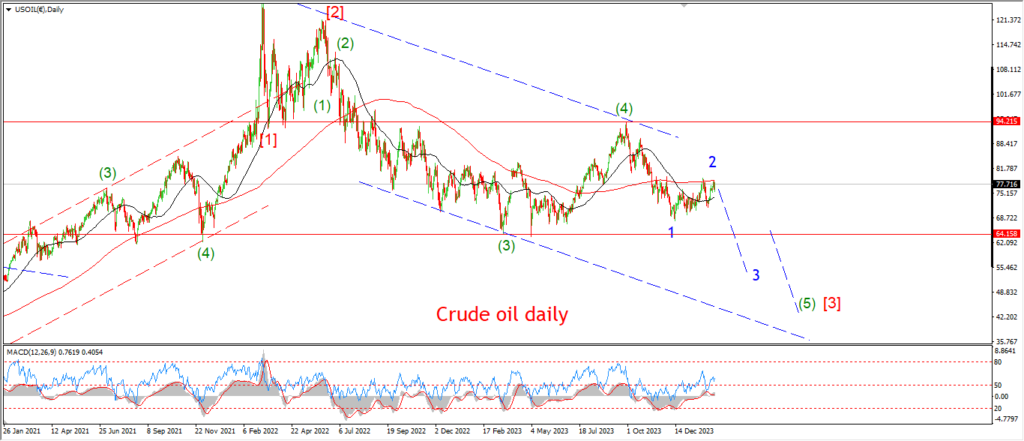
CRUDE OIL daily.
Crude oil seems like the only looser today!
The price has dropped back into the trend channel now after reaching a high at 83.00 today.
The rally in wave [c] has failed below the 62% retracement level of wave ‘1’ now,
this is a good place to form a top of a second wave.
Todays move is a hint at a topping pattern in wave ‘2’,
but has not confirmed the reversal into wave [i] of ‘3’ yet.
However I do think we are getting very close to that point now.
So its going to be an interesting few sessions ahead.
Tomorrow;
Lets see if that 83.00 top can hold in wave ‘2’ blue.
Wave [i] of ‘3’ is now the main focus from here on out.
A break below 76.50 again will confirm wave [i] is underway.
S&P 500.
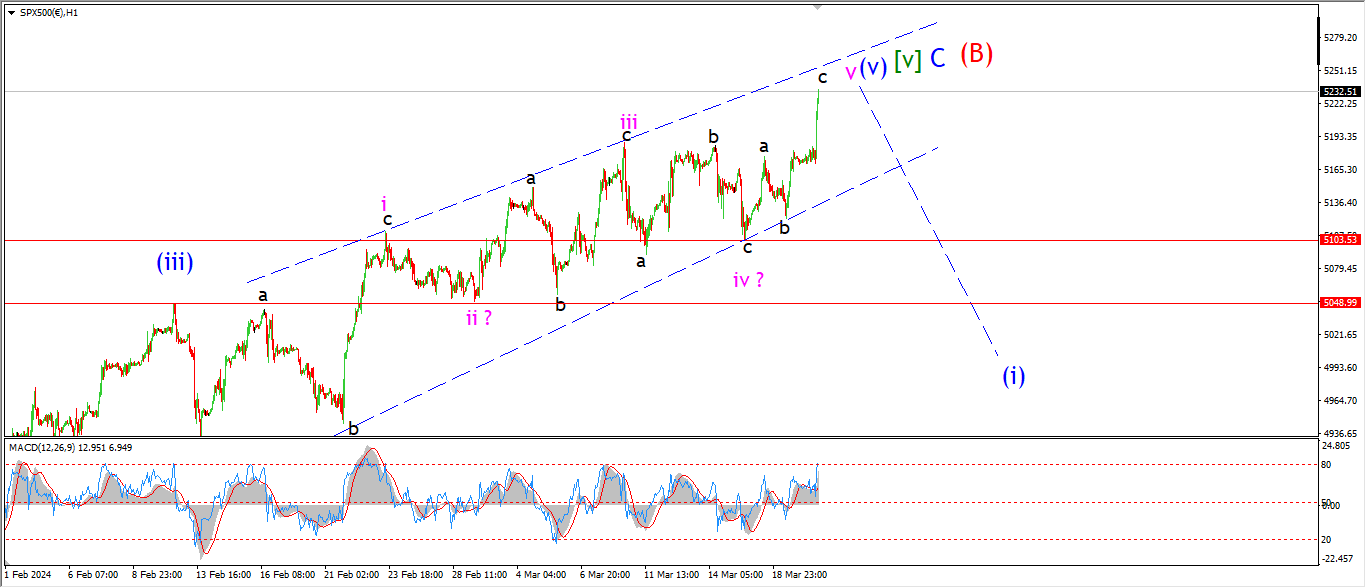
S&P 500 1hr
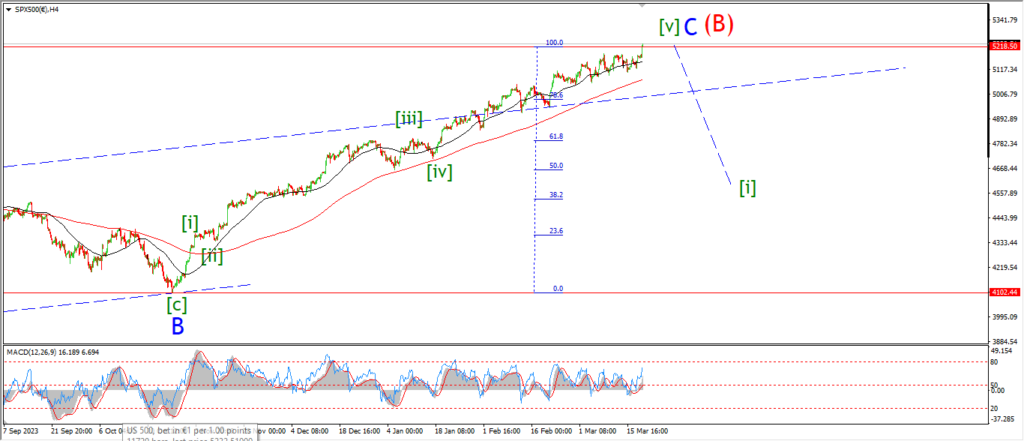
S&P 500 4hr
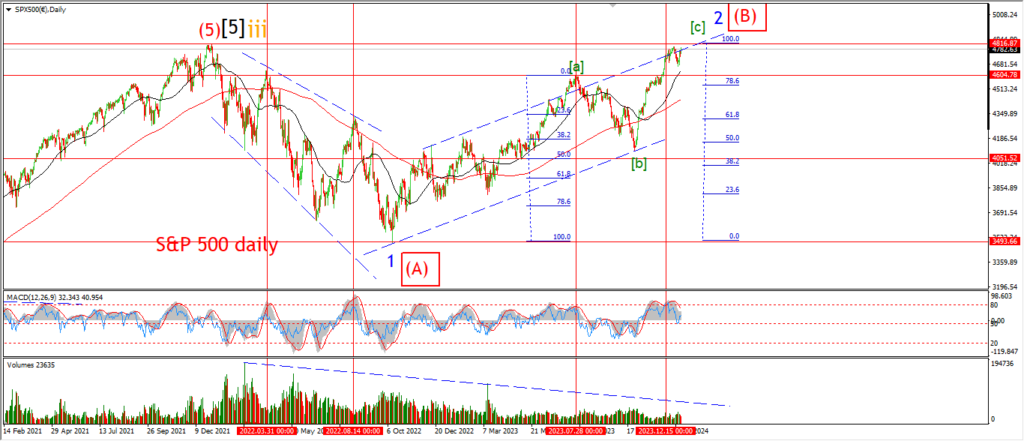
S&P 500 daily.
A new high today has brought us very close to topping out this pattern in wave (v) blue.
The rally is within the bounds of the ending diagonal pattern.
And the price range continues to hold in a nice wedge formation.
As it stands right now,
this pattern is pretty much done here.
So its going to be very interesting to see how the market reacts from this point on.
the action into this high has been very choppy in general,
and that has formed a few close support levels just below in wave ‘iv’ and ‘ii’.
I have shown wave (i) slicing down through those levels with relative ease.
Lets see if that is actually what happens.
On the 4hr chart you can now see that wave ‘C’ blue has reached equality with wave ‘A’ after a long battle.
The equality level lies at 5218.
That is another hint of a pattern that has reached its end.
Tomorrow;
WAtch for wave (v) blue to top out with a tag of that upper trend line.
If the market can drop out of the wedge again that will be a good first signal.
SILVER.
SILVER 1hr
SILVER 4hr.
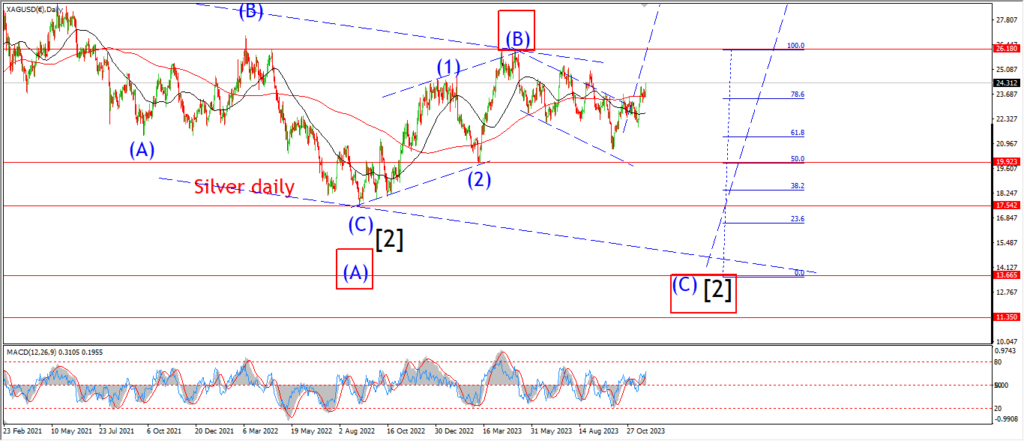
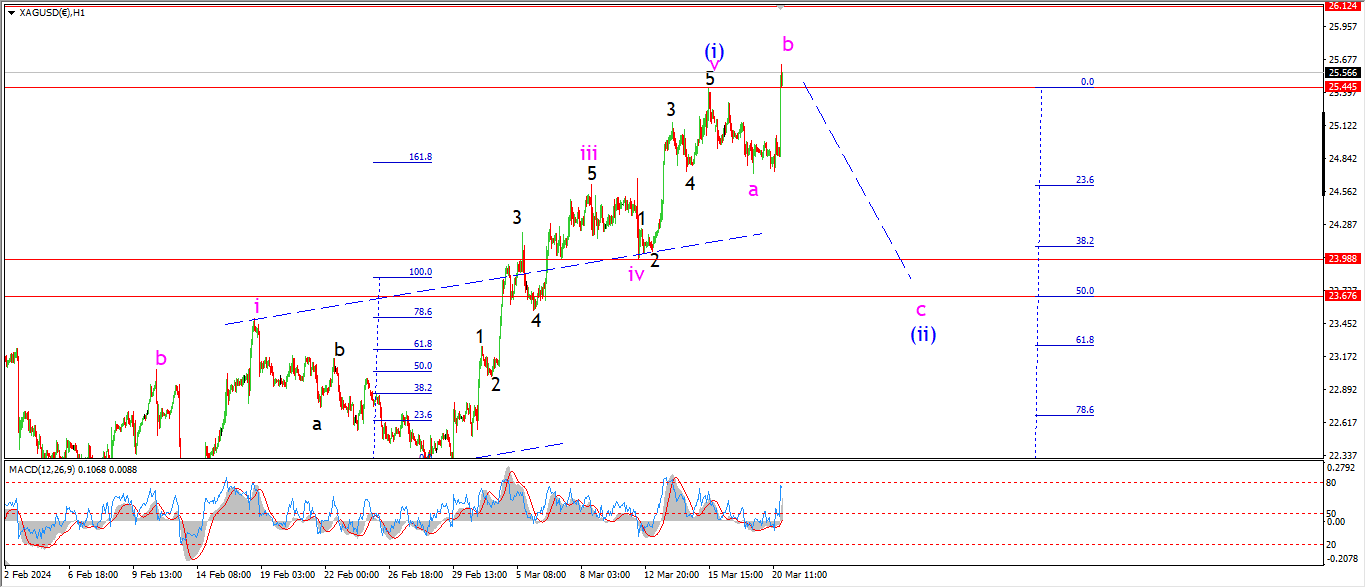
SILVER daily.
A new high this evening has forced me to move up the wave count for wave (ii).
I am looking at a possible expanded flat correction for wave (ii) now.
The new high tonight is labelled wave ‘b’ of (ii).
and a decline in wave ‘c’ should retrace back towards support at the previous fourth wave ‘iv’ at 23.98 again.
Tomorrow;
Wave ‘c’ must begin now and trace out five waves down towards that target area.
BITCOIN
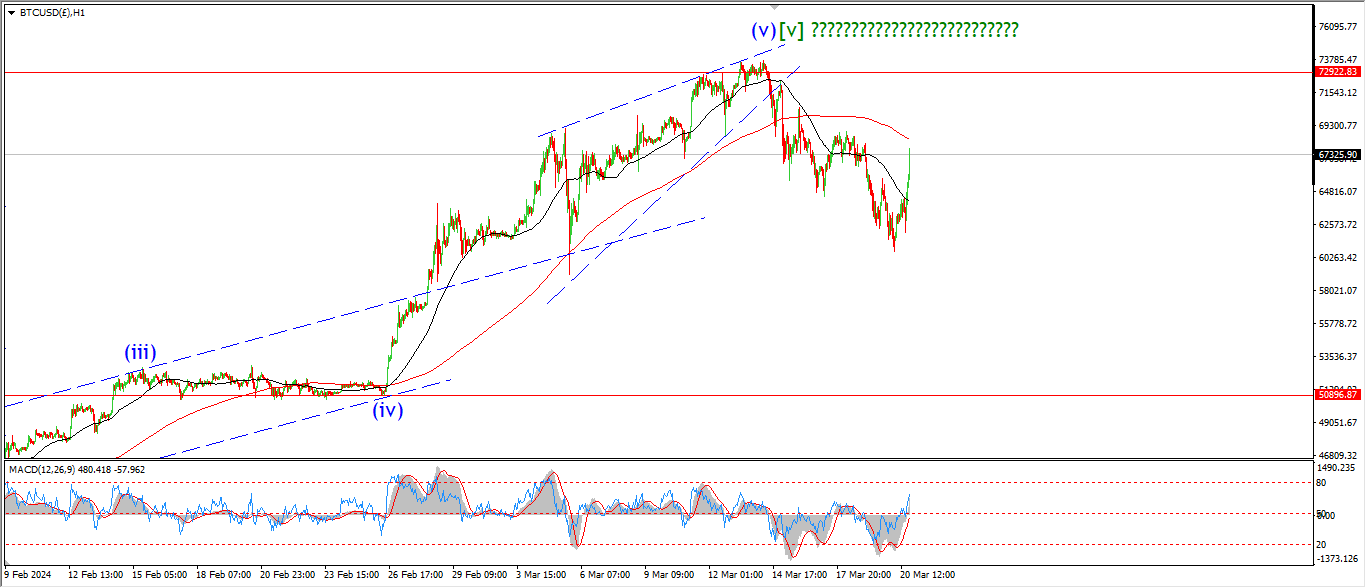
BITCOIN 1hr.
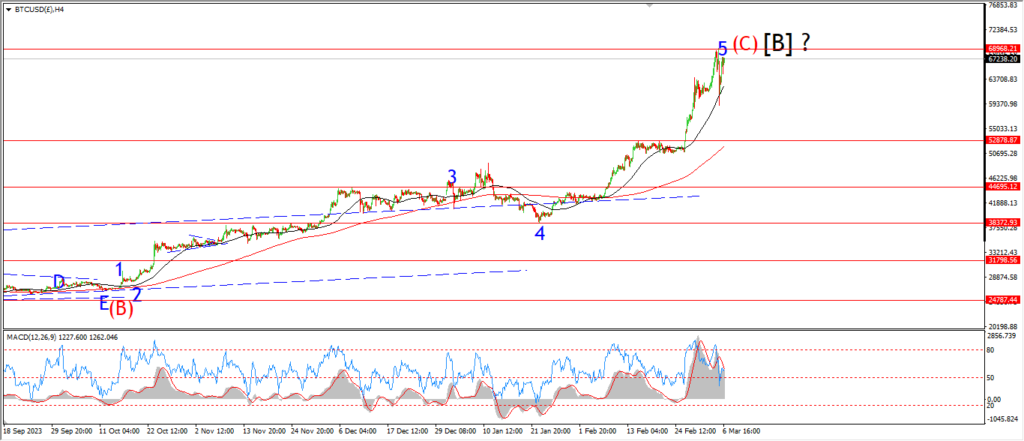
BITCOIN 4hr.
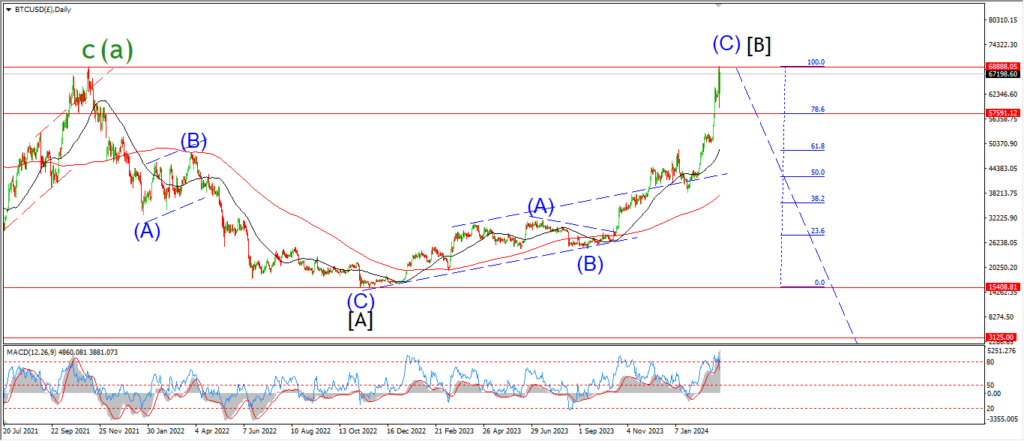
BITCOIN daily.
….
FTSE 100.
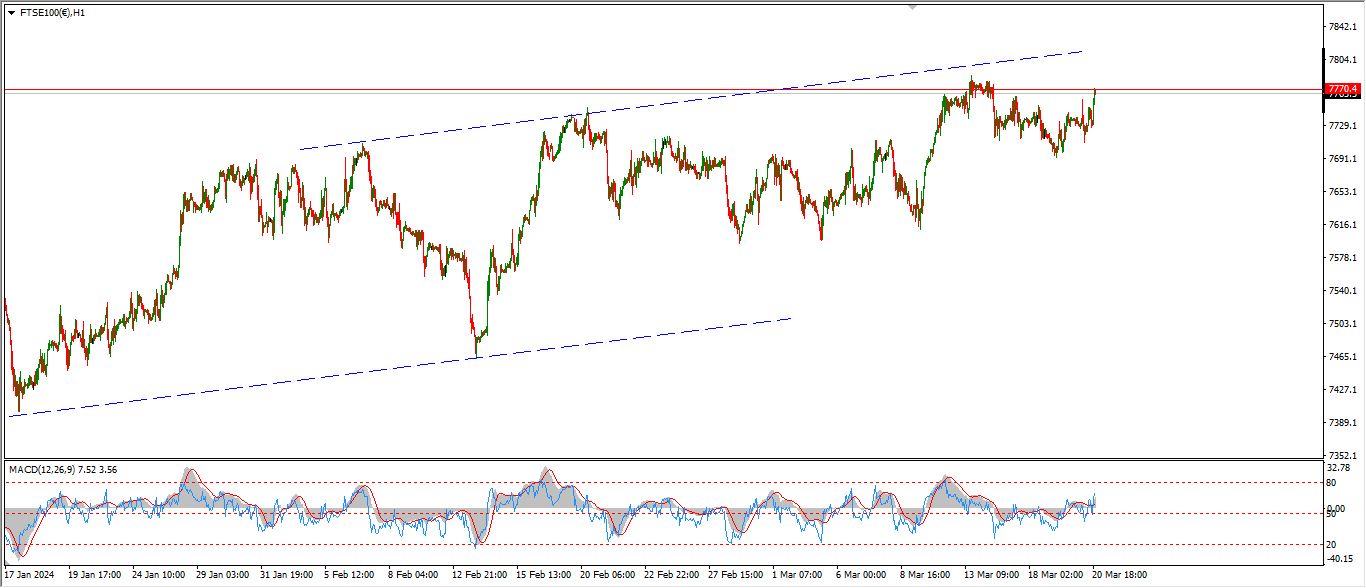
FTSE 100 1hr.

FTSE 100 4hr.

FTSE 100 daily.
….
DAX.
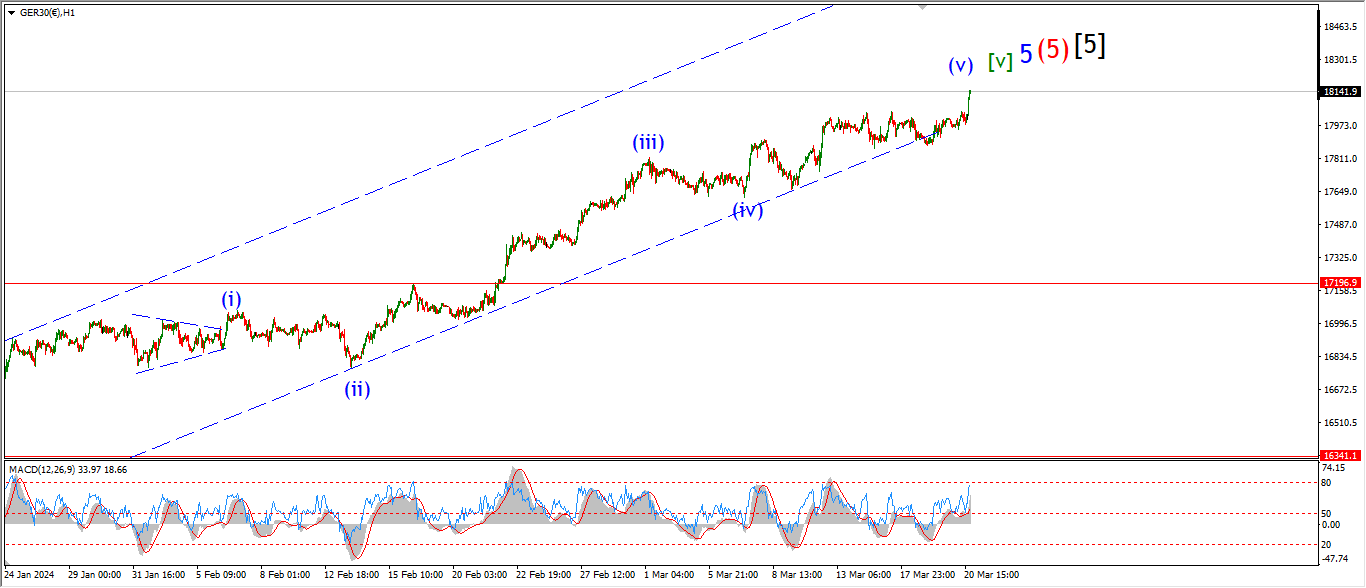
DAX 1hr
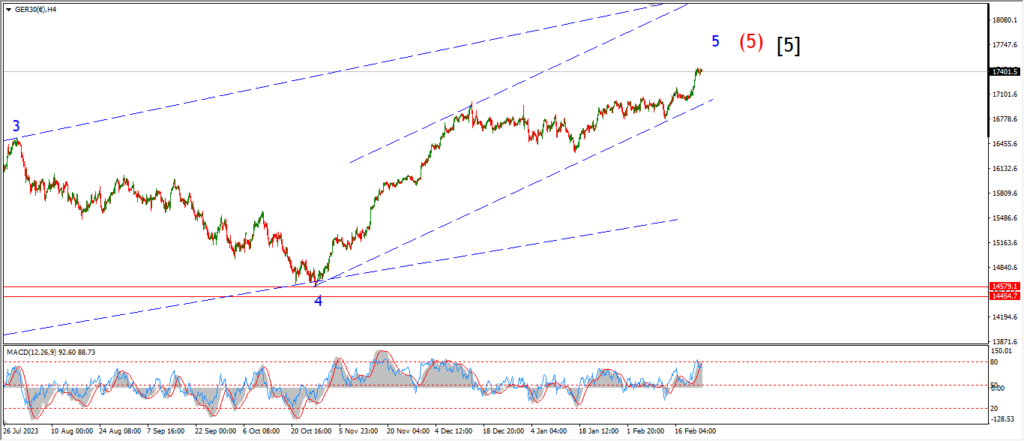
DAX 4hr

DAX daily.
….
NASDAQ 100.
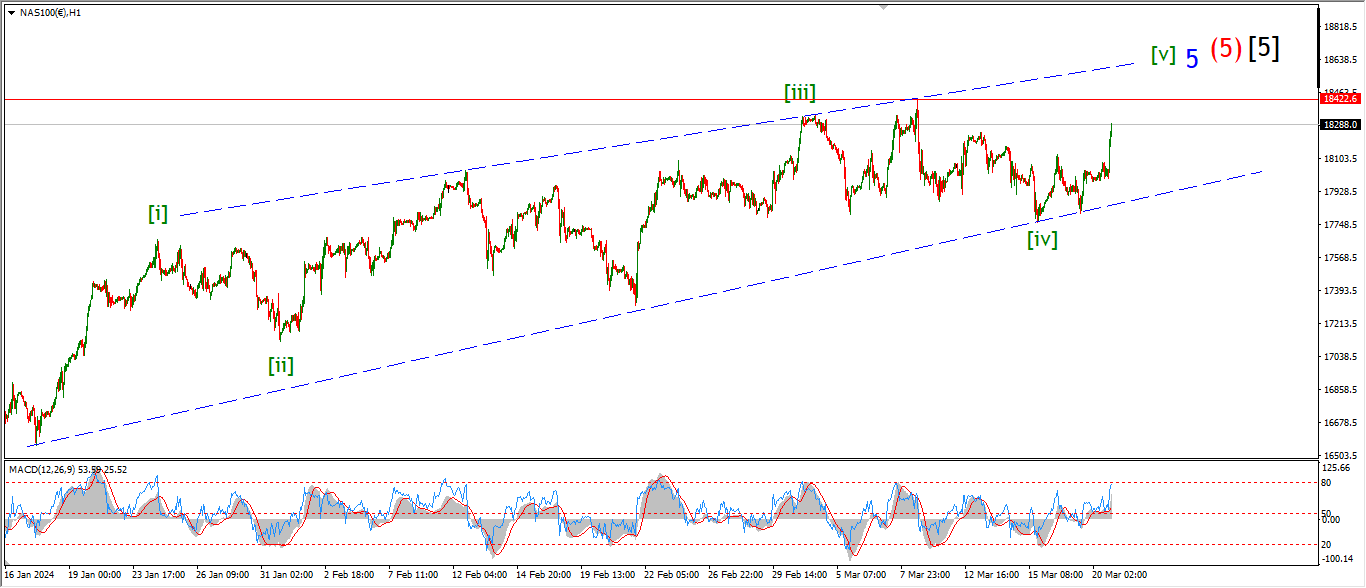
NASDAQ 1hr
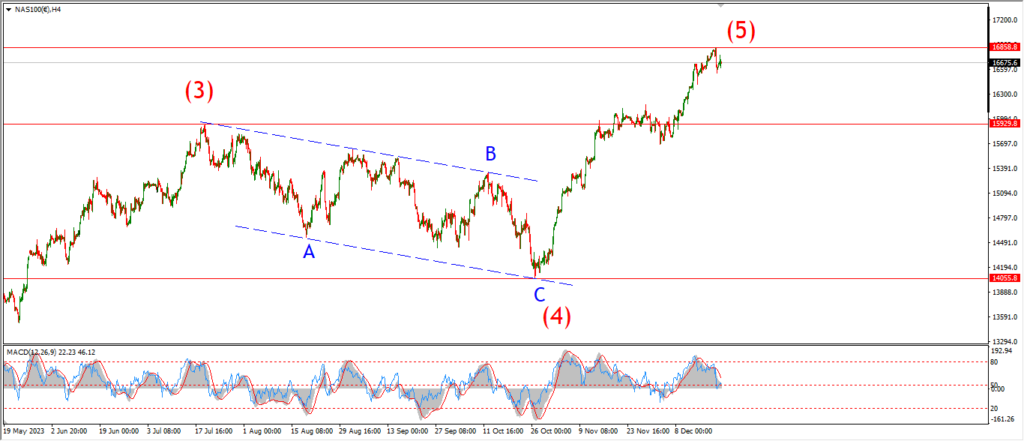
NASDAQ 4hr.
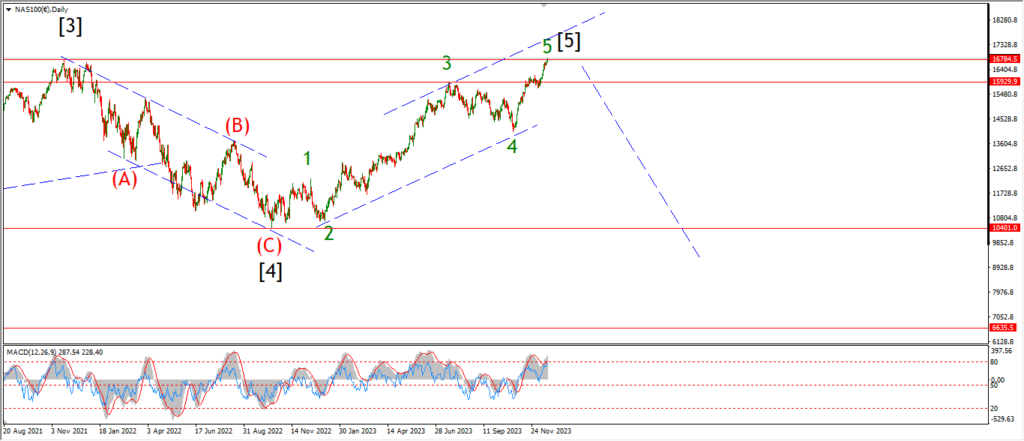
NASDAQ daily.
….