
Good evening folks, the Lord’s Blessings to you all.
My appetite for charts this week is quite high, so here is a sample of what the interesting ones I saw today.

This is incredible: Just about every time the Fed started CUTTING rates dating back to 1950, the unemployment rate has spiked.
Historically speaking, the first cut comes 3 months BEFORE the unemployment rate begins to spike, according to Reventure.
On average, the unemployment rate rises to ~7.5% in a Fed rate CUT cycle. Meanwhile, the Fed just said they don’t see unemployment rate rising higher than 4.1%. That’s just 0.4% above the current unemployment rate.
History says a “soft landing” is unlikely.


The US real estate office market continues to see massive value destruction… A building in the Bay area has been sold for $23 million, or a shocking 70%+ haircut to what the building last sold for The seller, AEW Capital Management paid $80 million for Downtown San Jose office tower in 2017

https://twitter.com/bullwavesreal
EURUSD.

EURUSD 1hr.

EURUSD 4hr.
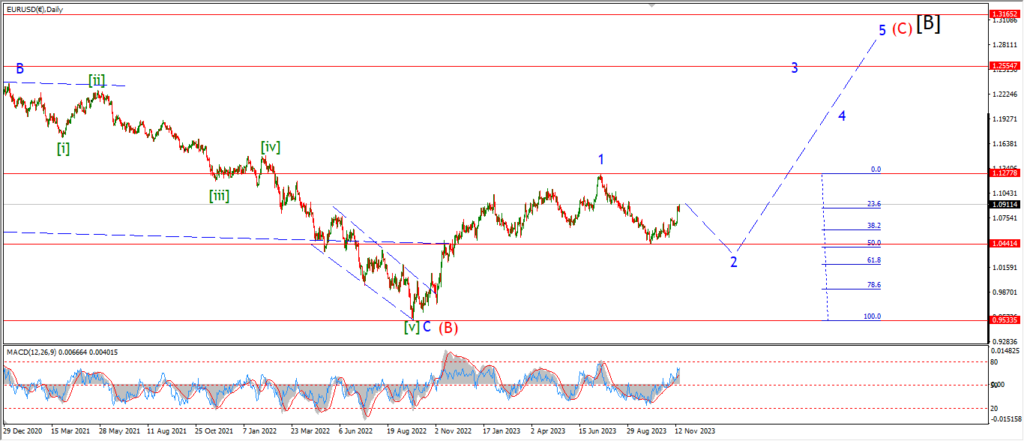
EURUSD daily.
Another burst higher today in EURUSD and the action forces a rethink of the larger pattern.
A rally in wave [b] is still the best fit pattern here.
But the internal pattern of wave [b] now looks like a complex flat correction.
The recent decline is shown as an expanded flat wave (b),
which completed with a five wave decline into wave ‘c’ of (b).
The renewed rally this week has not broken to a new high yet,
but I am suggesting the price is tracing out a five wave rally in wave (c) of [b] now.
Wave (c) of [b] has a new target at the 78.6 % retracement level of wave [a] at 1.11 flat.
And we should reach that level pretty quickly now.
Tomorrow;
Wave ‘iv’ of (c) should correct sideways tomorrow.
Watch for wave (c) of [b] to complete five waves up by monday evening.
This pattern should turn down again next week in wave [c] of ‘2’.
GBPUSD

GBPUSD 1hr.

GBPUSD 4hr.
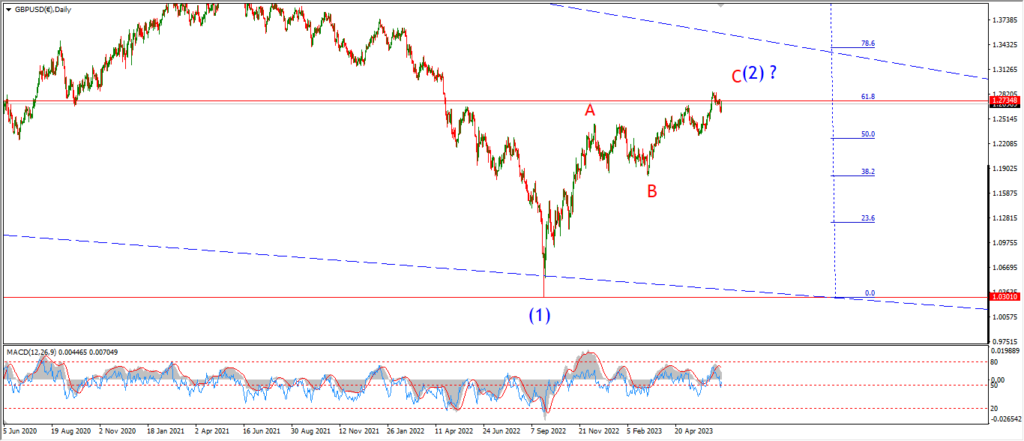
GBPUSD daily.
Cable broke out to a new high for the pattern today and that has invalidated last nights short term count.
The rally is wave [c] has now triggered the alternate count.
This weeks low takes the wave (iv) label.
And wave (v) of [c] has now broken to a new high for the pattern.
Tomorrow;
Watch for wave (v) of [c] to complete soon after tracing out five waves up.
The 78.6% retracement of wave ‘1’ lies at 1.2905.
That is the next likely target level for wave [c] to complete.
USDJPY.

USDJPY 1hr.

USDJPY 4hr.
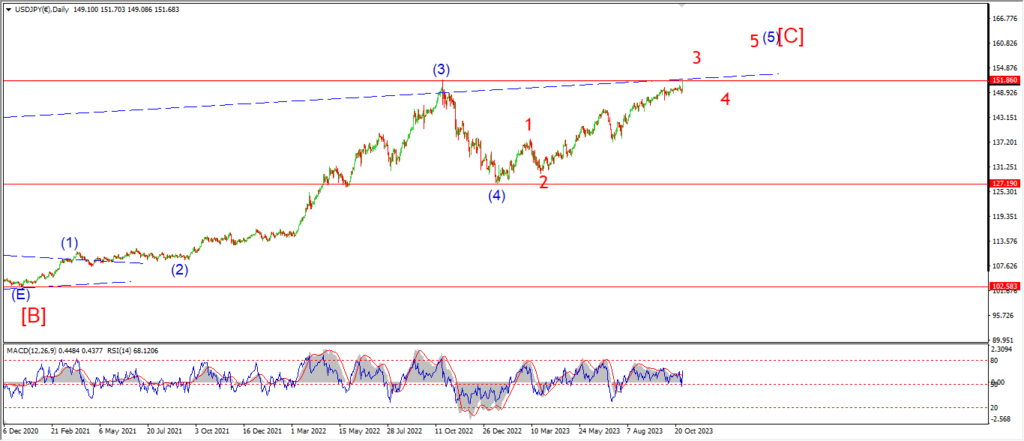
USDJPY daily.
I have switched to the alternate count again tonight in USDJPY.
This weeks decline was viewed as wave (b) of [b].
But the fact that we have broken to a new low suggests that wave [b] is already complete at 146.62.
And wave [c] of ‘4’ should fall in five waves to complete a flat correction.
Wave [c] of ‘4’ will reach equality with wave [a] at 136.31,
so there is a reasonable possibility of a sustained decline over the coming few weeks.
Tomorrow;
Watch for wave (i) and (ii) to complete that lower high and then wave (iii) of [c] is expected to continue lower next week.
DOW JONES.

DOW 1hr.

DOW 4hr

DOW daily.

The Dow has found rest today at the upper trend channel of wave ‘C’.
This is an Elliott channel rather than a standard channel so the conclusion you come to depends on how you wish to read this action here.
There is room above for this rally to extend if we use a normal channel,
but for the moment,
the price has filled this channel and I do believe we have come far enough in wave ‘C’ of (B) to look for some reaction lower again.
You might think I would throw out all the previous signal that the market has given us now that we have a new all time high.
But I might suggest that a new all time high simply shows us how disconnected the market is from reality here,
and reality always wins.
A wave (B) top might describe this new high perfectly to be honest.
A typical wave (B), just like a second wave,
comes along with an even larger extreme in sentiment than the previous top or bottom.
I think we can say that is a goo representation of the current mood here.
Reckless abandon is the name of the game in the stock market.
The options market backs up that view,
with the biggest OPEX of all time tomorrow.
I do wonder if the market will be able to keep up this levitation when tomorrows hope evaporates.
Tomorrow;
Lets see what the options expiry brings us.
All bets are off when we head into next week now,
so there will be much more freedom in how the market moves.
The momentum picture is showing a glaring extreme on the bullish side,
so next week may well turn the corner.
GOLD

GOLD 1hr.

GOLD 4hr.

GOLD daily.
I want to talk about the alternate count on the short term chart first.
This count is at a very interesting point right now.
And it is basically a flip side view of the main count for wave [c] of ‘2’.
There is a series of 1,2, waves now in place.
And if the alternate count is correct here,
then next week will bring an acceleration higher into wave ‘iii’ of (iii) of [iii].
This is one to watch.
If the recent low is broken at 1972 then the bullish count will be invalidated.
Tomorrow;
As for the main count,
watch for wave ‘i’ and ‘ii’ to drop back off this higher to signal wave (iii) is underway.
A break of 1972 again will confirm wave (iii) of [c] is underway.
CRUDE OIL.

CRUDE OIL 1hr.

CRUDE OIL 4hr.
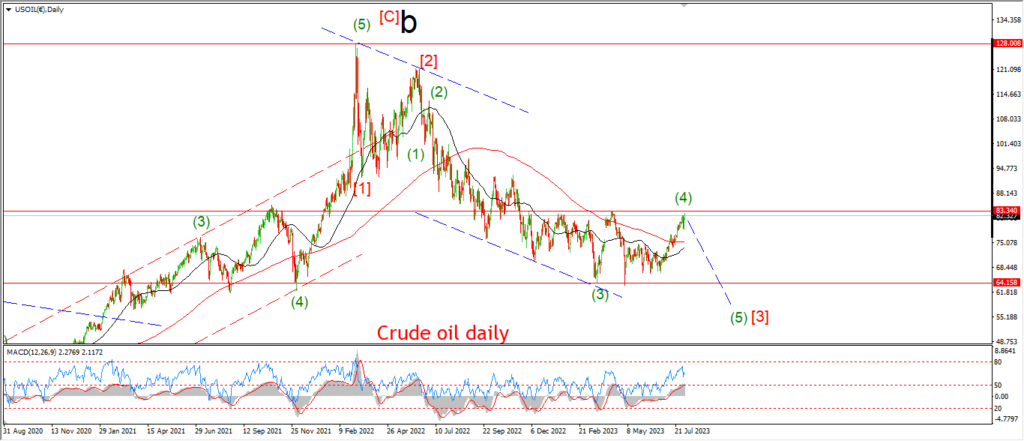
CRUDE OIL daily.
Crude oil broke above the signal level at the previous wave ‘iv’ high today.
And that move signals wave (a) is now underway.
Wave (a) is expected to trace out five waves up as shown.
And the price is now falling in wave ‘iv’ of (a),
with wave ‘v’ of (a) left to make a new high above 72.68 possibly tomorrow.
Wave (a) can complete this week,
and then wave (b) should turn lower early next week.
Tomorrow;
Watch for wave (a) to complete five waves up as shown with a break above 72.68 again.
S&P 500.

S&P 500 1hr

S&P 500 4hr
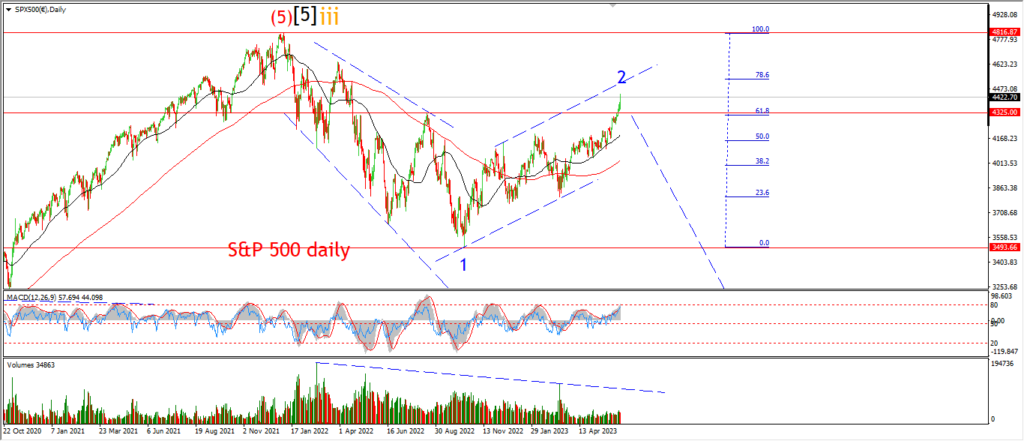
S&P 500 daily.
The current pattern in wave [c] of ‘2’ has an extension now in place in the wave count.
Wave [c] has a five wave pattern now complete with the current highs now holding above 50% of wave [a] in terms of length.
Where wave [a] green was already an extended rally.
Wave (v) of [c] has hit the 62% level of wave (i) of [c],
Where wave (i) of [c] was already an extended rally.
And wave ‘v’ of (v) has a clear extension within the pattern also.
I know the DOW has made a new all time high,
but that does not mean a new high in the S&P is inevitable.
Given the already extended pattern,
and the wild extreme in momentum on the daily and 4hr charts,
I can hold out some hope of this pattern for wave ‘2’ continuing to be valid.
Tomorrow;
Watch for this rally in wave (v) or [c] to finally run out of steam and for the initial snap decline to begin into wave (i) down.
SILVER.

SILVER 1hr

SILVER 4hr.
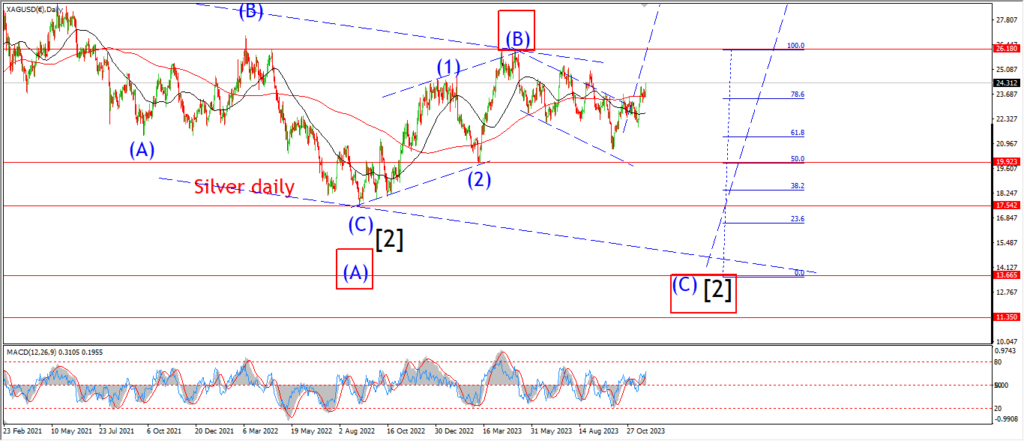
SILVER daily.
I think silver is in a very interesting place in its pattern here also.
The bullish potential for this pattern is clear.
And if wave ‘iii’ of (iii) takes over next week,
then we could be in for a breathtaking rally as long as the pattern holds up.
I cant rule out the alternate count at this point yet.
A break of 21.87 again will trigger this alternate count.
Tomorrow;
Watch for wave ‘2’ to create a higher low above 22.50 over the coming days.
As long as that level holds at wave ‘ii’,
then we can remain bullish here.
BITCOIN

BITCOIN 1hr.
BITCOIN 4hr.
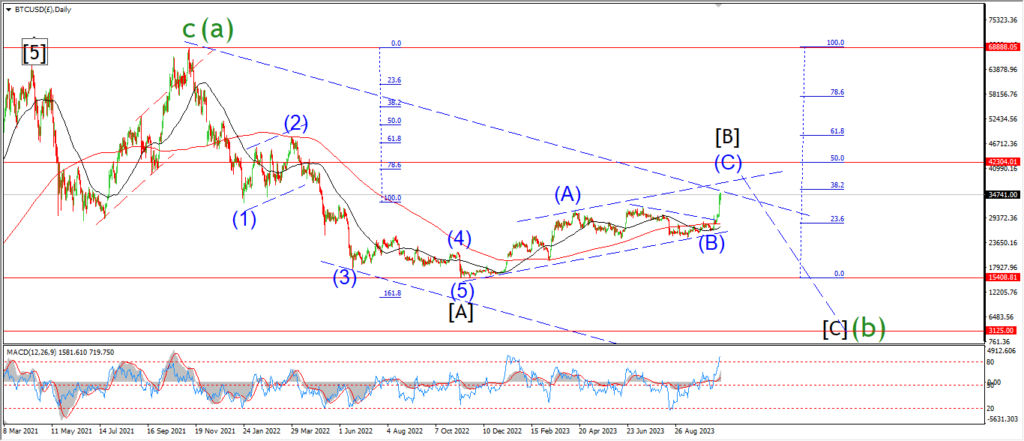
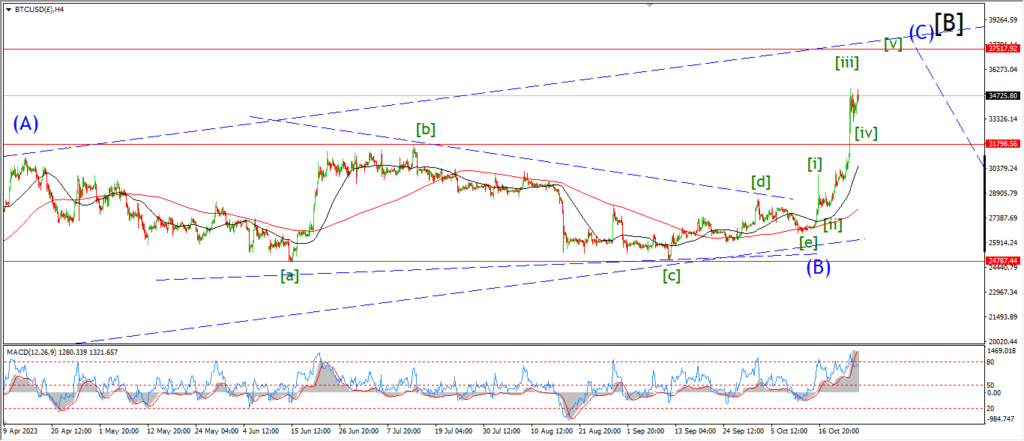
BITCOIN daily.
….
FTSE 100.

FTSE 100 1hr.
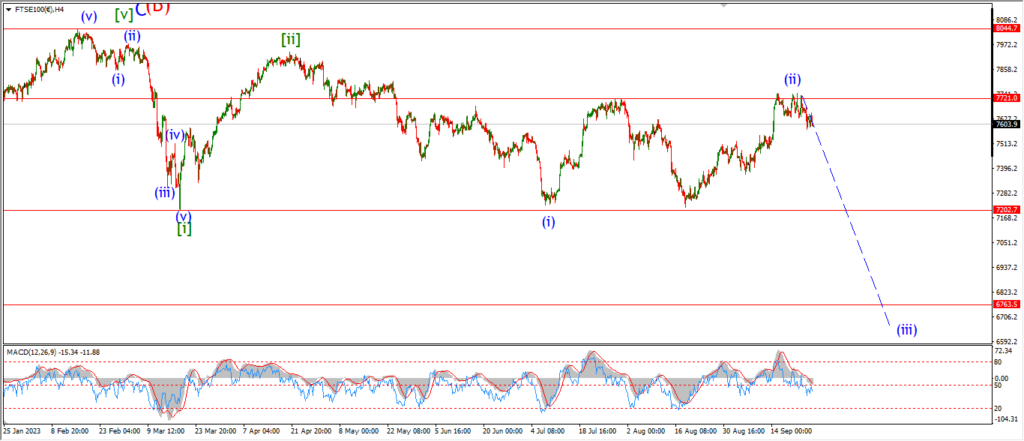
FTSE 100 4hr.

FTSE 100 daily.
….
DAX.

DAX 1hr
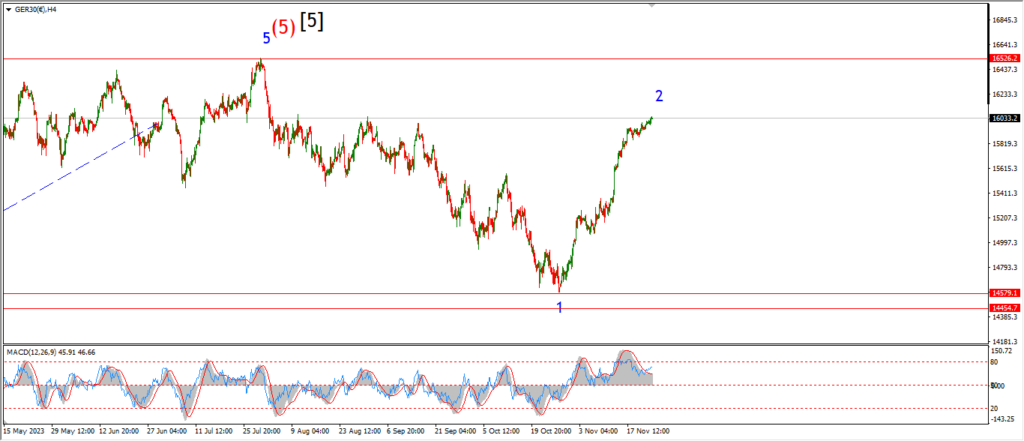
DAX 4hr

DAX daily.
….
NASDAQ 100.

NASDAQ 1hr
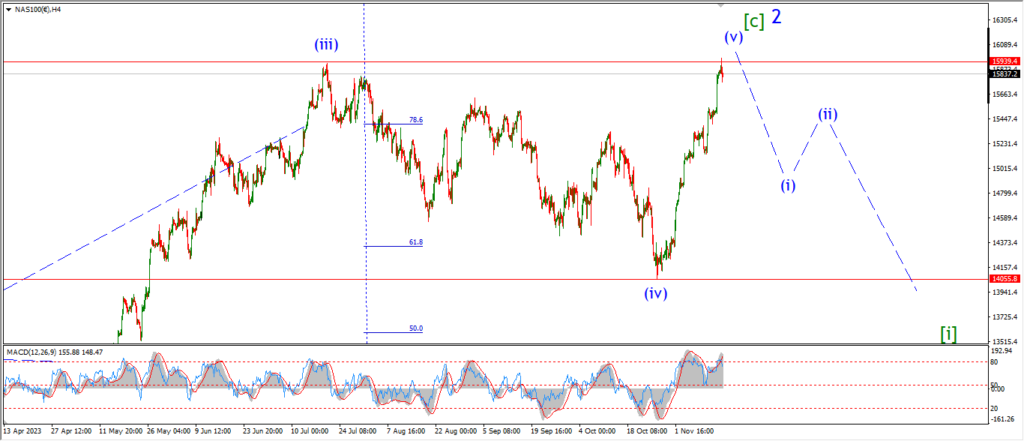
NASDAQ 4hr.
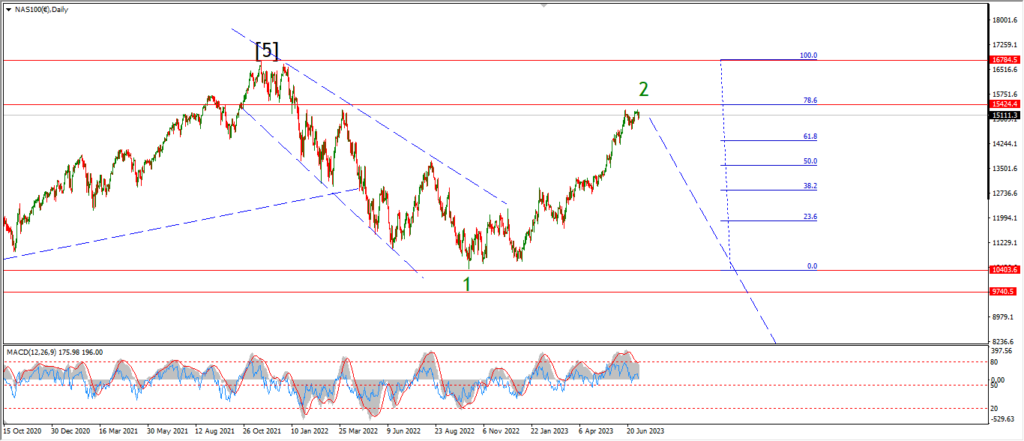
NASDAQ daily.
….