
Good evening folks, the Lord’s Blessings to you all.
Some interesting charts to start the week.
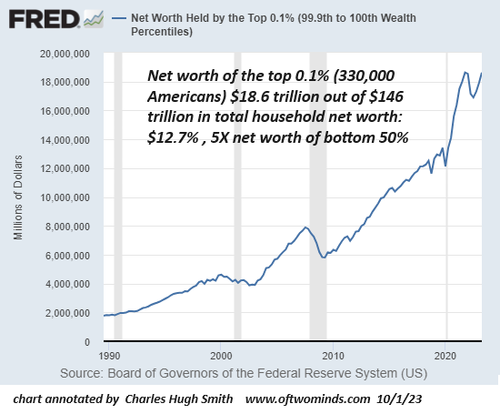
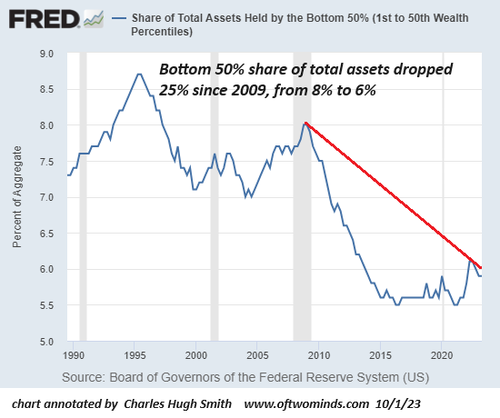
Warning: Helicopter money from the Pandemic has run out US fiscal expenditure just saw its deepest contraction in a decade Given the fragility of the system, an increase in fiscal spending is only a matter of time The economy can only handle so much before something breaks in the system

https://twitter.com/bullwavesreal
EURUSD.
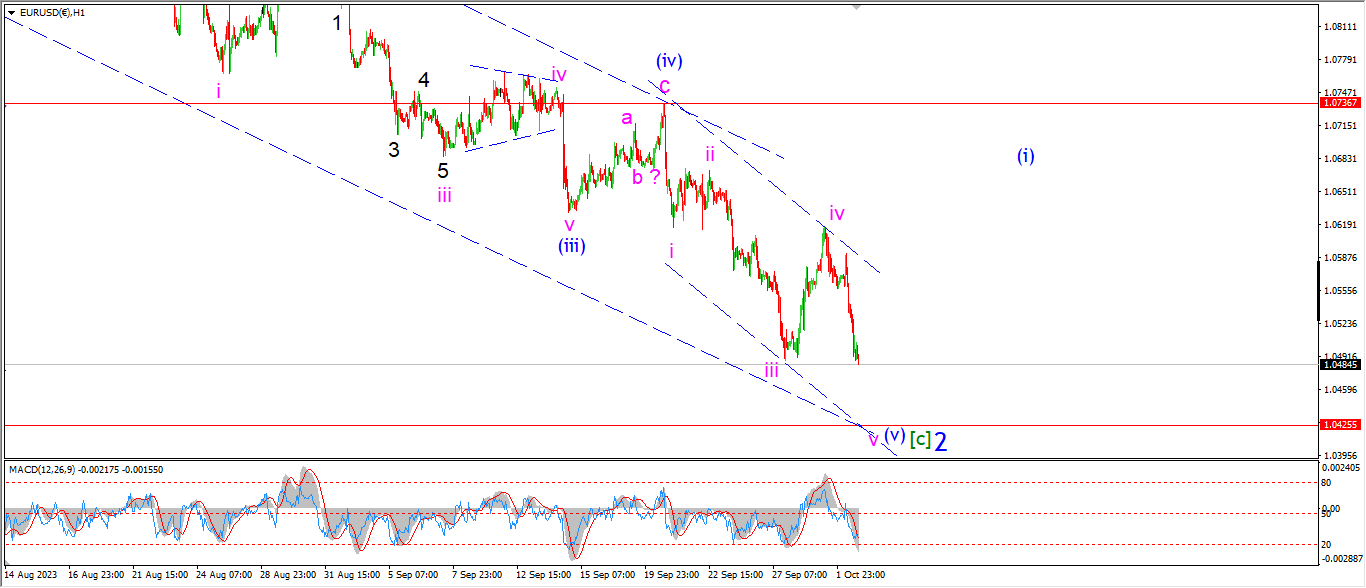
EURUSD 1hr.
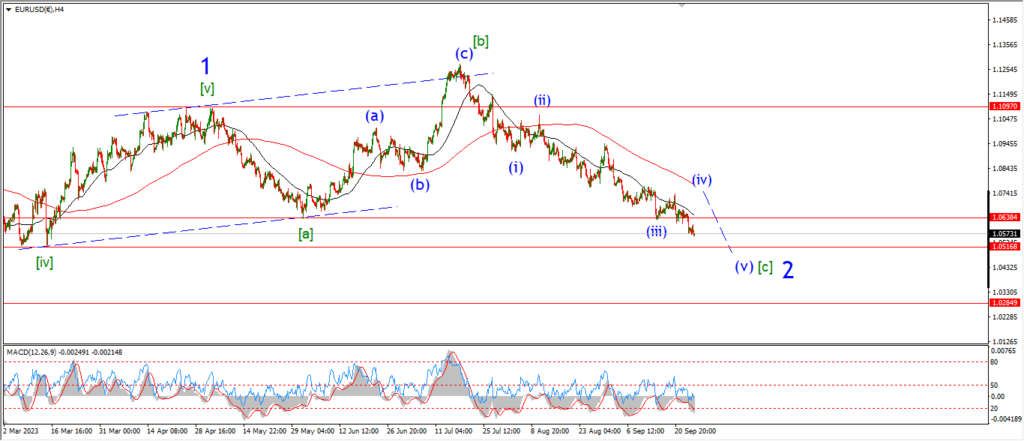
EURUSD 4hr.
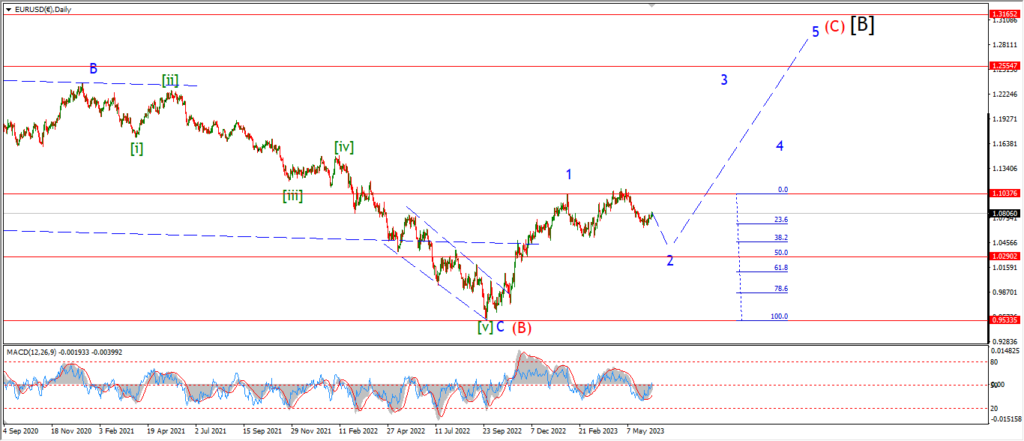
EURUSD daily.
Looking for a low in EURUSD is like catching a falling knife these days.
The rally from last week has now been fully retraced this evening.
So I have to rule out last Fridays idea for a reversal.
I am going to wait for another day at least to see how this move fits into the larger pattern.
At this point I do not have anything other than the final wave [c] decline needs one more step lower to complete the larger pattern.
If we see a drop back into the lower trend channel line again,
that will bring the price close to the 1.04 handle again.
And then we can look for a bullish reversal to build off that level.
Tomorrow;
Wave ‘v’ of (v) is still searching for a final low to complete the pattern.
Watch for a tag of the lower trend channel line near 1.0400 again to complete wave (v).
GBPUSD
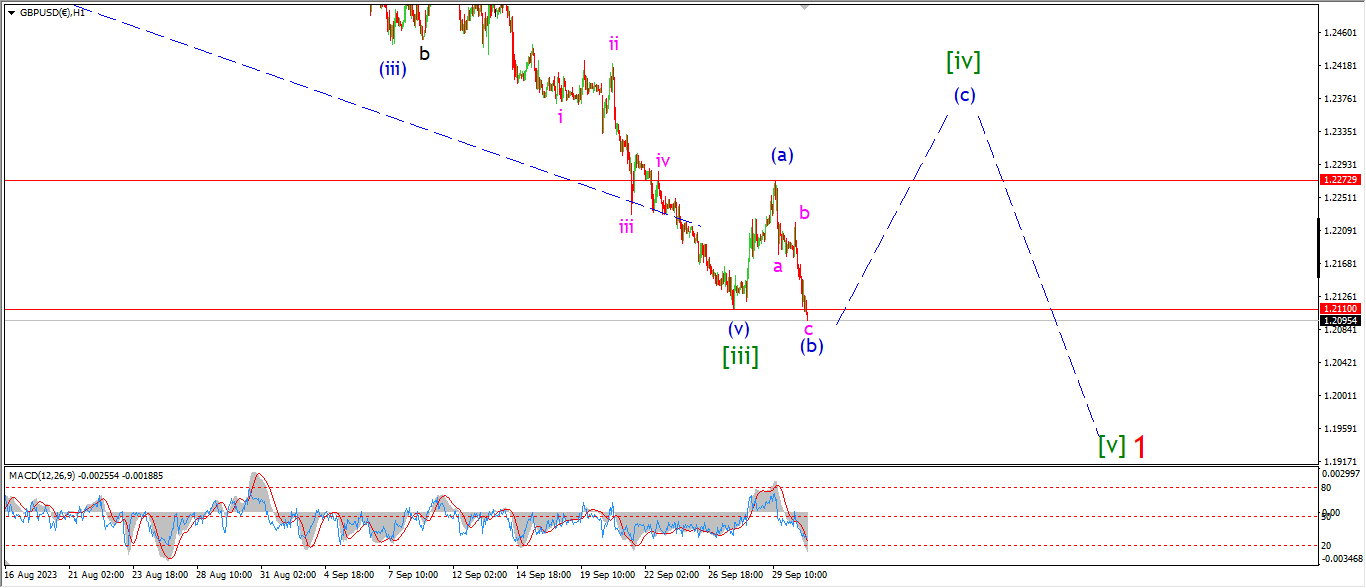
GBPUSD 1hr.
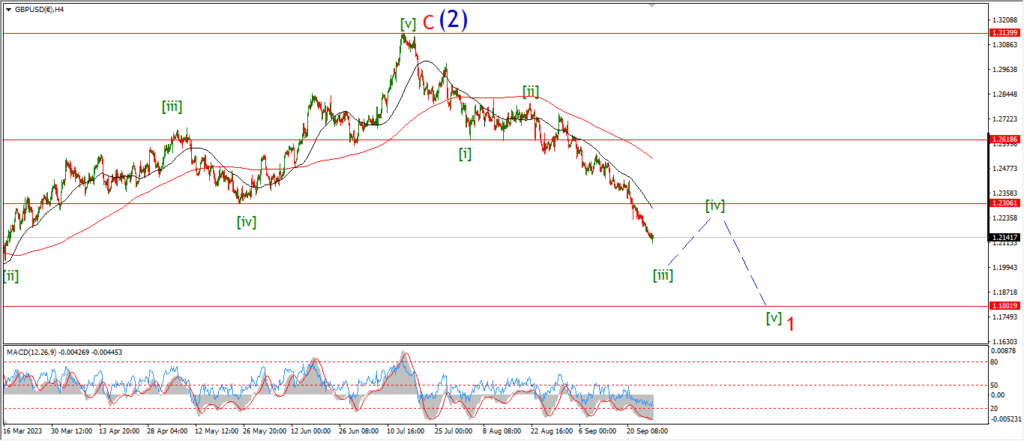
GBPUSD 4hr.
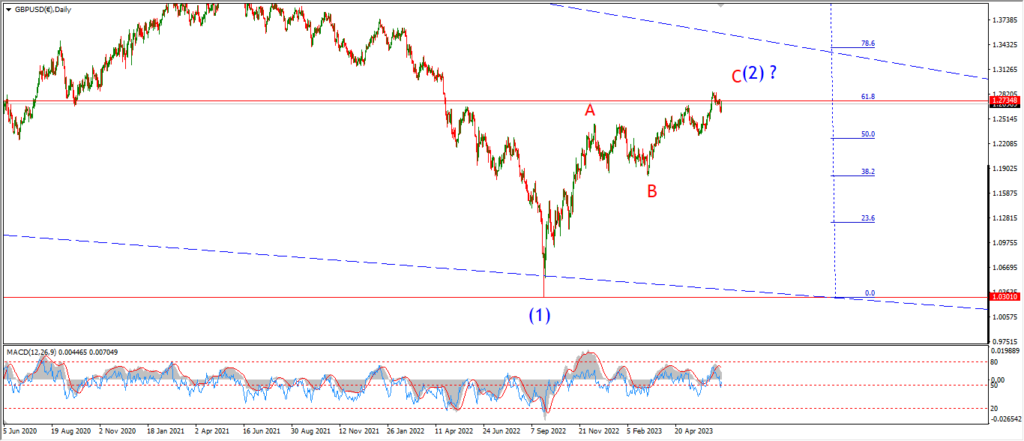
GBPUSD daily.
Cable is giving me the same headache tonight.
The price made a very small new low today and this does invalidate last Fridays pattern for wave [iv] green.
Perhaps wave [iv] is tracing out an expanded flat correction here.
That does explain the drop in three waves to a new low today.
That drop takes the wave (b) label.
And wave (c) should rally off that level in five wave from here.
If this pattern is correct then wave (c) will push back out above 1.2300 again over the next few days.
And by the end of this week we will see a top and reversal off wave [iv] green again.
Tomorrow;
Watch for wave (b) to hold at these lows.
Wave (c) will be confirmed with a break back above 1.2209 again.
USDJPY.
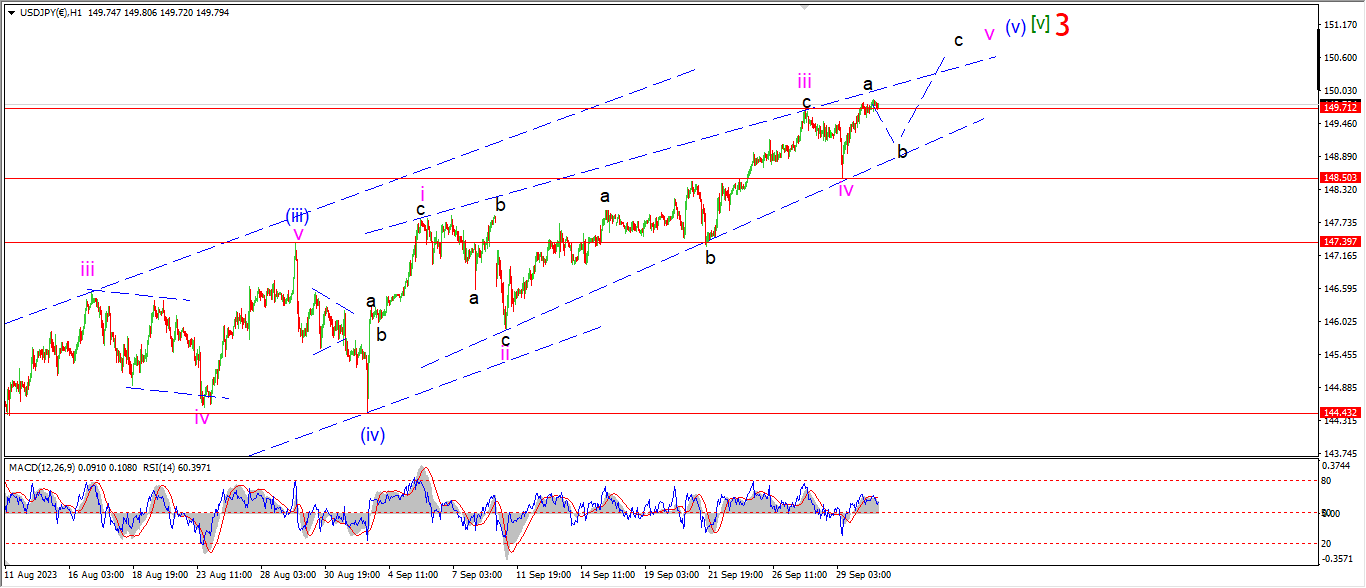
USDJPY 1hr.
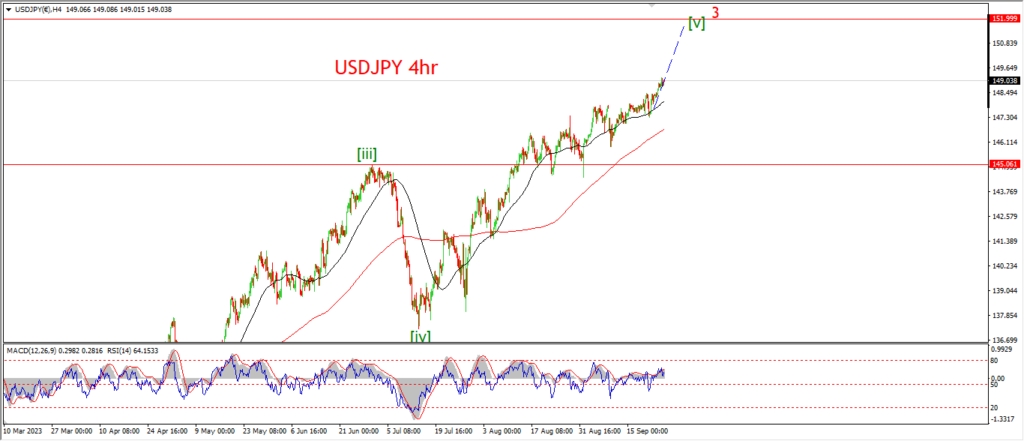
USDJPY 4hr.
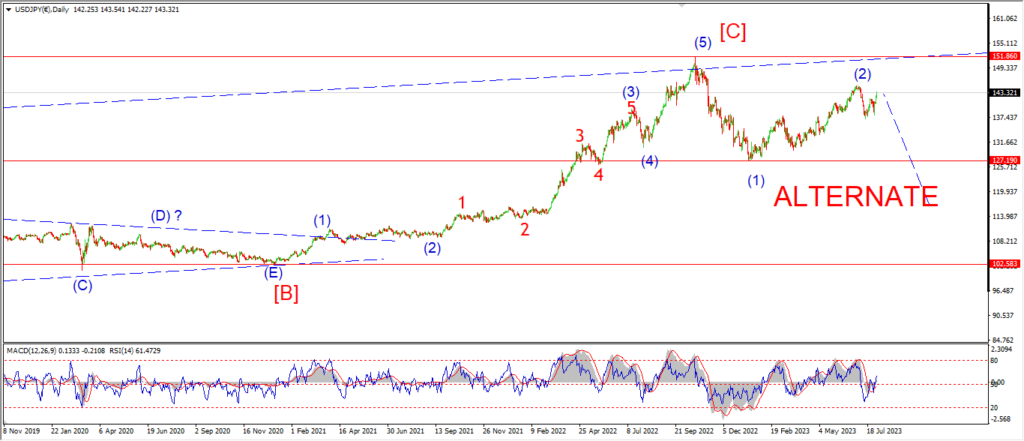
USDJPY daily.
USDJPY has not been affected by anything in the world today like the market is taking sleeping pills or something.
I have not changed the wave count either.
The high of the session is viewed as wave ‘a’ of ‘v’ of (v).
And we are topping out here at five degrees of trend.
This level of turning point usually means the final top of wave ‘3’ will be hard enough to pin point
because the lower degree patterns have many possibilities of combinations to complete that larger pattern.
It’s just the name of the game at this point in any wave pattern.
And I will have to roll with the punches as I cycle through the final iterations to complete wave ‘3’ red.
In all honesty,
I do expect wave ‘3’ to complete this week,
and then wave ‘iv’ should turn lower again.
Tomorrow;
Watch for wave ‘v’ pink to trace out a three wave pattern higher over the next few days.
A break of 148.50 again will invalidate this short term pattern.
DOW JONES.
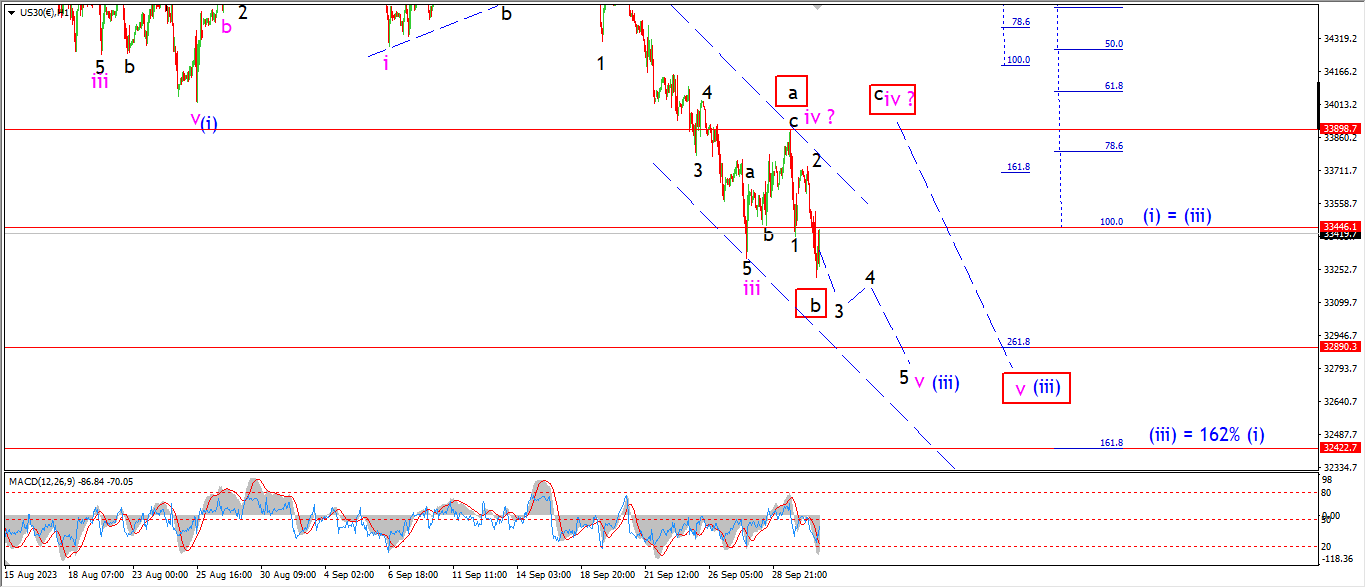
DOW 1hr.
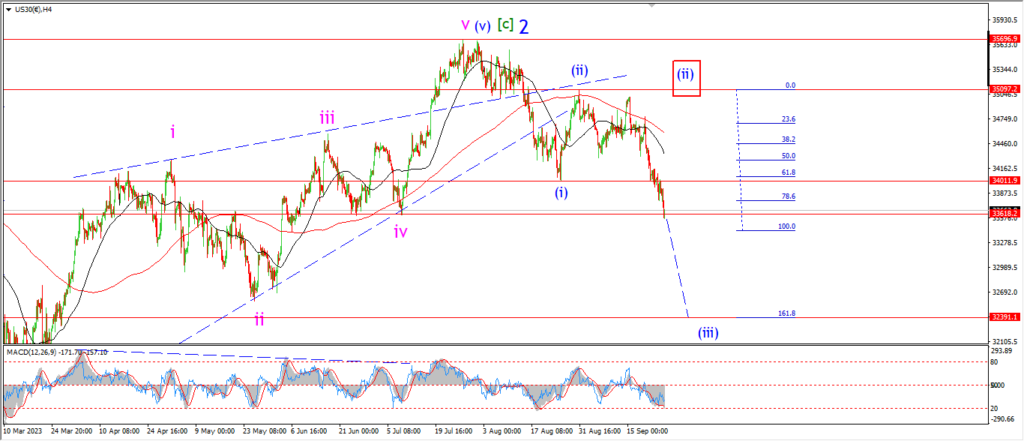
DOW 4hr
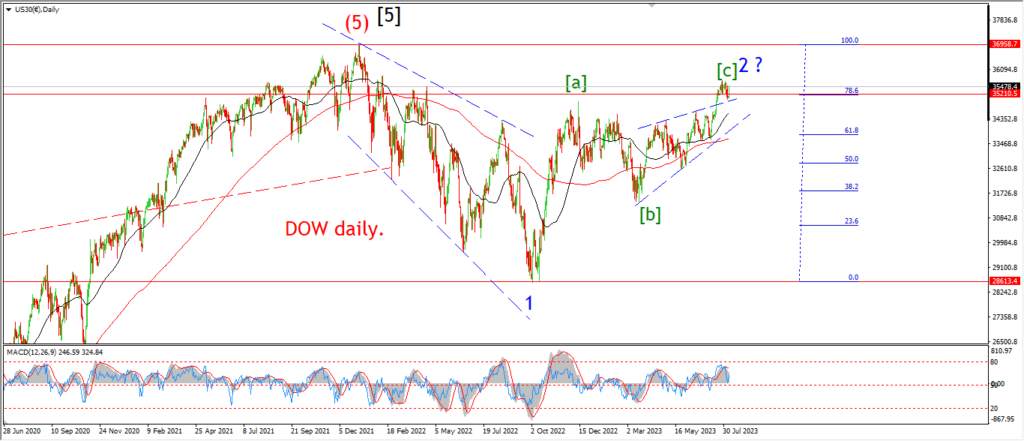
DOW daily.
Ok,
I am looking at two equally good wave counts that can explain todays action.
The main count,
this involves a new decline into wave ‘v’ of (iii) now underway.
The pattern should trace out five waves down to break 33000 in wave ‘v’ of (iii).
And then later in the week I will look for a rally to begin in wave (iv) blue.
The alternate count;
This count suggests wave ‘iv’ is still underway as an expanded flat correction.
Wave ‘b’ of ‘iv’ made a new low today.
and wave ‘c’ of ‘iv’ should turn higher from here to top out with a break of 33900 as shown.
Then wave ‘v’ can turn lower again later this week.
And wave ‘v’ down should bring a serious decline to a new low below 33000 again.
Tomorrow;
Watch for wave ‘v’ pink to continue lower and complete five waves down near 33000 again.
A break of 33730 again will favor the alternate count.
GOLD
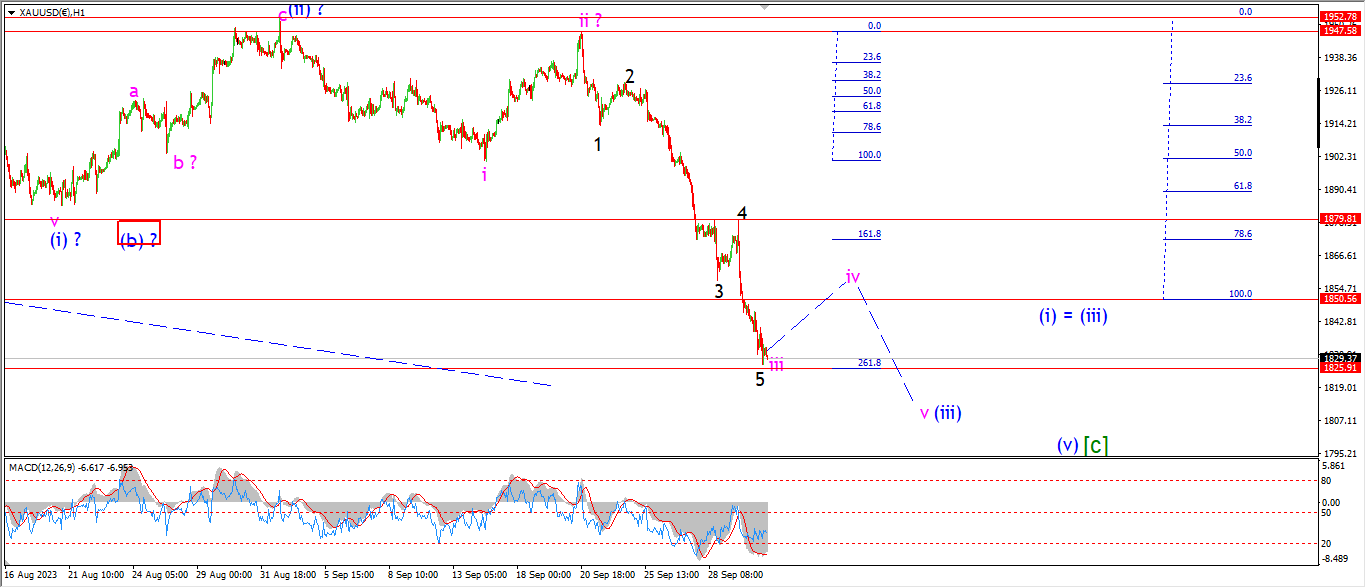
GOLD 1hr.
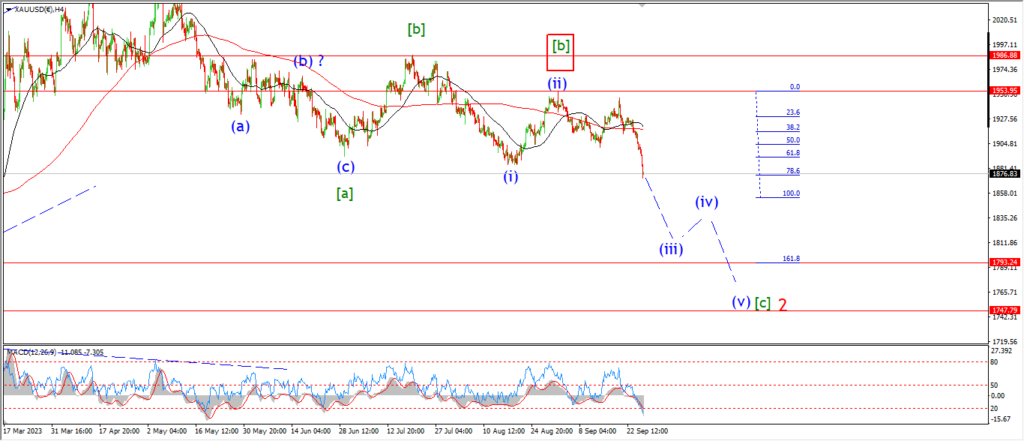
GOLD 4hr.
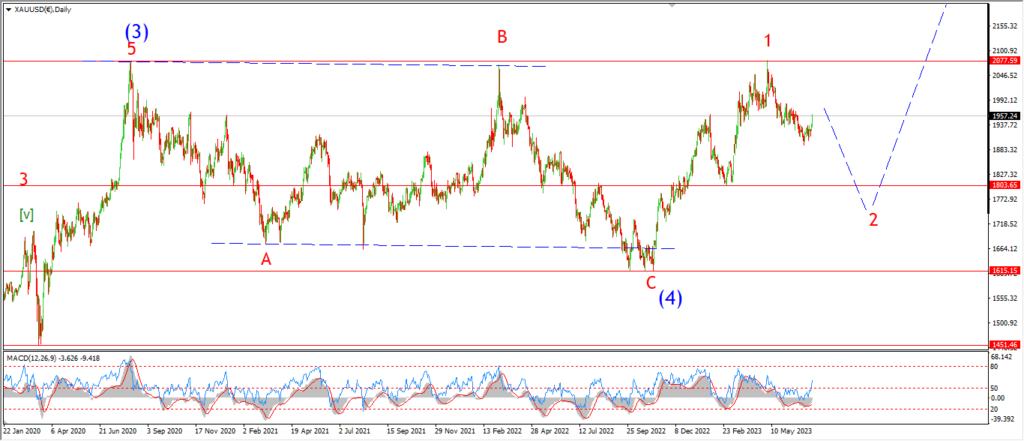
GOLD daily.
Gold has extended its decline in wave ‘iii’ of (iii) again today although momentum is slowing now.
The low of wave ‘iii’ has now reached the 262% extension level of wave ‘i’ at todays lows.
So I think this decline has gone far enough to look for at least a correction higher over the coming days.
Wave ‘iv’ should trace out three waves up and break above 1850 again by midweek.
And then wave ‘v’ down will turn lower again to complete wave (iii) later in the week.
Tomorrow;
Watch for wave ‘iii’ to complete and turn higher into wave ‘iv’ over the coming few days.
CRUDE OIL.
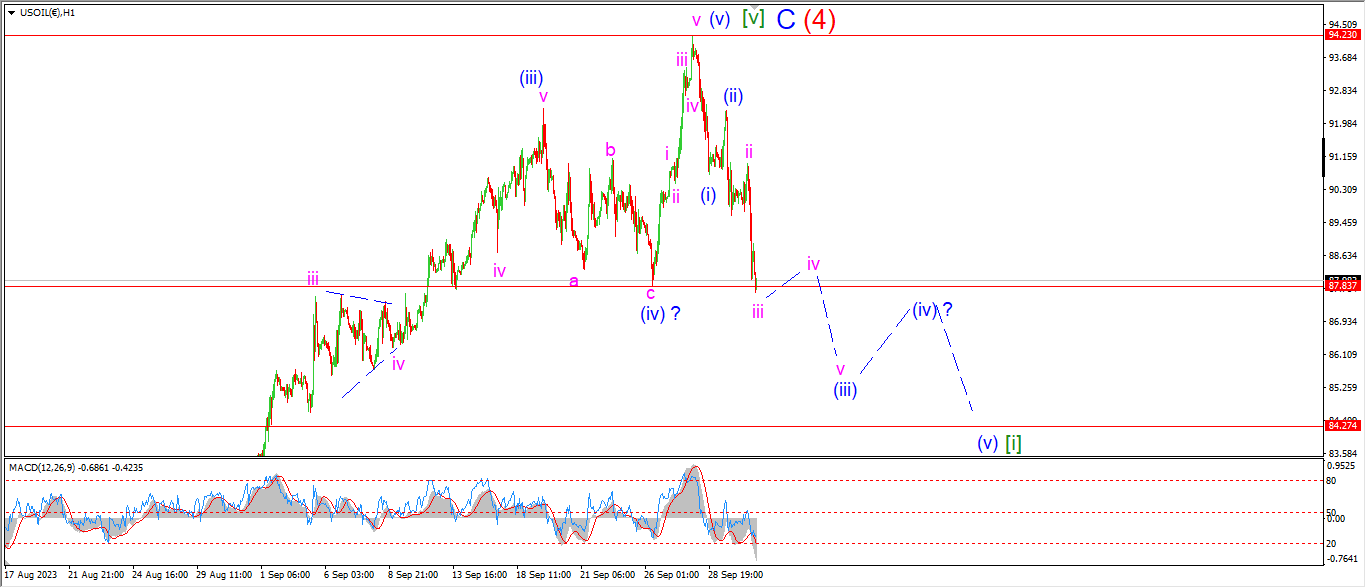
CRUDE OIL 1hr.
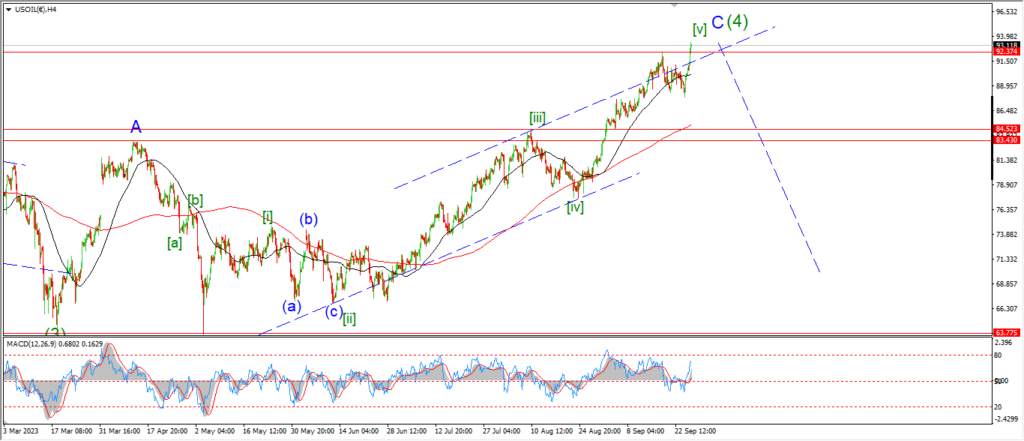
CRUDE OIL 4hr.
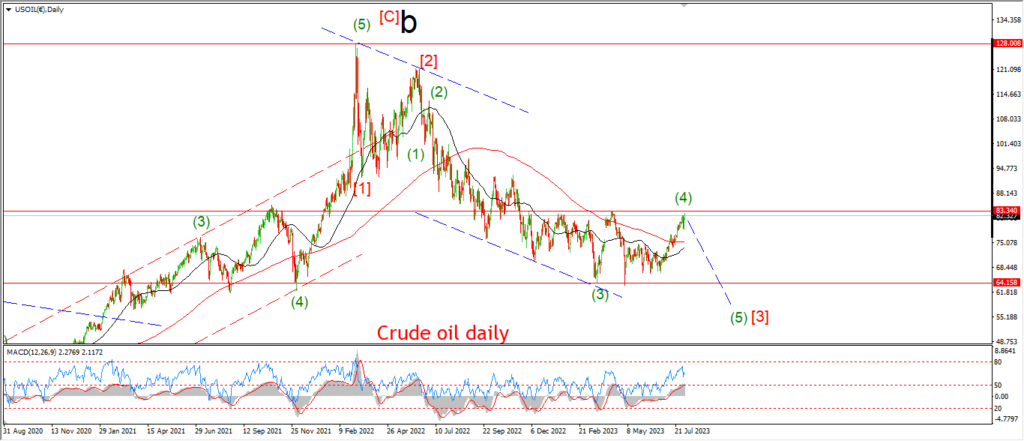
CRUDE OIL daily.
That’s quite the reversal from last weeks rally don’t you think??
I have changed the internal labelling slightly this evening.
I am now labelling this decline at one degree higher.
The continued decline today is within wave (iii) of [i].
and if this count is correct,
then wave [i] should break the 85.00 barrier by the end of this week.
todays sharp drop does fit well with the wave ‘iii’ of (iii) idea here.
So I think the overall reversal idea got a nice boost today.
Tomorrow;
Watch for the decline in wave (iii) of [i] to complete five waves down by midweek.
Overall wave (iii) should hit the 86.00 handle before turning higher in wave (iv).
S&P 500.
S&P 500 1hr
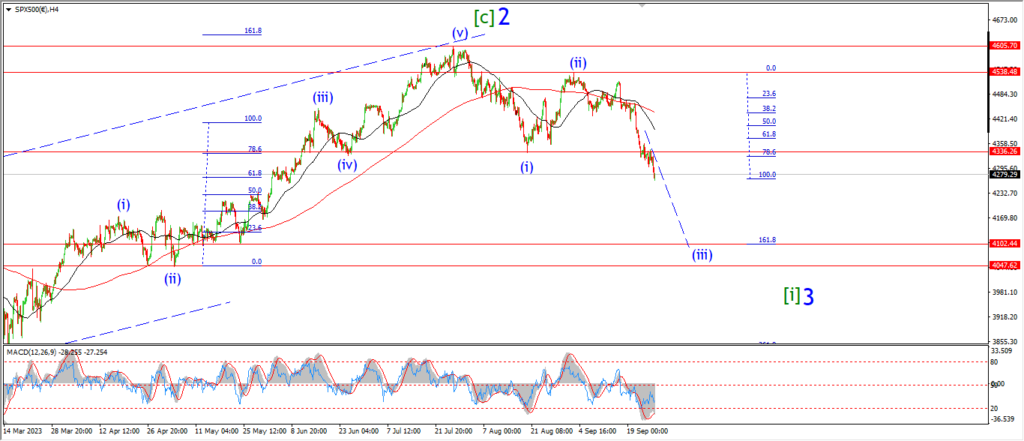
S&P 500 4hr
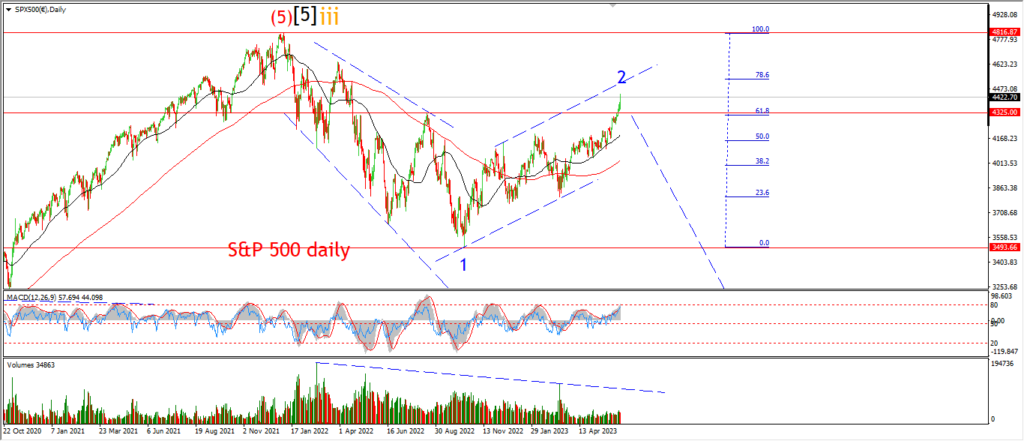
S&P 500 daily.
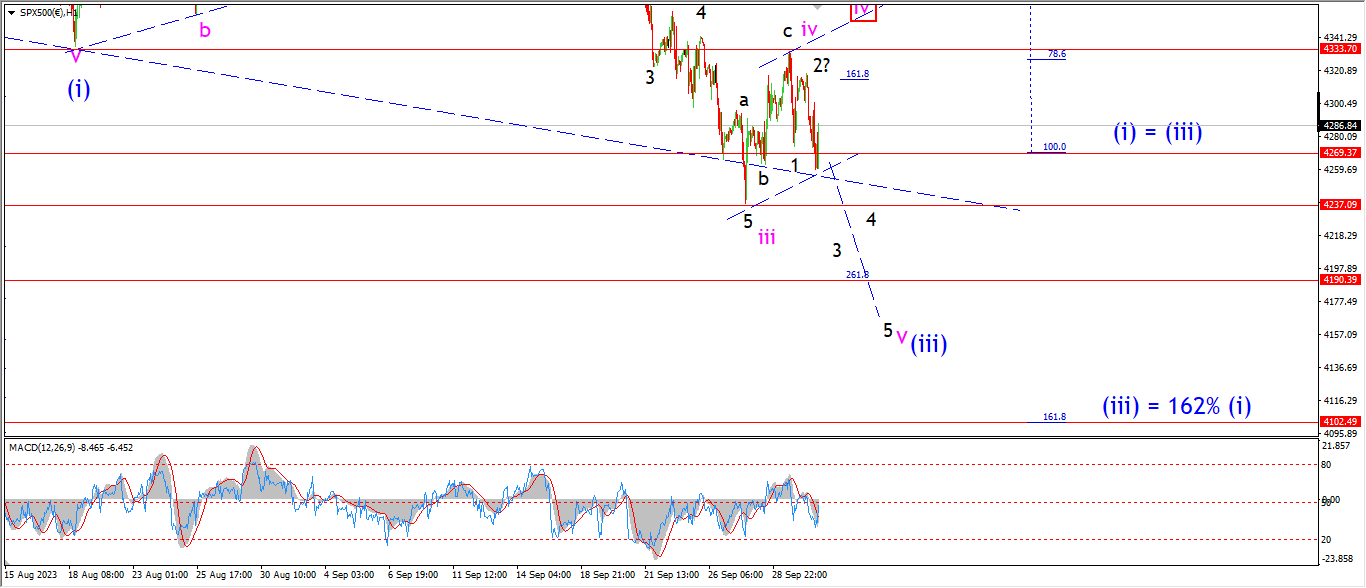
The market came down off that wave ‘iv’ high again today but the action was not enough to confirm wave ‘v’ is underway just yet.
I am still going with the idea that wave ‘v’ is in play now as the main wave count.
But there is an alternate count for wave ‘iv’ that can explain todays higher low.
This idea involves a larger wave ‘iv’ pattern as shown.
Wave ‘b’ of ‘iv’ completed at todays lows,
and wave ‘c’ can rally back above 4333 again to complete that alternate wave ‘iv’.
We will know tomorrow which count is the better fit here.
tomorrow;
Watch for wave ‘v’ to be confirmed with a break below 4237 at the wave ‘iii’ low.
Wave ‘v’ should fall further to complete though.
I would like to see a final low for wave ‘v’ and wave (iii) near 4100 again.
This may ne a stretch goal at the 162% extension,
but I think it is worth keeping in mind.
SILVER.
SILVER 1hr
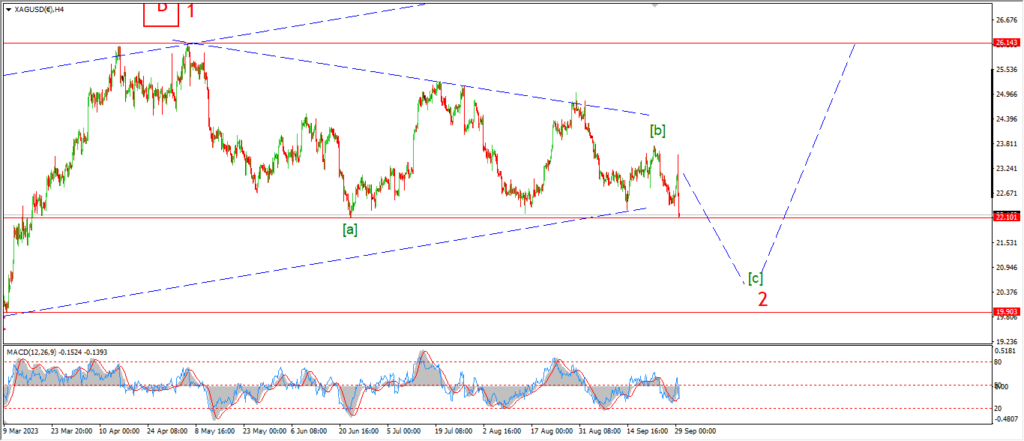
SILVER 4hr.
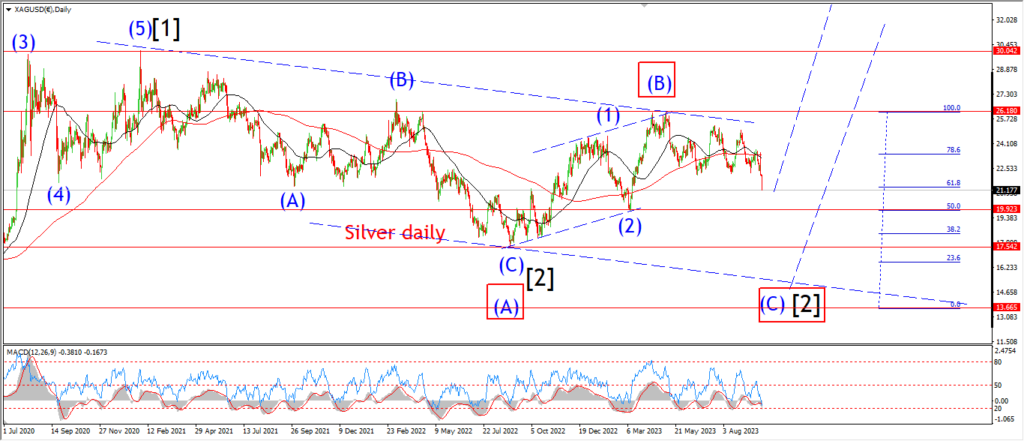
SILVER daily.
If we look at the larger pattern on the daily chart tonight.
We can see that the current low is getting very close now to that invalidation low at wave (2) blue at 19.90.
If that level is broken again,
that will really throw this bullish count into disarray again.
the short term count will be invalidated.
And a break of that level will give the alternate wave count on the daily chart a major boost!
That could spell disaster for the silver market over the rest of this year anyway.
And that alternate count for wave [2] black calls for a low back near 14.00 again.
Things are getting almost too close for comfort here.
That 19.90 level is key for this bullish count in the short term.
Tomorrow;
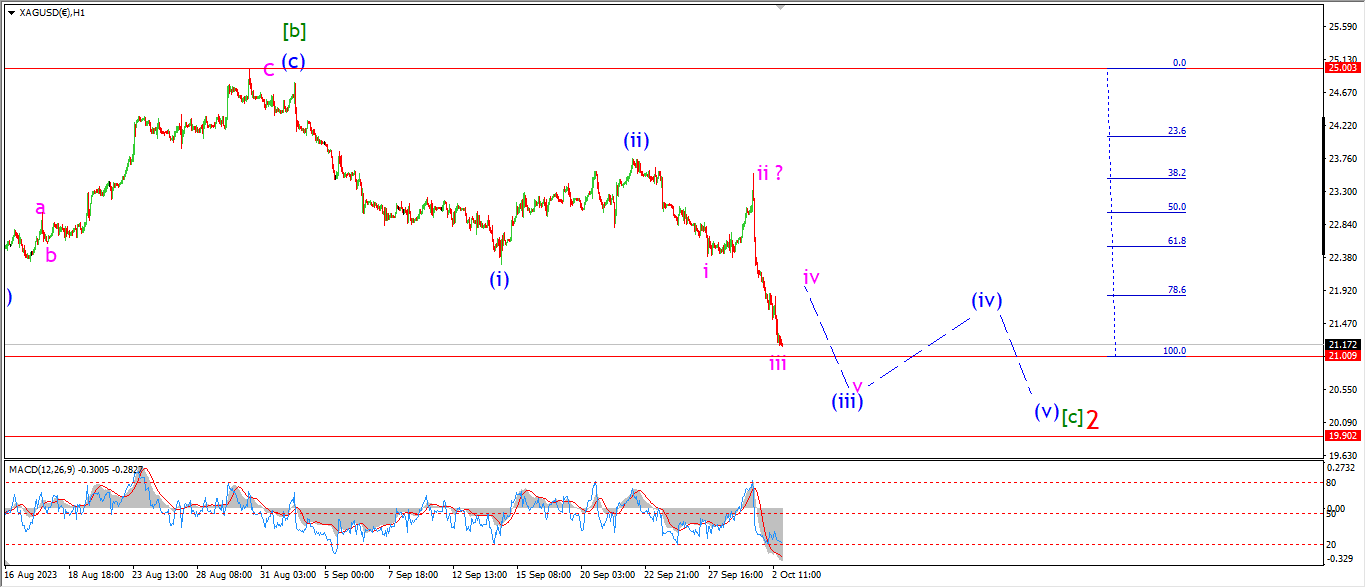
Watch for wave [c] of ‘2’ to complete above 19.91 at the very extreme low.
Wave (iii) of [c] should complete five wave down by midweek,
and then wave (iv) of [c] can turn higher in a correction later in the week.
BITCOIN
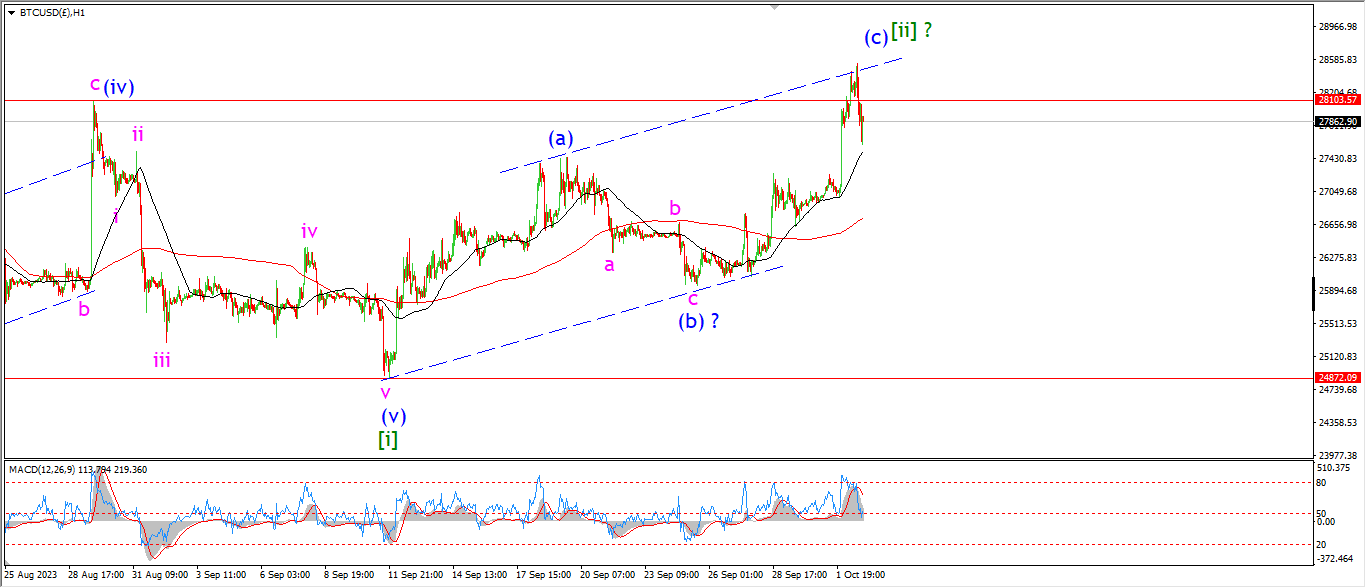
BITCOIN 1hr.
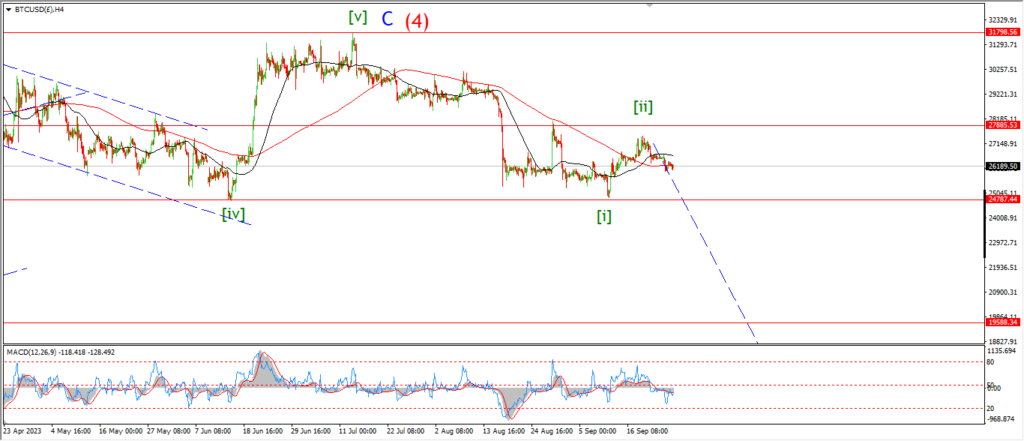
BITCOIN 4hr.
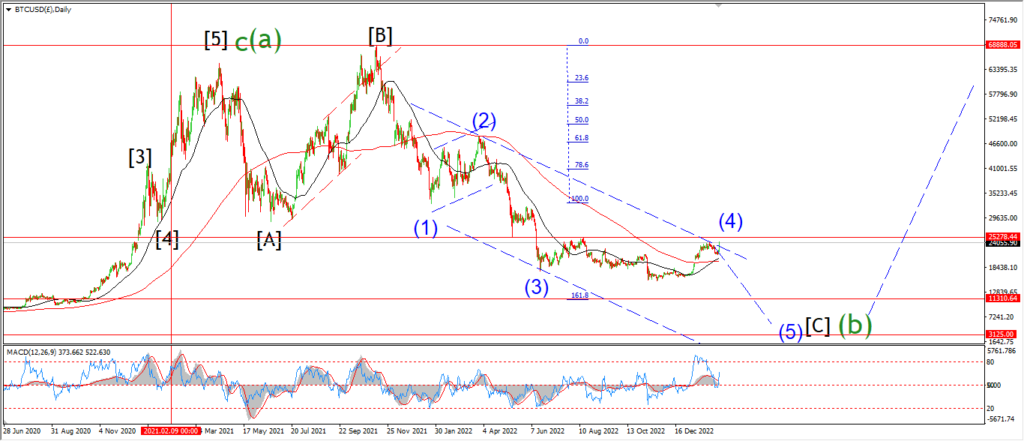
BITCOIN daily.
….
FTSE 100.
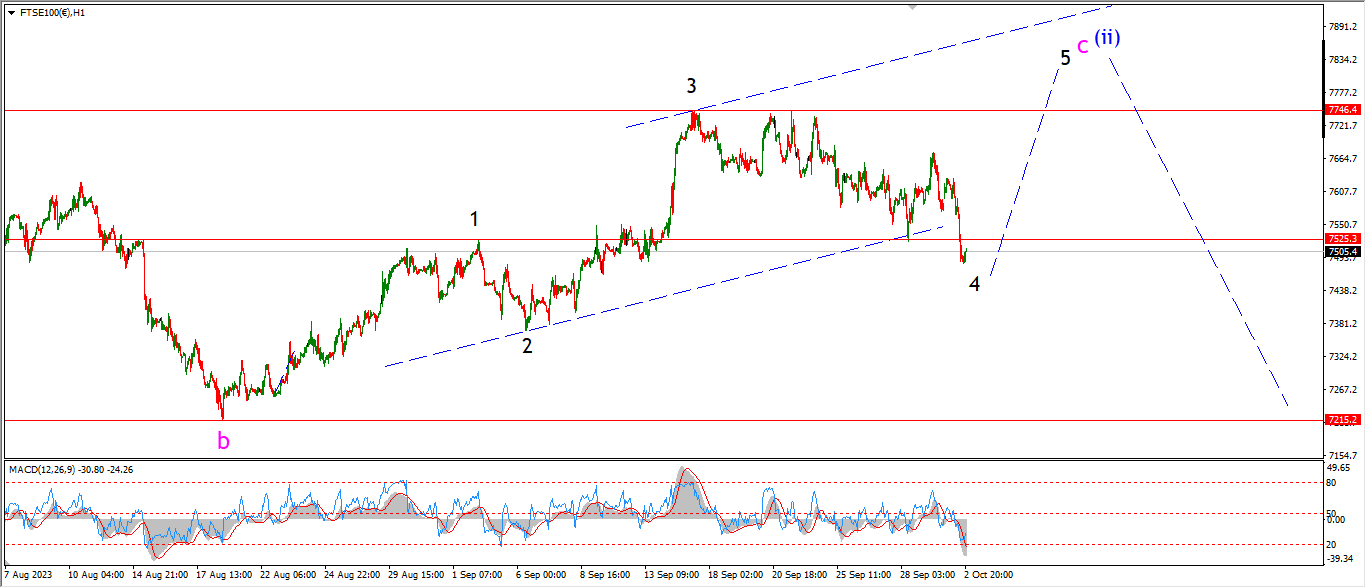
FTSE 100 1hr.
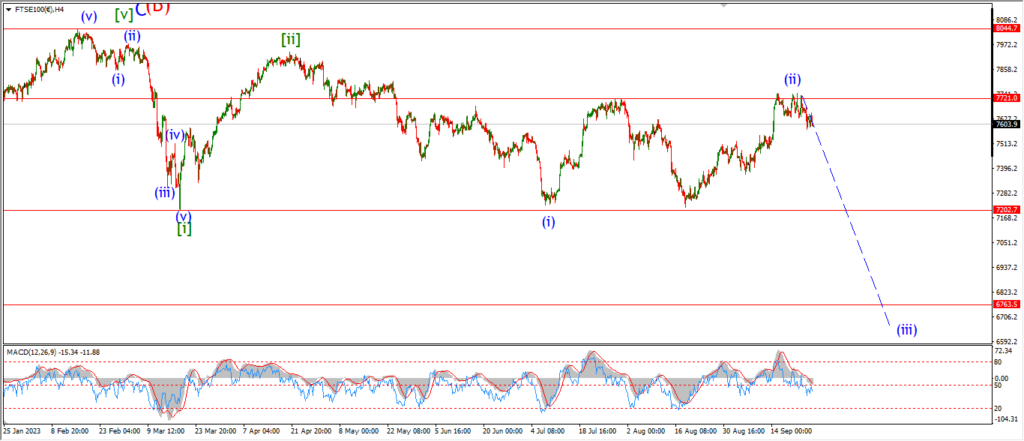
FTSE 100 4hr.

FTSE 100 daily.
….
DAX.
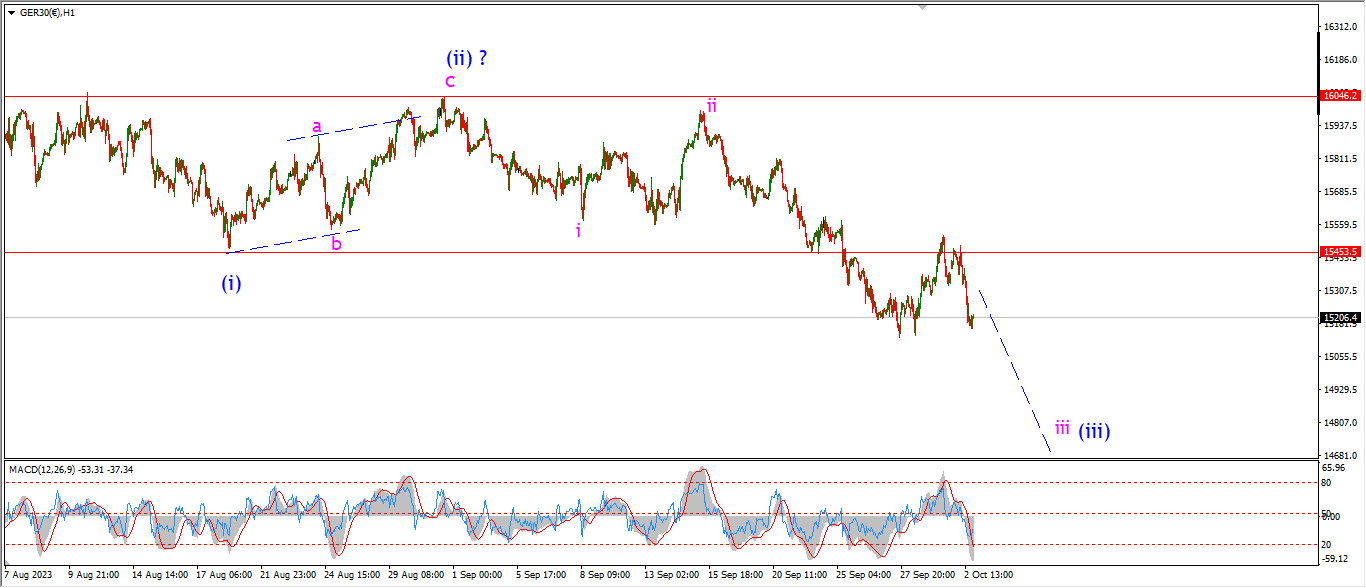
DAX 1hr
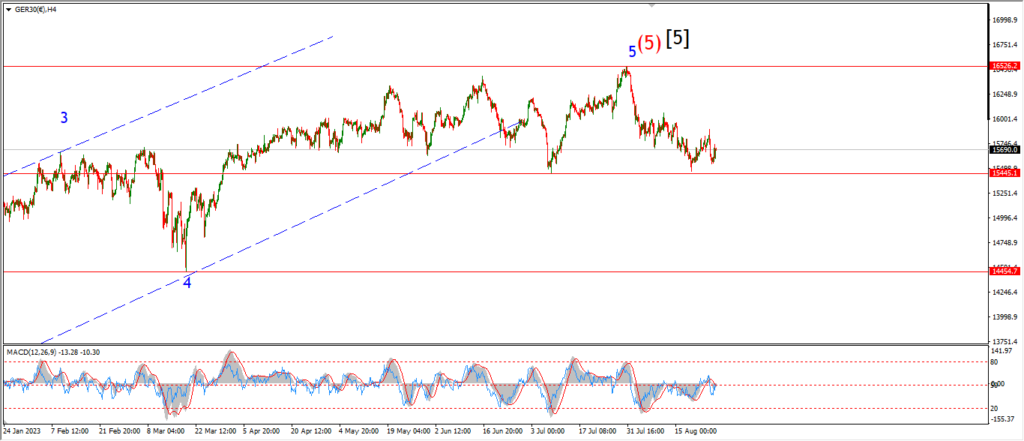
DAX 4hr

DAX daily.
….
NASDAQ 100.
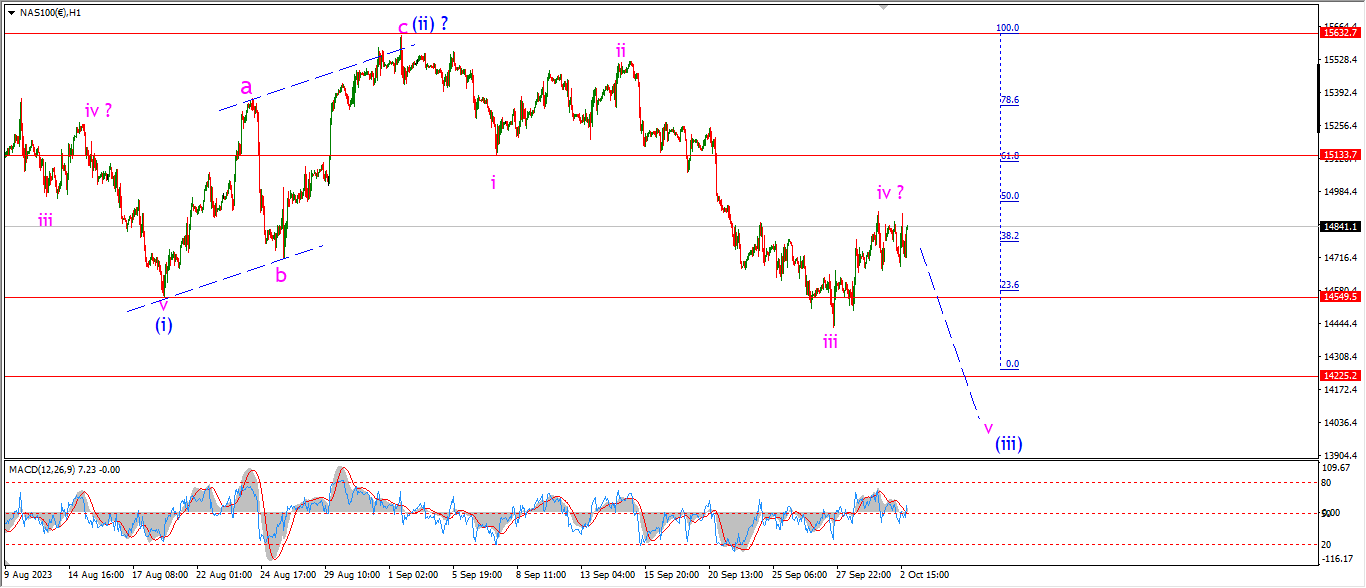
NASDAQ 1hr
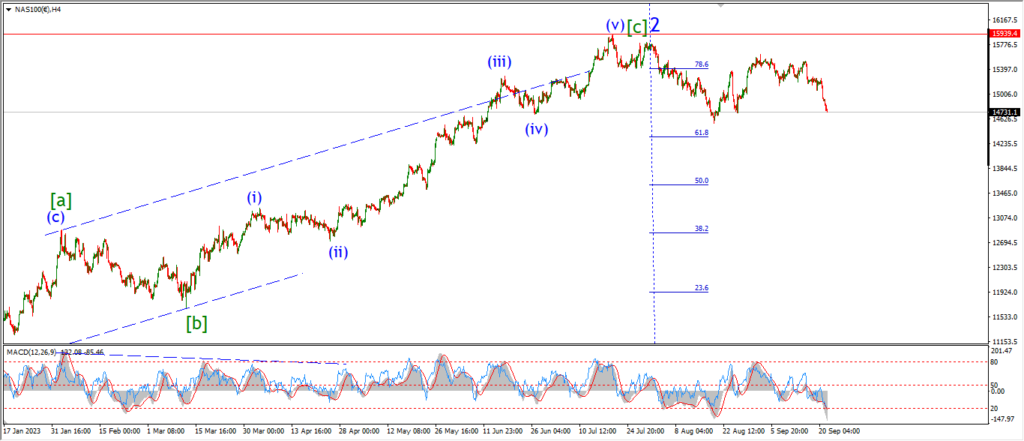
NASDAQ 4hr.
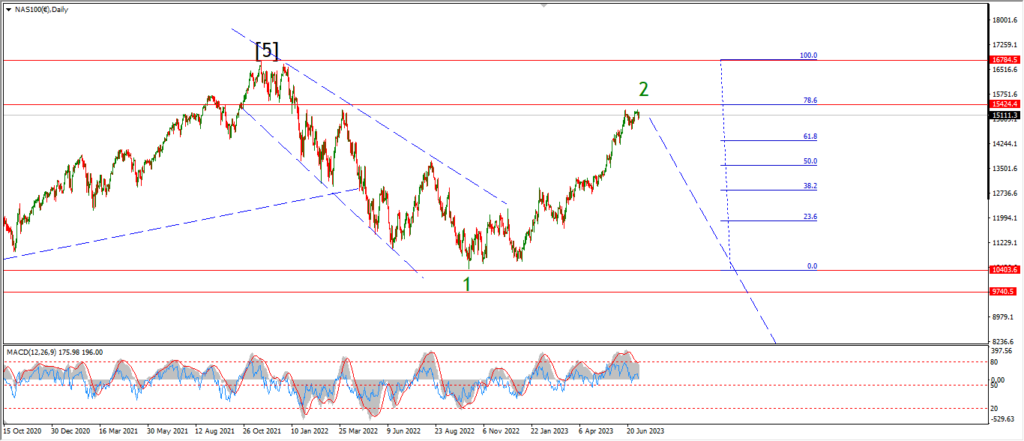
NASDAQ daily.
….