
Good evening to one and all, the Lord’s Blessings to you tonight.
A few interesting charts to start the week!
World debt has rapidly increased since 1997;
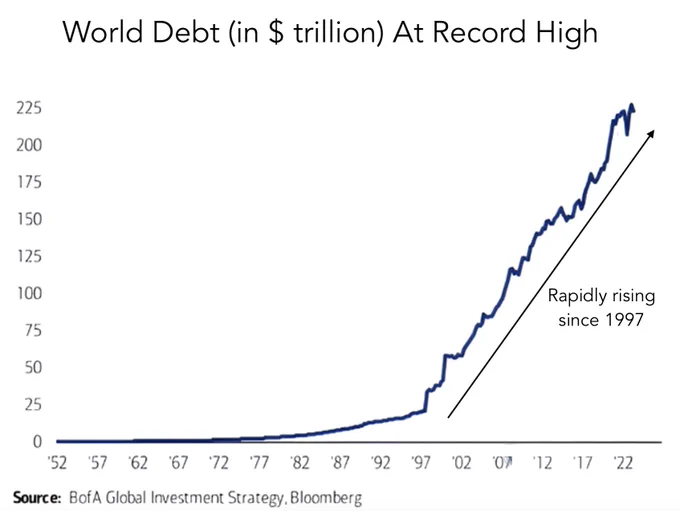
When this happens it screams crisis… The FT reports (link below), “Chinese economists told not to be negative as rebound falters: Authorities… want analysts to avoid mention of deflation risk”.

*Bank credit YoY is now -0.2% YoY – first time negative since 08.

https://twitter.com/bullwavesreal
EURUSD.
EURUSD 1hr.
EURUSD 4hr.
EURUSD daily.
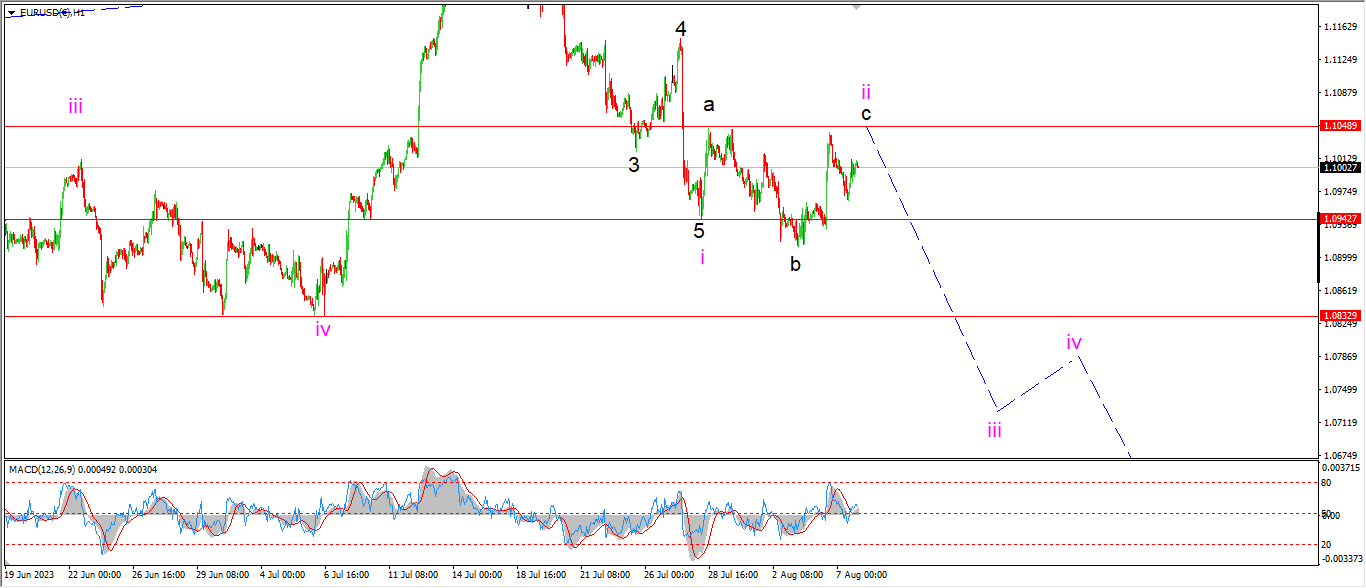
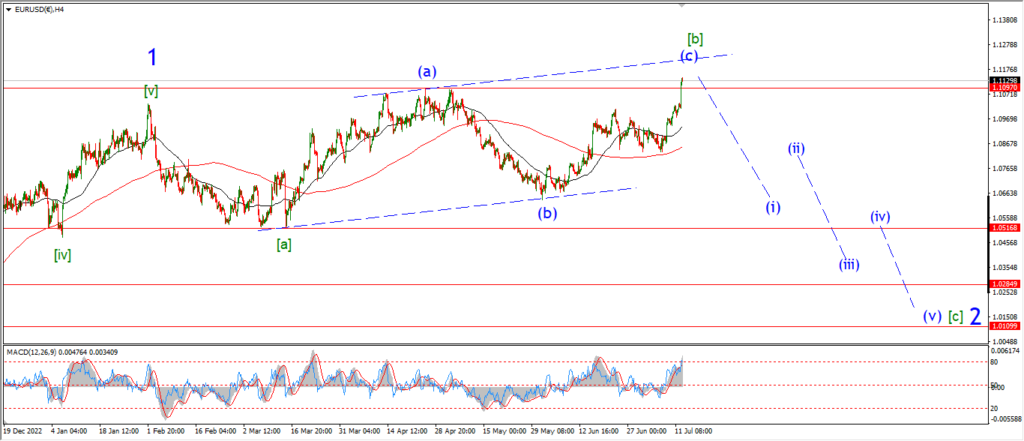
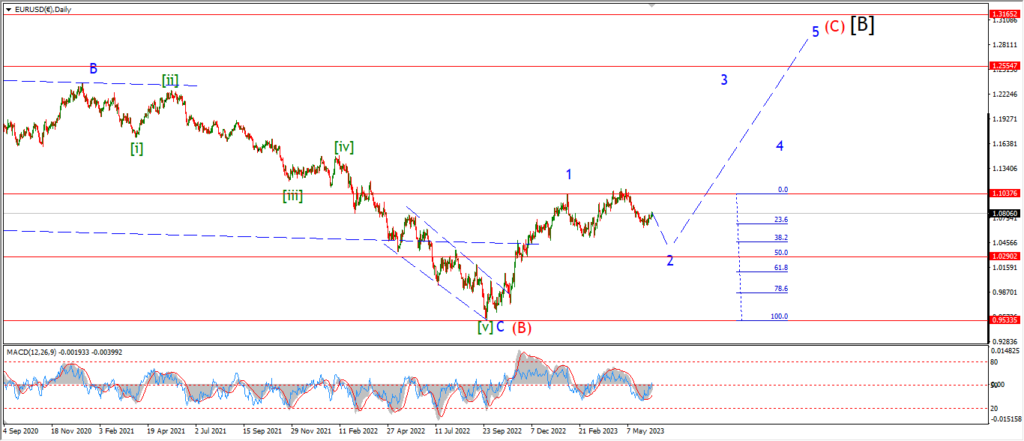
EURUSD has not hit the target high for wave ‘c’ of ‘ii’ yet.
instead of a break of of the wave ‘a’ high at 1.1048 today we got a small drop back into the range again.
There is a good chance that wave ‘c’ is tracing out a five wave pattern to complete the larger expanded flat wave ‘ii’.
So I am still looking for one more spike to break the target at 1.150 and then a reversal into wave ‘iii’ of (i) as shown.
Tomorrow;
Watch for wave ‘ii’ to complete the expanded flat pattern with a break of 1.1050.
When that happens,
then I will turn my attention lower into wave ‘iii’ again.
GBPUSD
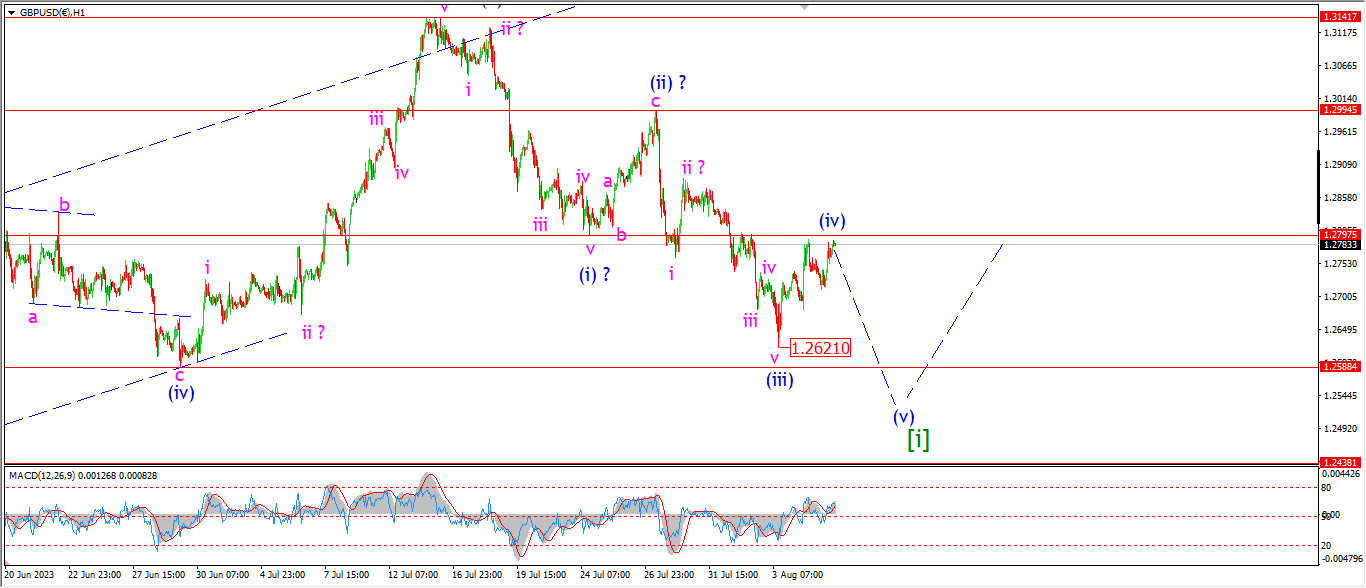
GBPUSD 1hr.
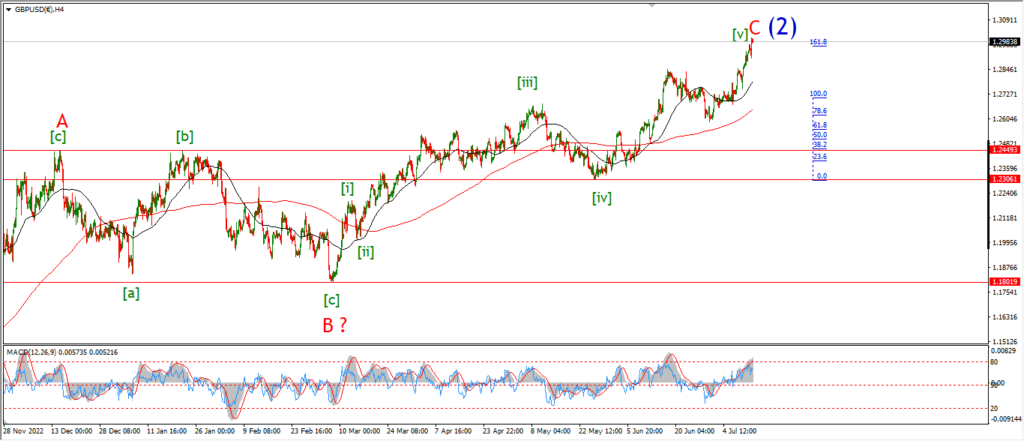
GBPUSD 4hr.
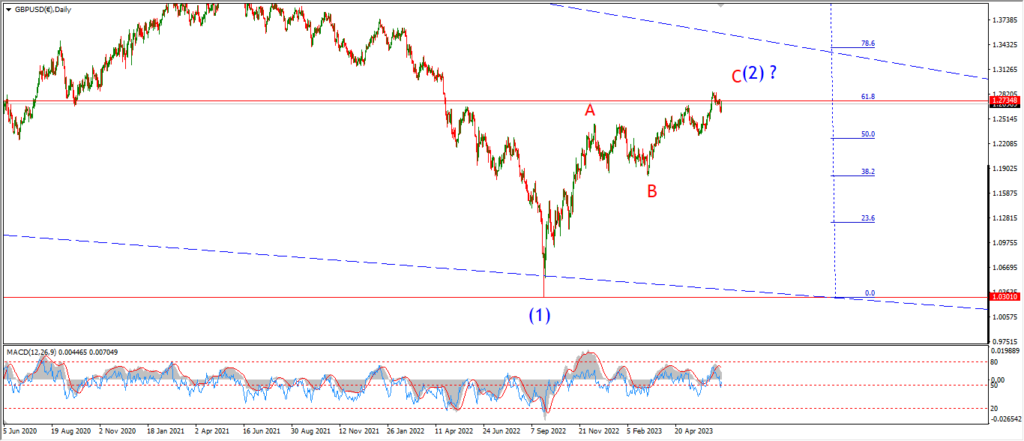
GBPUSD daily.
I am a less convinced of the short term pattern in cable this evening after todays action.
I would like to see another drop below the wave (iii) low at 1.2621 to complete five waves down in wave [i].
But at the moment the price action is pretty flat on the session without any reversal in sight.
If there is better fitting pattern than the one I am working with here,
it will shown itself pretty soon I’m sure.
I will stick with the main wave count until it is invalidated again.
Tomorrow watch for the wave (i) low to hold at 1.2797.
Wave (v) of [i] must turn lower again beginning tomorrow.
Wave (v) must break 1.2610 at a minimum.
USDJPY.
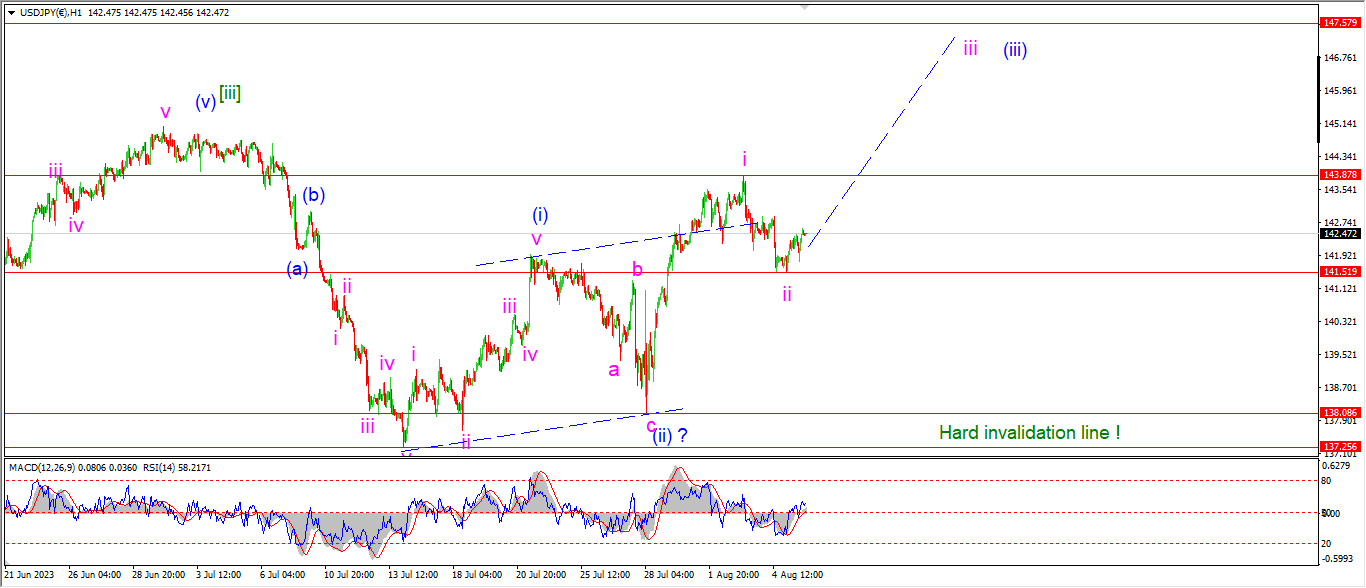
USDJPY 1hr.

USDJPY 4hr.
USDJPY daily.
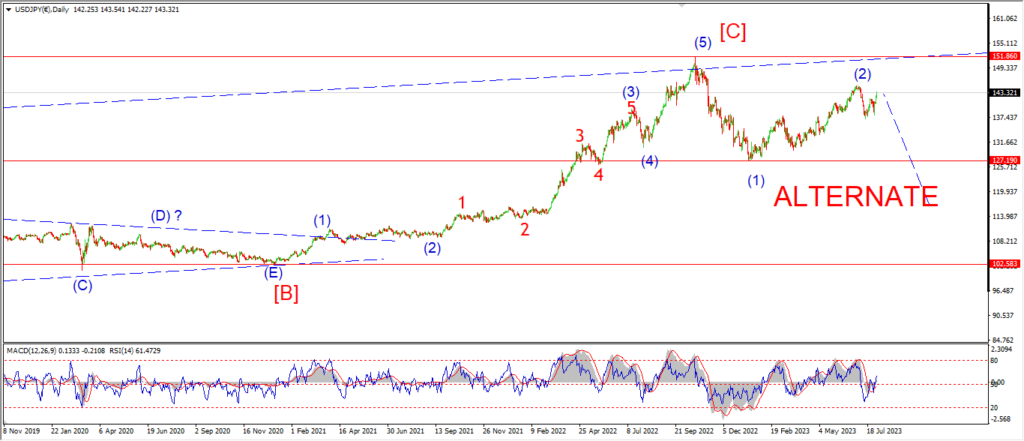
I have switched to the alternate count for the short term chart tonight.
This is a much more bullish count for wave (iii) of [v],
but this is speculative at the moment to be honest.
We have a three wave decline to a higher low in wave ‘ii’.
And if the price rallies again to break 143.87 that will be a signal that wave ‘iii’ of (iii) is underway.
Of course wave ‘ii’ could turn lower again and build a larger corrective structure.
But for this moment I want to give this pattern a chance.
Tomorrow;
Watch for wave ‘iii’ of (iii) to turn higher again and break out above 140.87 to signal the acceleration rally is underway.
DOW JONES.
DOW 1hr.
DOW 4hr
DOW daily.
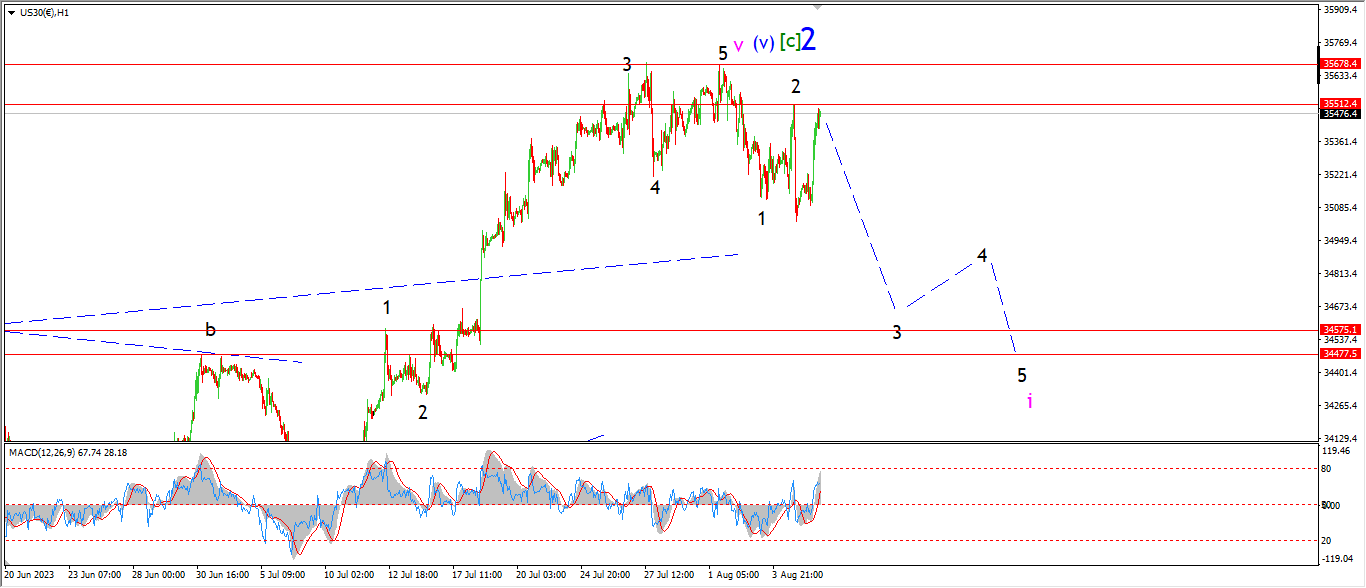
The Dow put in a short spike rally today but the price is holding below the previous high labelled wave ‘2’.
This count is hanging in the balance at the moment,
and it remains to be see if the recent weakness is just a correction in the larger rally,
or if the trend has finally broken to form a top for wave ‘2’.
Another drop this week towards the initial support at 34570 area will add some weight to my argument.
But at the moment I have very little support on the short term chart for my reversal theory.
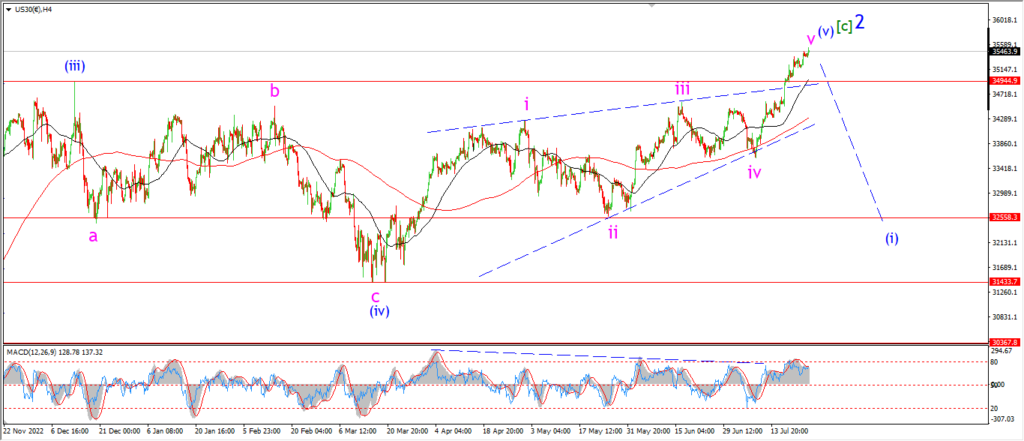
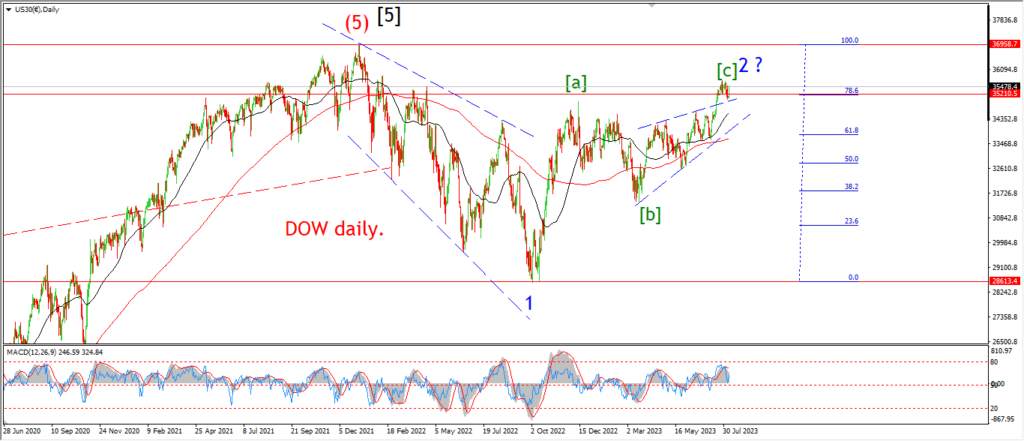
The longer term charts are more favorable to my theory.
The 4hr chart shows a completed pattern and a bearish momentum divergence.
The daily chart shows a completed pattern at a the 78.6% Fib retracement level.
All I can say this evening is lets see how this goes.
Tomorrow;
The market should continue to hold the lower highs and turn lower again to accelerate towards the initial support at 34570.
GOLD
GOLD 1hr.
GOLD 4hr.
GOLD daily.
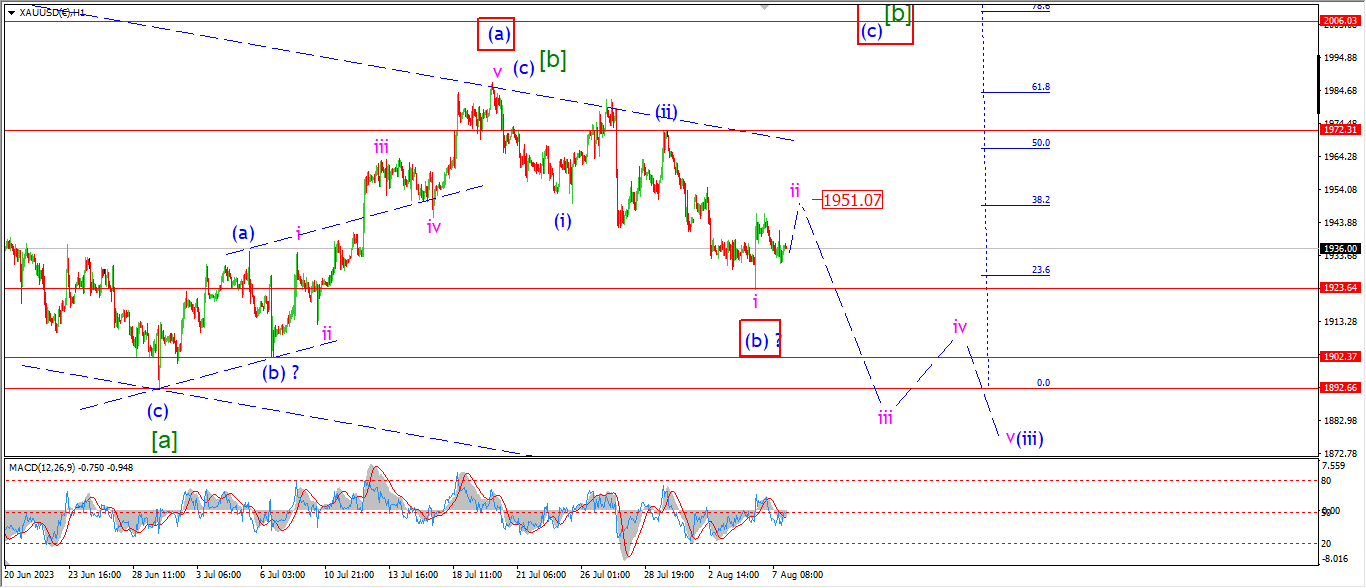
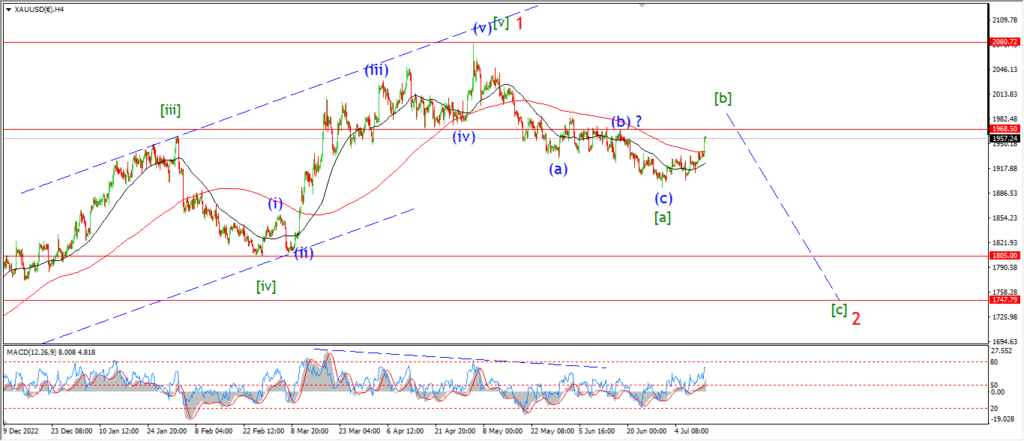
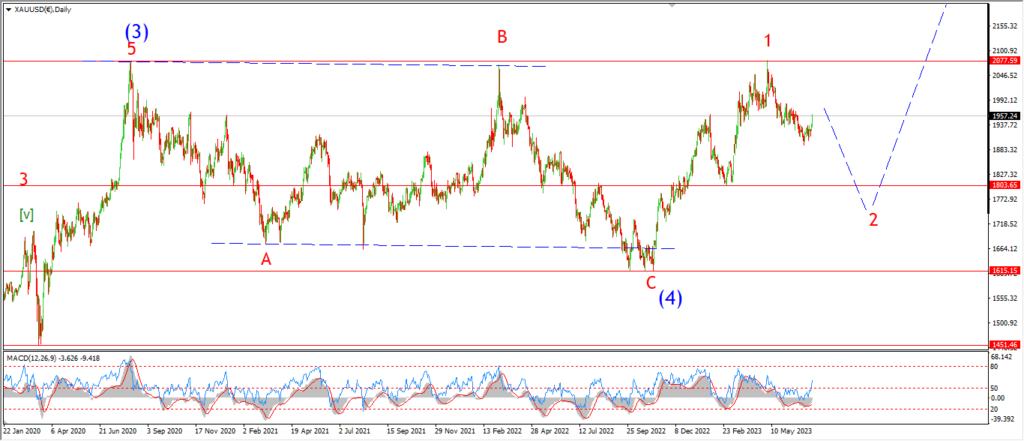
The action today looks more like a small correction lower within the larger pattern.
So I have shown a larger three wave pattern as an option for wave ‘ii’ tonight.
This idea suggests wave ‘ii’ will complete near 1950 again,
and then the decline into wave ‘iii’ of (iii) is reserved for later this week.
Tomorrow;
Watch for a three wave correction to complete in wave ‘ii’ near 1950.
Wave ‘iii’ down should then turn lower again to break 1923 again.
CRUDE OIL.
CRUDE OIL 1hr.
CRUDE OIL 4hr.
CRUDE OIL daily.
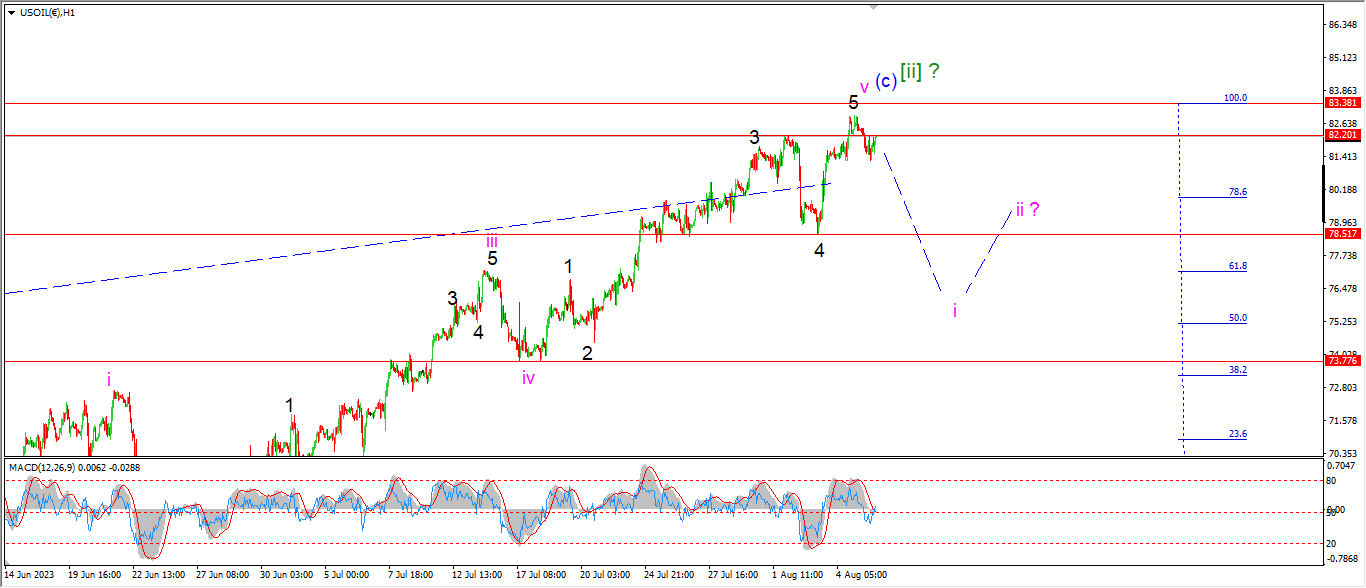
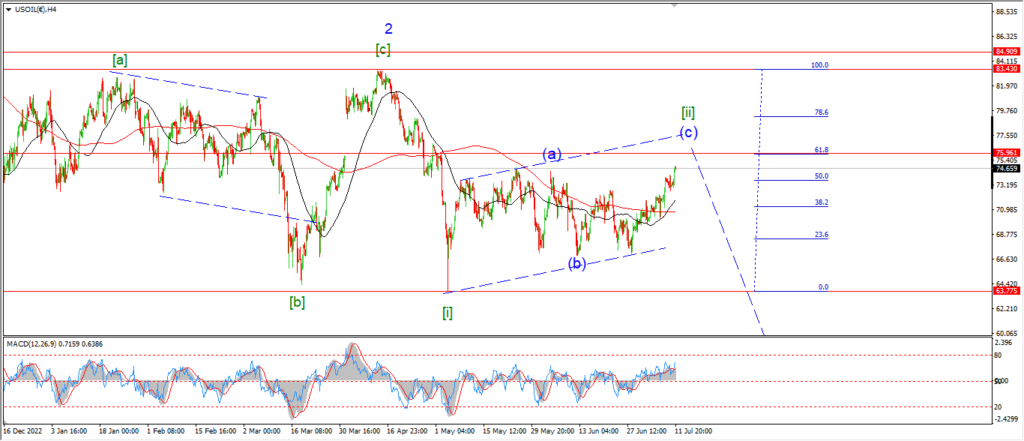
Crude has basically done nothing today,
the lower high is holding for wave [ii],
but I will admit that is wave count for wave [ii] is on the verge of breaking here.
Only a very sharp decline that can threaten the previous wave ‘iv’ low at 73.77 again will save this count now.
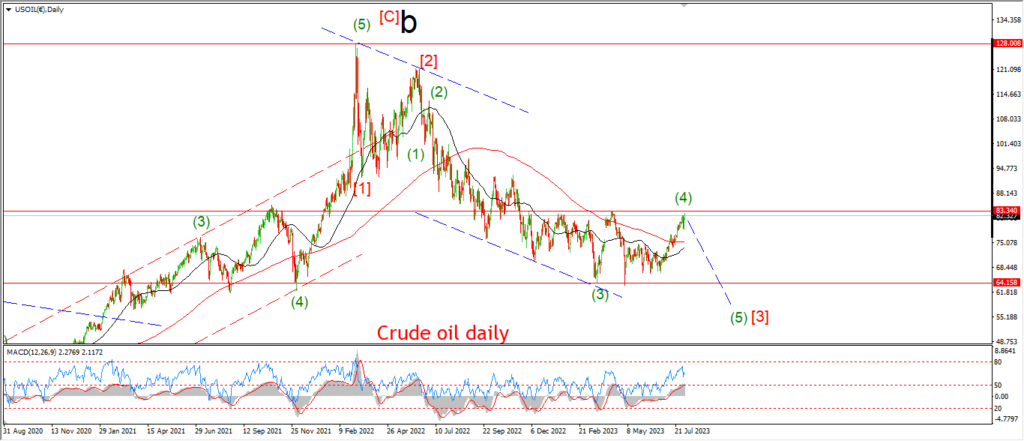
If this count is not correct for wave [ii] green,
then it will break tomorrow,
and I will have to switch to the alternate count for wave (4) green as shown on the daily chart.
Tomorrow;
If this pattern is going to break in wave [ii],
then the sooner it breaks, the better.
83.38 is the key level for wave [ii].
So lets see if it can hold or if the invalidation of wave [ii] comes tomorrow.
S&P 500.
S&P 500 1hr
S&P 500 4hr
S&P 500 daily.
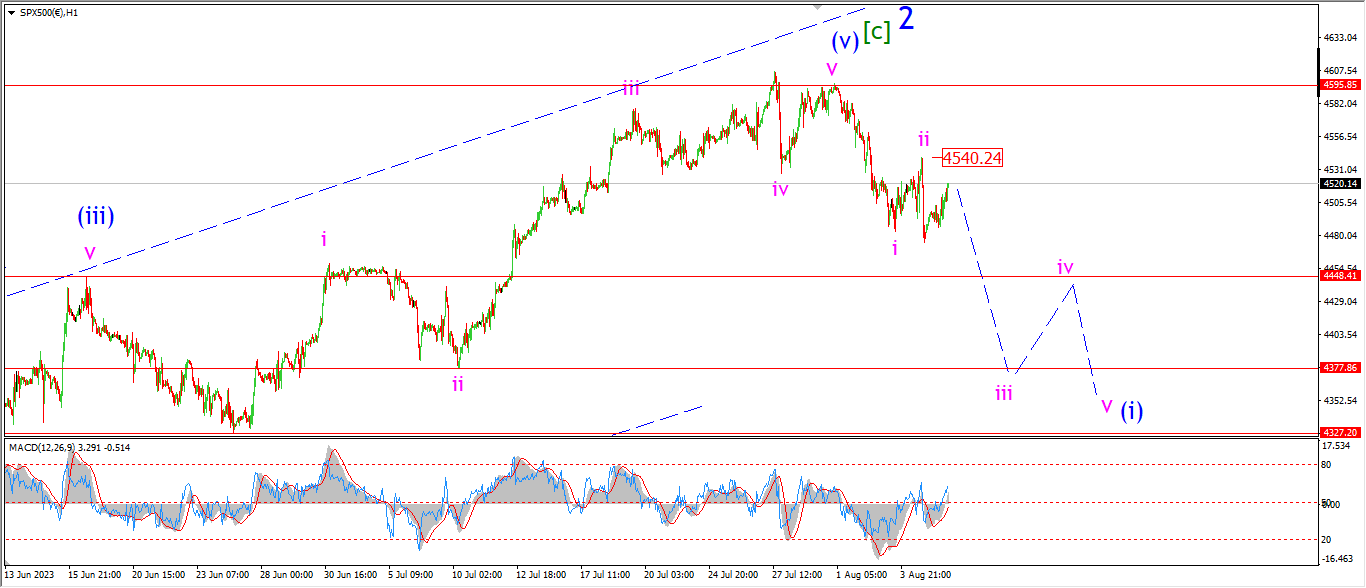
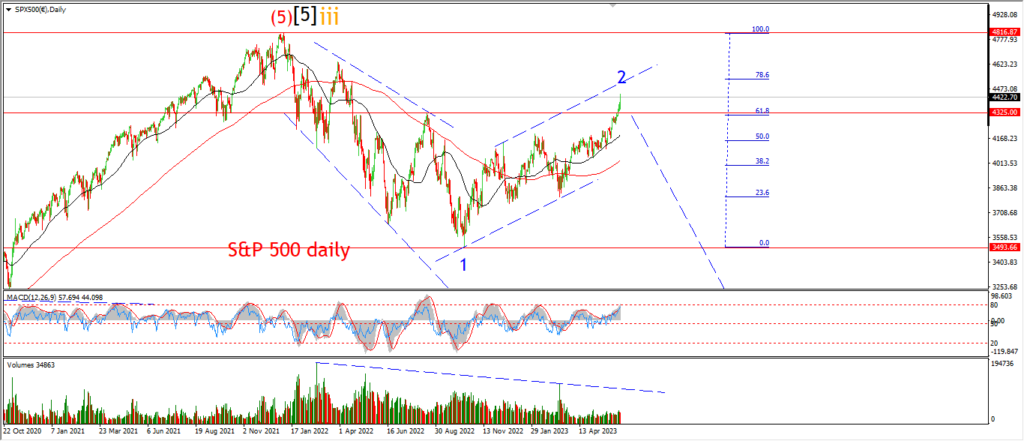
The S&P managed a small retracement higher this evening but the high at wave ‘ii’ continues to hold.
Wave ‘ii’ lies at 4540.
That level must hold as wave ‘iii’ down develops in five waves itself.
And I am looking for a break of 4448 pretty soon in wave ‘iii’ of (i).
A break of that support will not prove me right here,
but if a decline comes,
and it is an impulsive decline,
that will give the short term count a boost for sure.
Tomorrow;
I am looking at this period as a lesson in patience!
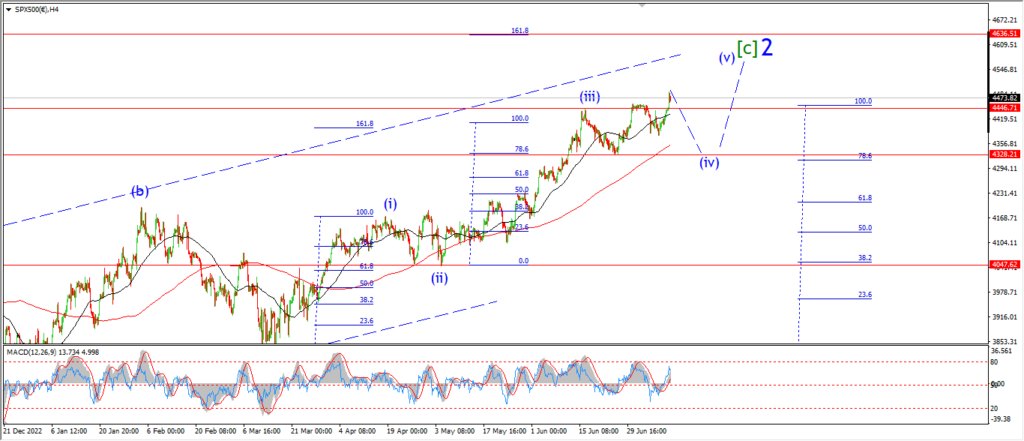
Proving the top of wave ‘2’ blue is really dragging on here.
But wave ‘3’ down will be quite a thing to behold when it does arrive.
So,
lets give this idea another few days to see if the pattern can take hold.
SILVER.
SILVER 1hr
SILVER 4hr.
SILVER daily.
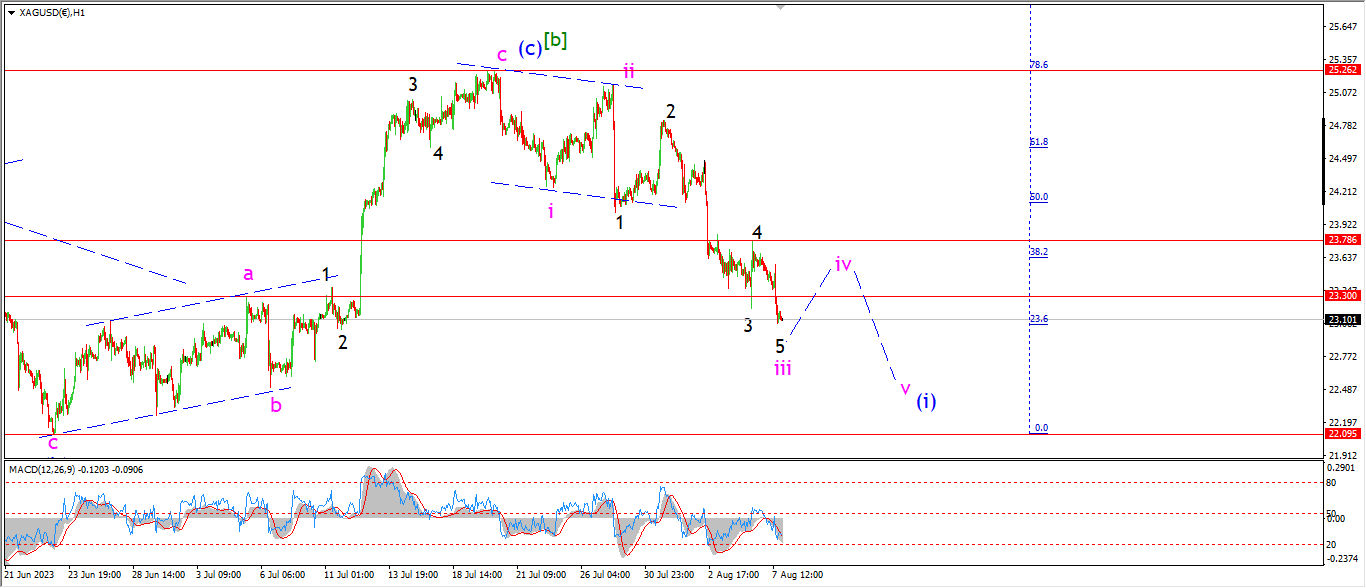
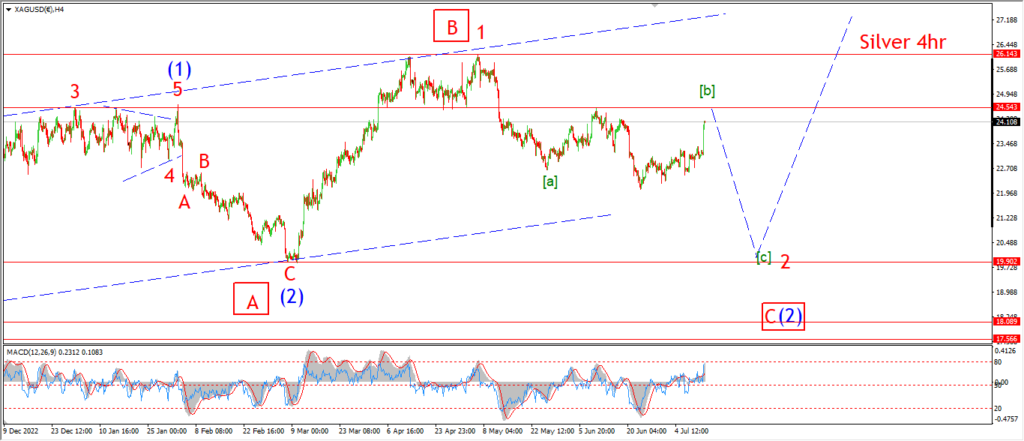
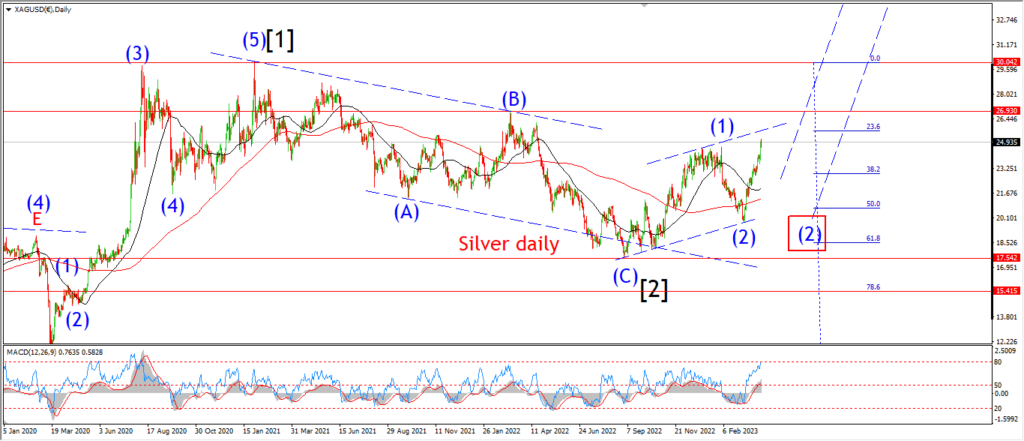
Silver has turned lower today to break below 23.30 again.
The price is now holding below initial support today,
and the lower support at 22.09 down not look so out of reach now.
It looks like wave ‘iii’ of (i) has now completed an internal five wave pattern here.
There may be more downside left to complete wave ‘iii’,
but that wave has now achieved the minimum at least.
Tomorrow;
Watch for wave ‘iii’ down to complete soon.
wave ‘iv’ should then turn higher in three waves.
I am suggesting 23.78 as an initial target for wave ‘iv’.
BITCOIN
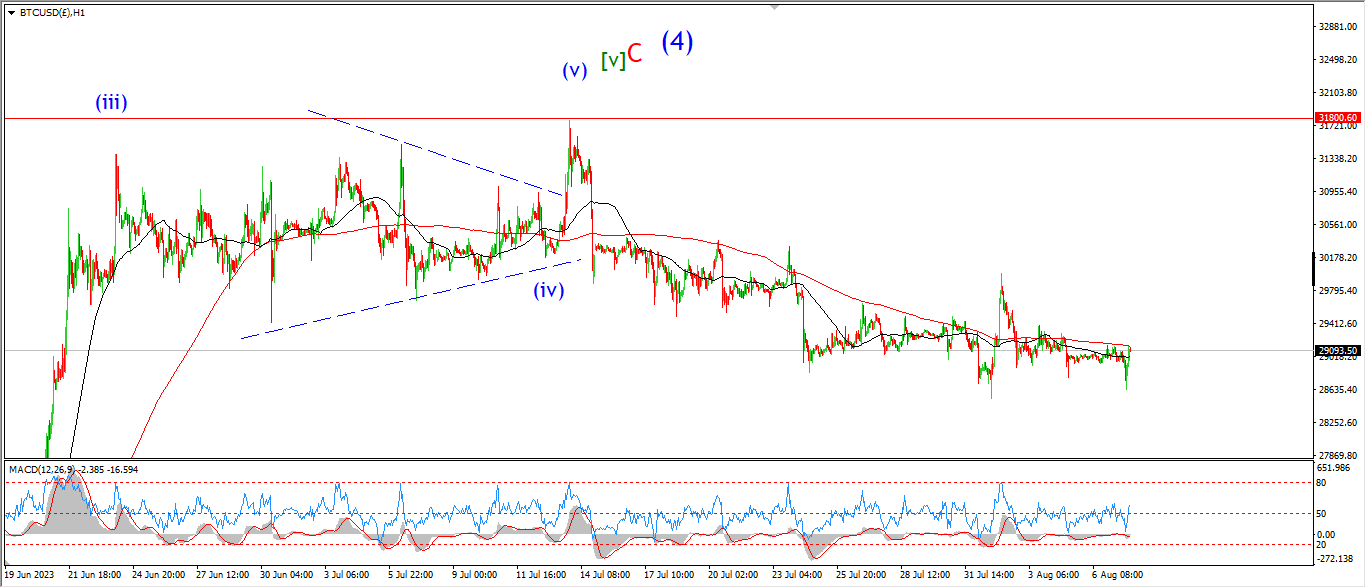
BITCOIN 1hr.
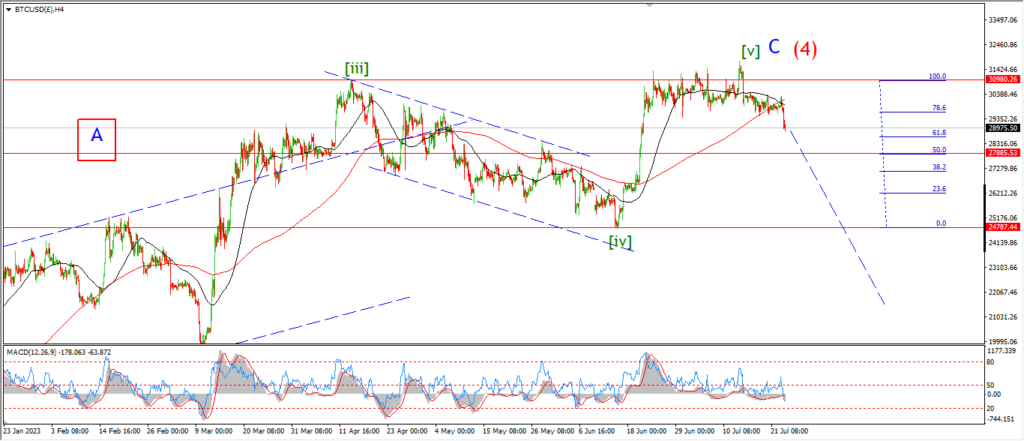
BITCOIN 4hr.
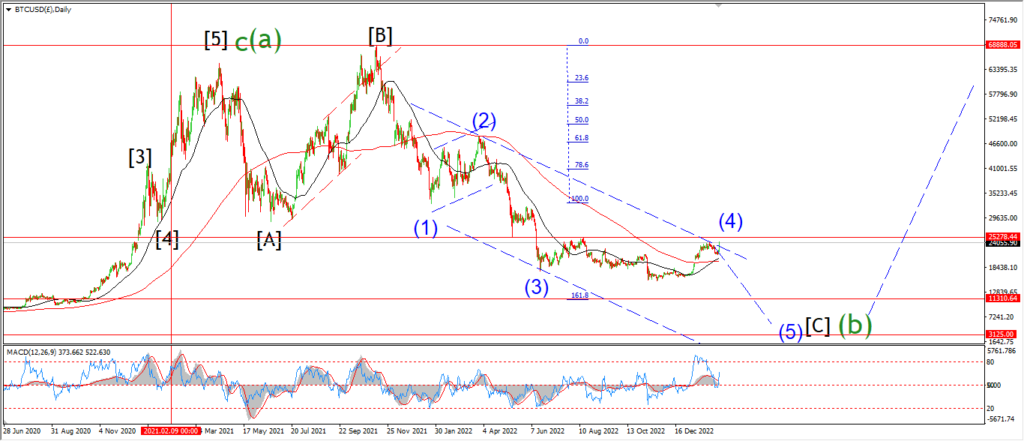
BITCOIN daily.
….
FTSE 100.
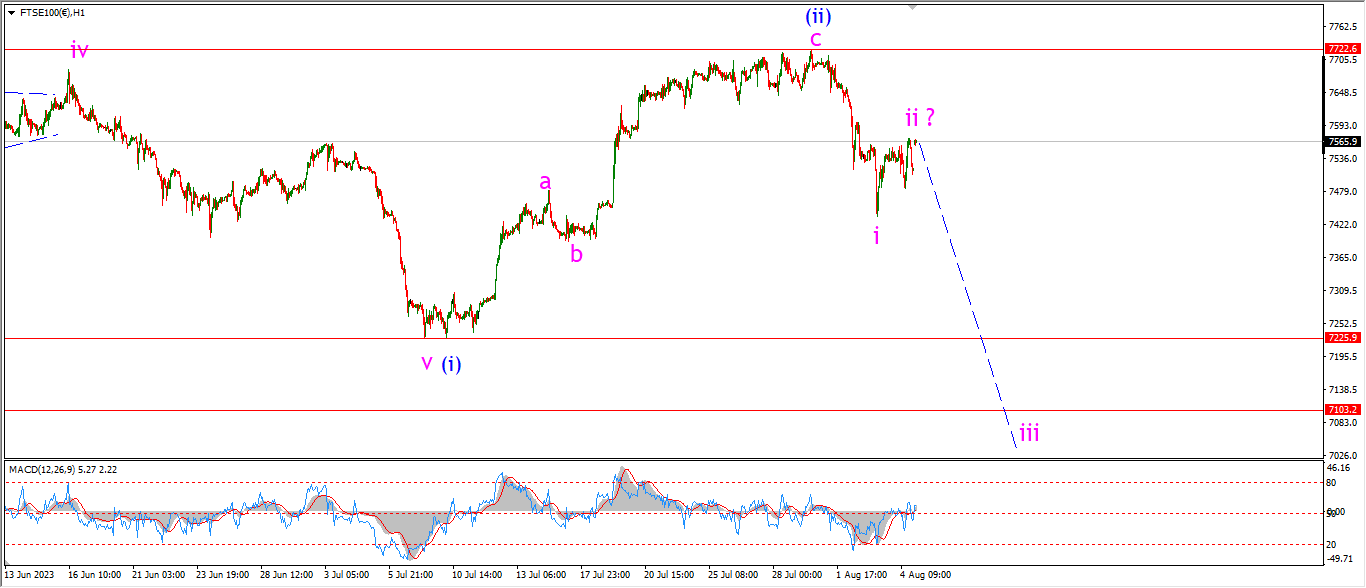
FTSE 100 1hr.
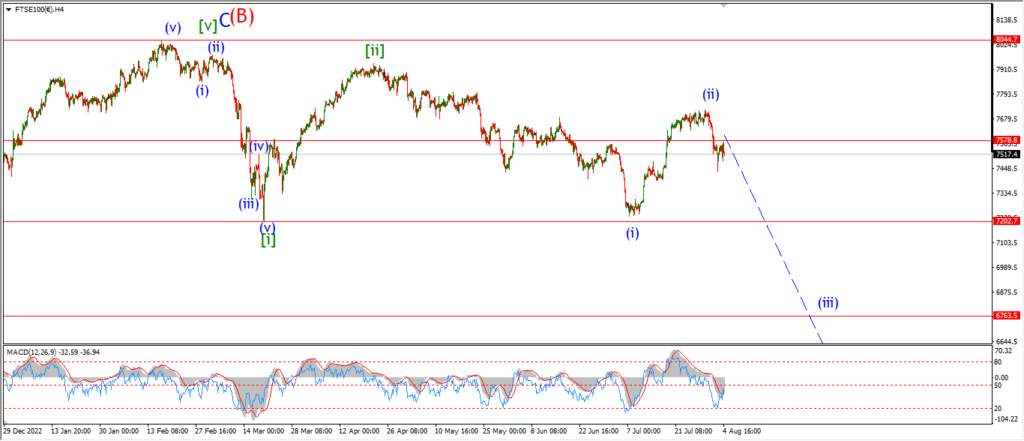
FTSE 100 4hr.
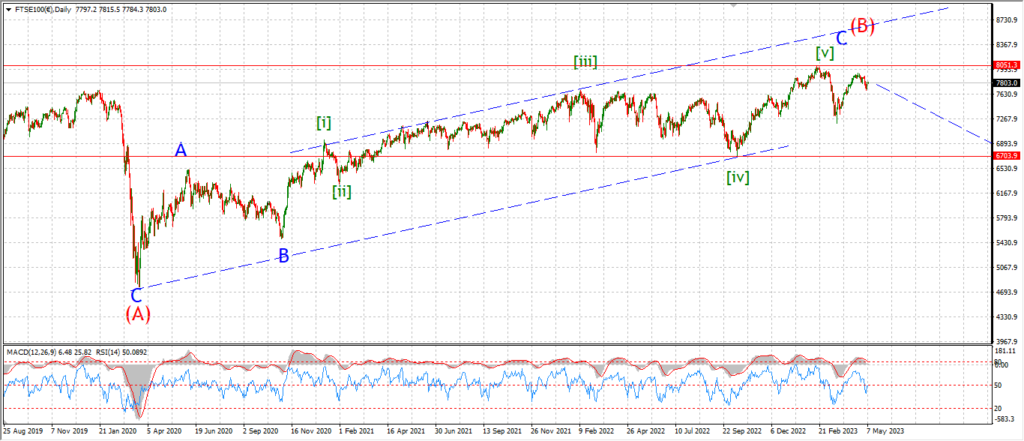
FTSE 100 daily.
….
DAX.
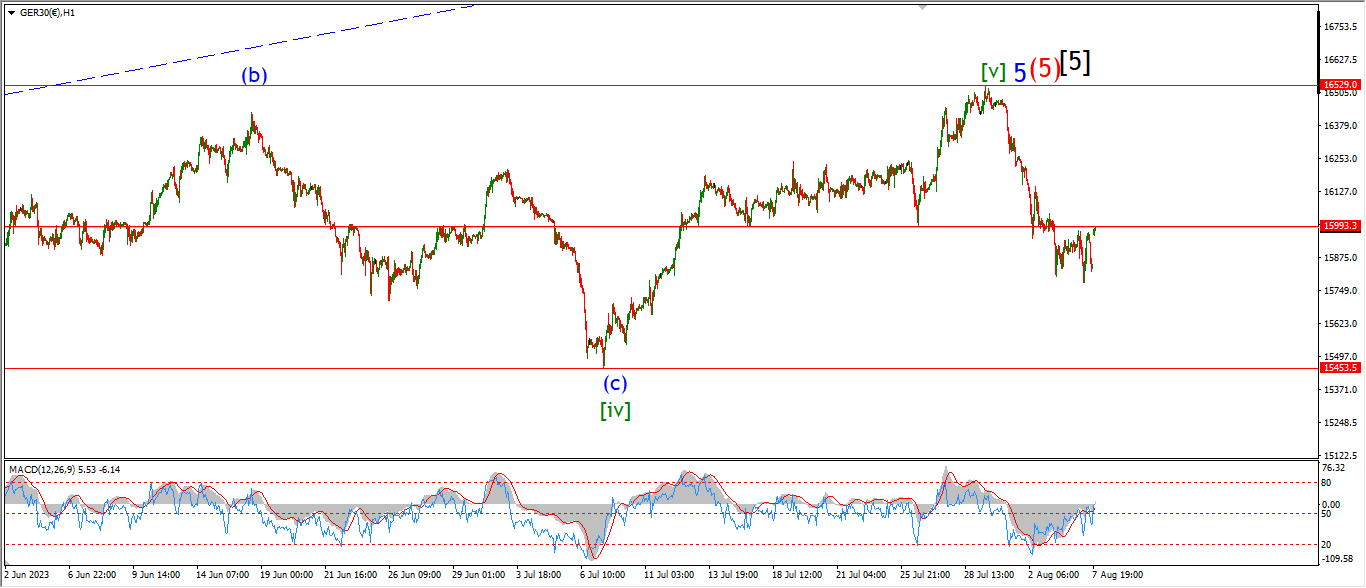
DAX 1hr
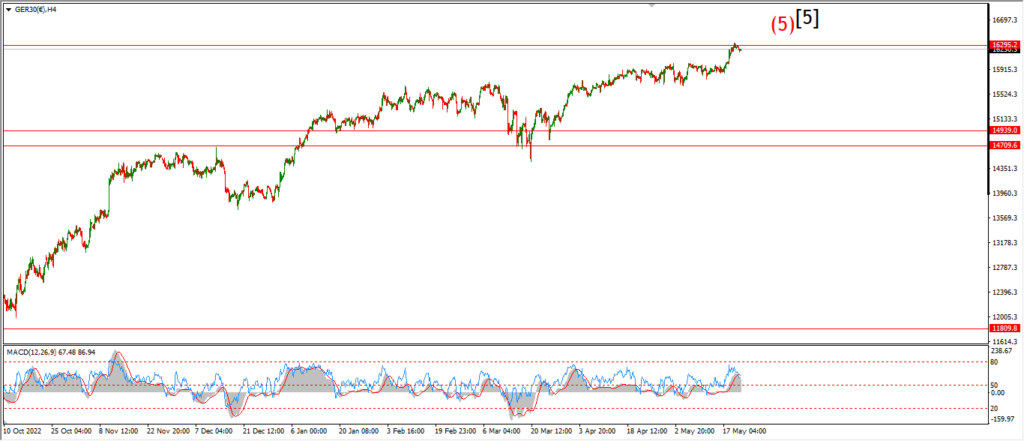
DAX 4hr
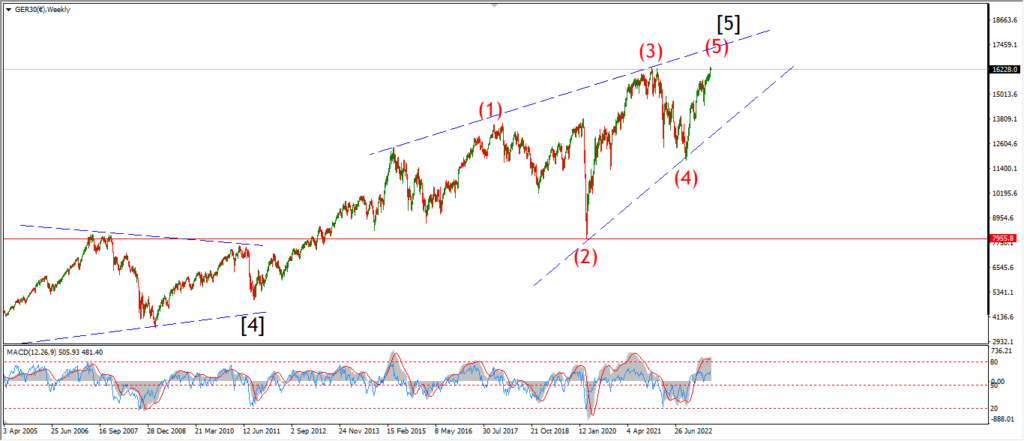
DAX daily.
….
NASDAQ 100.
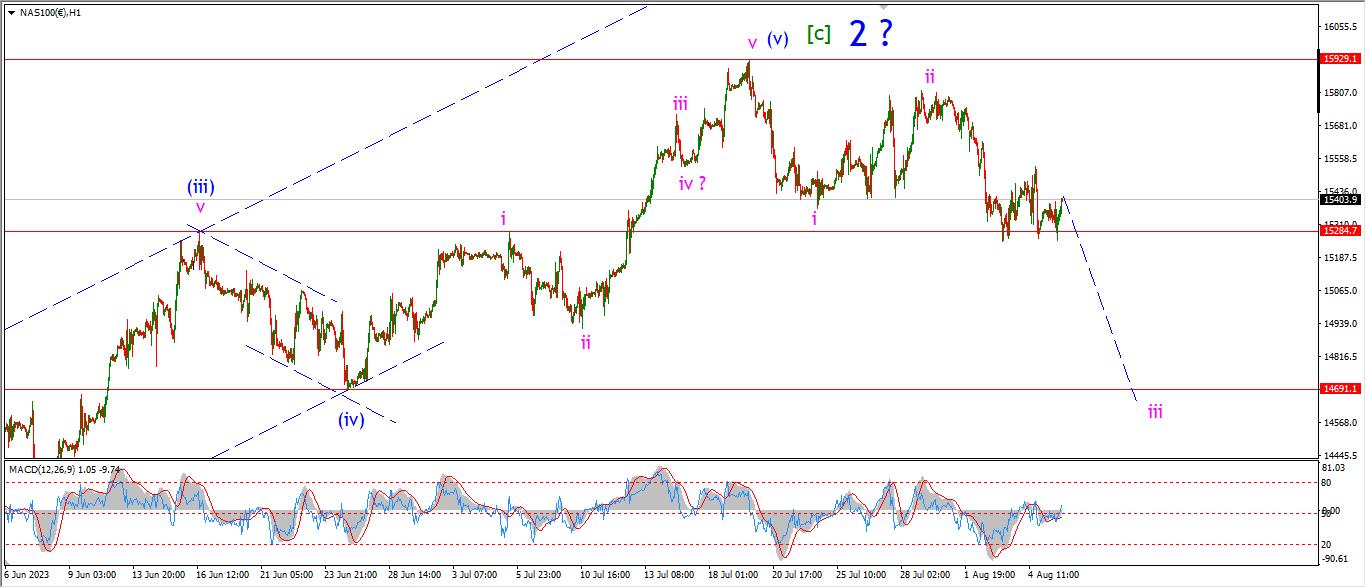
NASDAQ 1hr

NASDAQ 4hr.
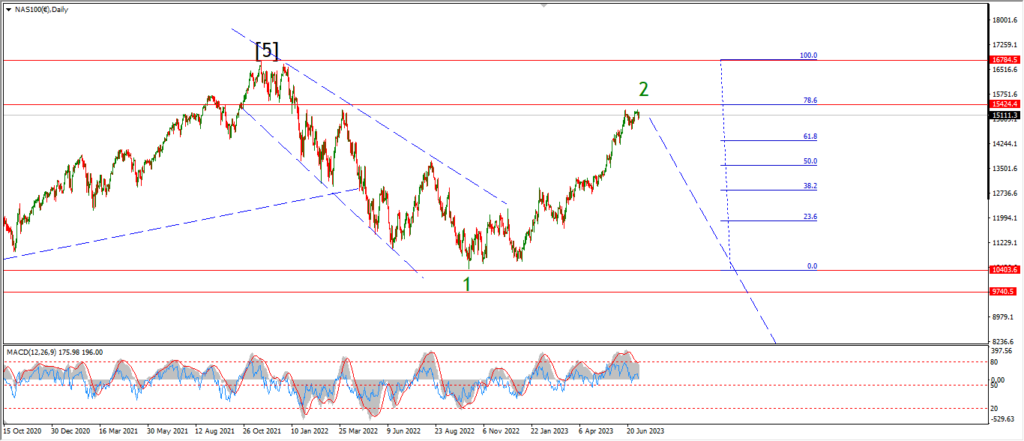
NASDAQ daily.
….