
Good evening to one and all, the Lord’s Blessings to you tonight.
No nightly updates next week, 17th – 21st of July.
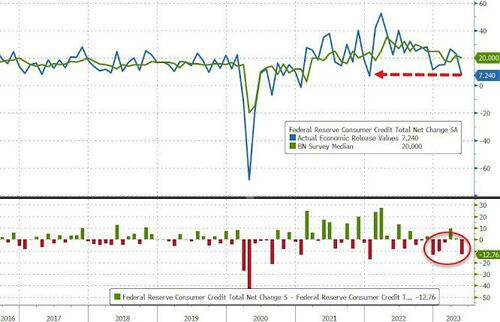
Shocking Drop In Auto Loans Results In Weakest Consumer Credit Print Since 2020
Take a look at what just happened in long term credit, we are now in DEFLATION!

https://twitter.com/bullwavesreal
EURUSD.
EURUSD 1hr.
EURUSD 4hr.
EURUSD daily.
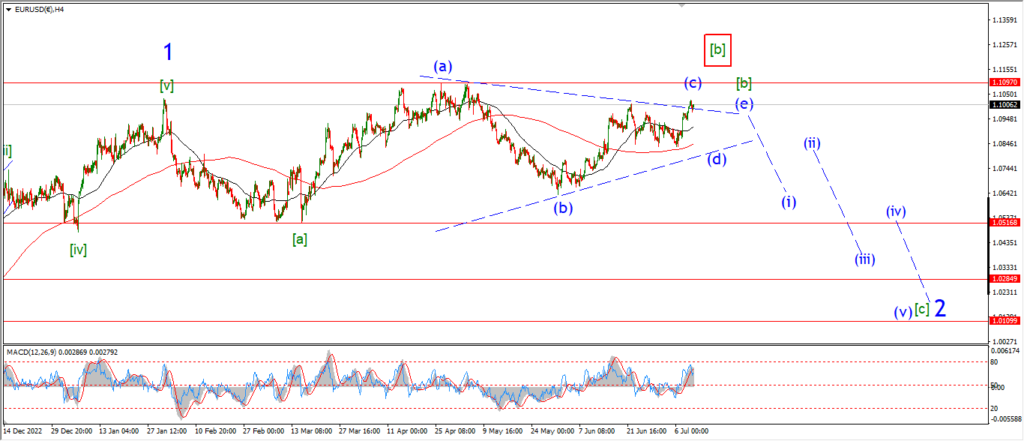
I want to point to the 4hr chart first tonight.
The invalidation line for the main count lies at 1.1097.
The triangle wave [b] will be ruled out if the price breaks that level.
There is another very reasonable count which will allow for that top to be broken in wave [b] green.
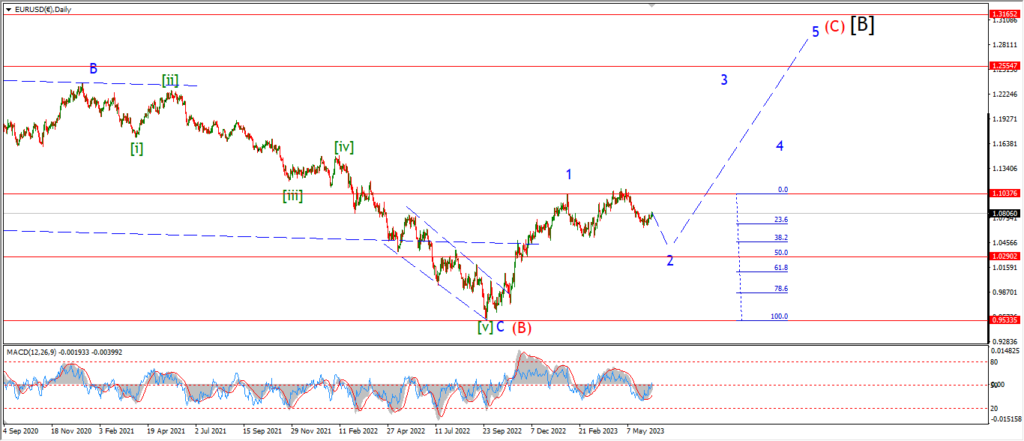
If wave ‘2’ is an expanded flat correction,
then wave [b] can make a new high before turning sharply lower into wave [c].
I will keep this count in mind as we go forward.
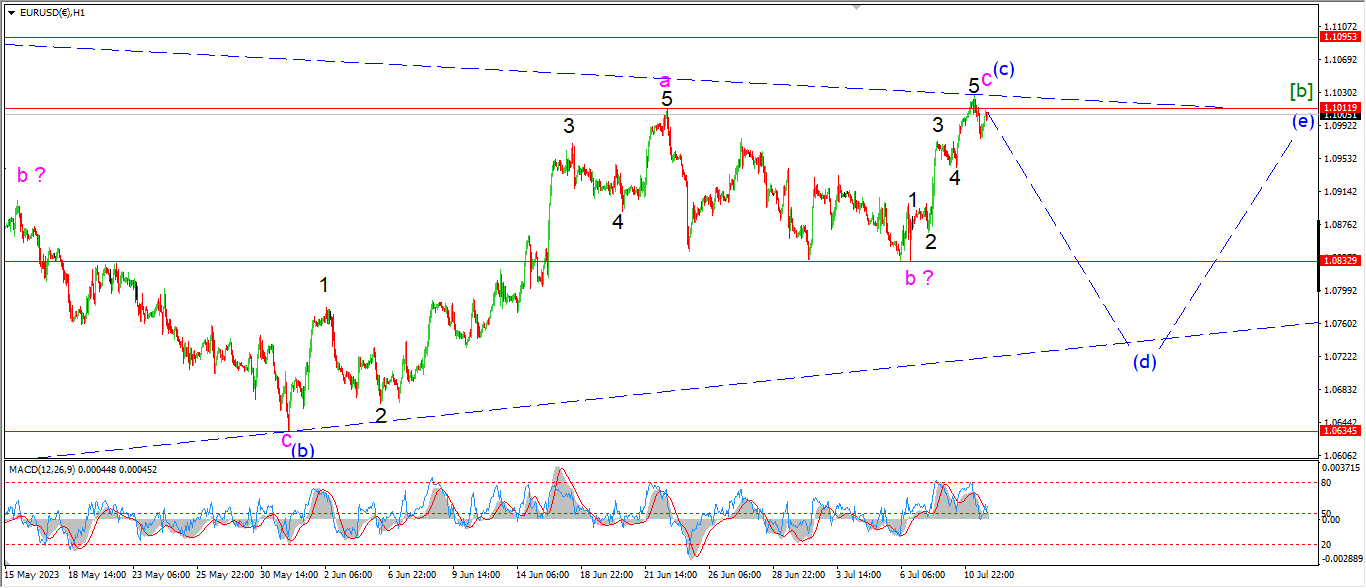
the main triangle count for wave [b] has changed today as the price made a very small new high.
This new top is labelled as wave (c) of [b] again.
And wave (d) should turn lower in three waves before the end of this week.
Tomorrow;
Five waves up in wave ‘c’ of (c) is in place now.
so this triangle wave [b] will now be put to the test again off this top.
A decline in three waves to complete wave (d) is what the pattern requires.
Lets see if 1.1095 can hold and then wave (d) can turn lower again.
GBPUSD
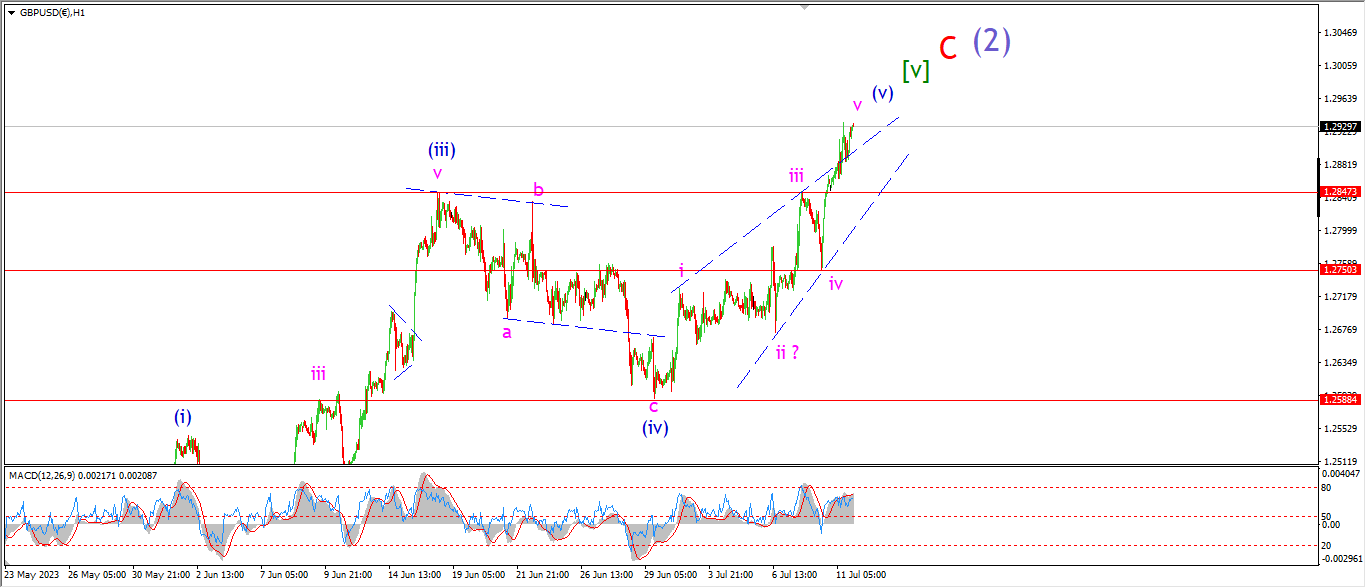
GBPUSD 1hr.
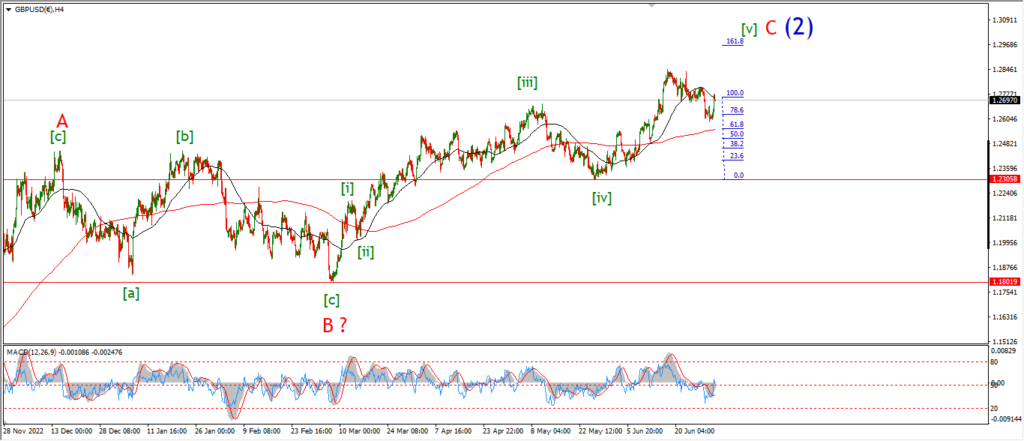
GBPUSD 4hr.
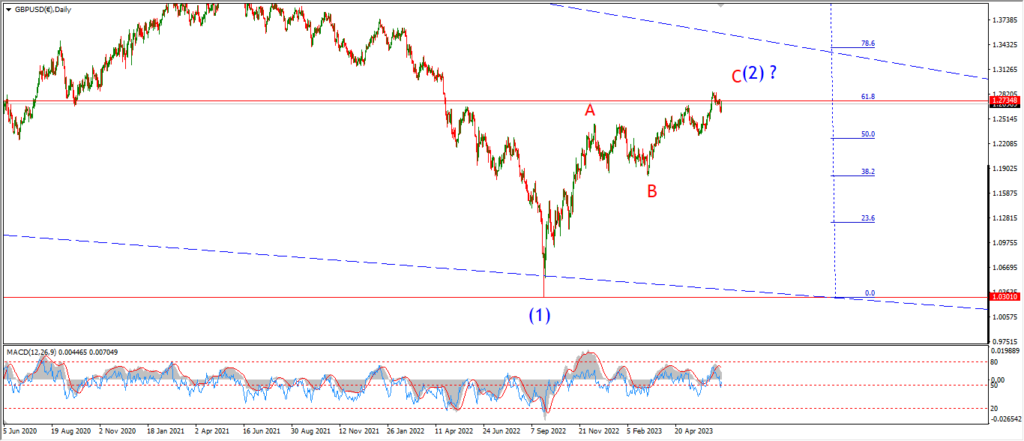
GBPUSD daily.
Its been a choppy few weeks in cable now as the market worked its way higher into wave (v) of [v].
The pattern itself in wave (v) has several overlaps within it,
and this has caused a significant slowing in momentum in this fifth wave.
As far as I can see,
this pattern is done here in wave [v] of ‘C’ of (2).
Of course this is a very high degree top we are looking at here,
and in reality the price may take a while to put in that first significant lower high to begin wave (3) down.
As you can see on the 4hr chart,
the first level of interest lies at 1.2450 at the previous wave ‘A’ high.
But only a break of 1.1800 at wave ‘B’ will confirm that the market is finally turning into wave (3) down.
Tomorrow;
It looks like this wedge pattern in wave (v) of [v] is now done.
Soon it will be time to look for wave (2) to top and turn lower into wave (3).
USDJPY.
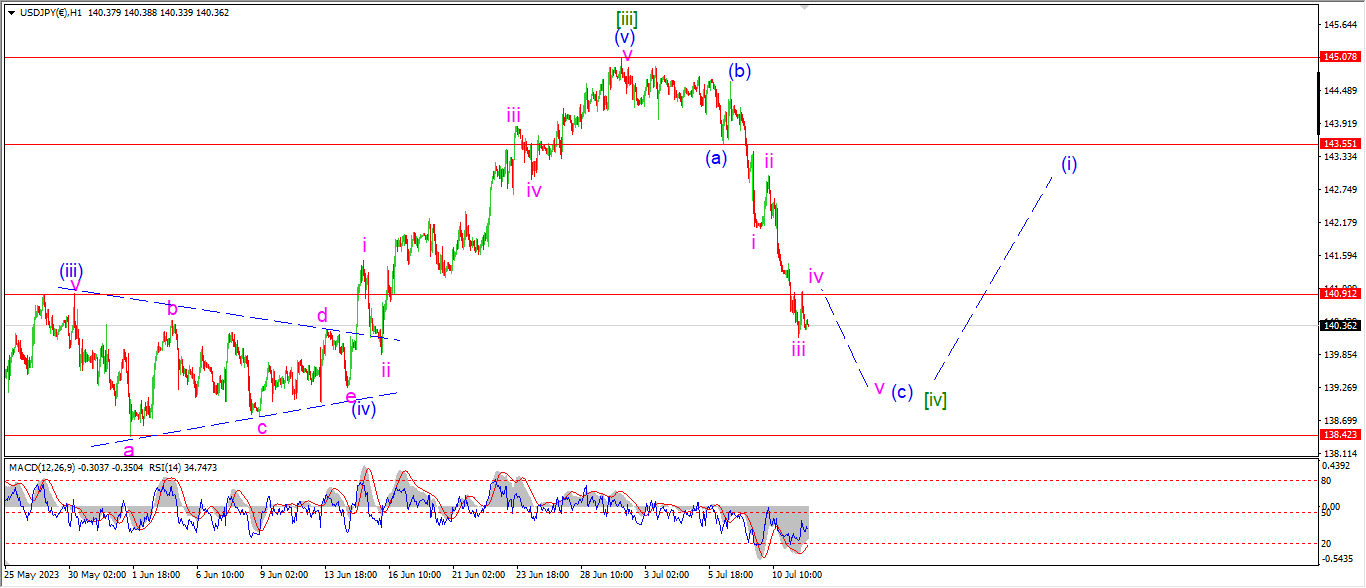
USDJPY 1hr.
USDJPY 4hr.

USDJPY daily.
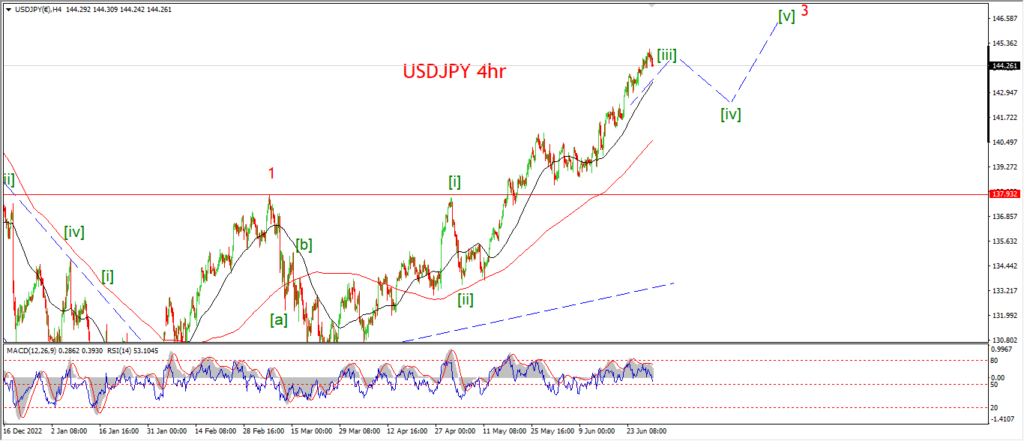
The other 2 markets are hunting for a topping pattern now,
And on the flip side,
USDJPY is getting very close to a low in a fourth wave here.
The price has dropped again today and broken into the territory of the previous wave (iv) triangle.
This decline has now gone far enough to signal that the pattern is actually moving at a higher degree.
wave (c) of [iv] has accelerated far enough to consider this new pattern now.
And the pattern in wave (c) is tracing out a five wave pattern lower itself.
I am suggesting that wave ‘iv’ of (c) is correcting sideways today.
And wave ‘v’ of (c) should then turn down again later this week.
the lower end of wave (iv) blue lies at 138.43,
and this level marks the low end of the target area for wave [iv] green.
We will get down there pretty quickly at this rate.
Tomorrow;
Watch for wave ‘iv’ to complete at correction in three waves.
Wave ‘v’ will turn lower again later this week.
DOW JONES.
DOW 1hr.
DOW 4hr
DOW daily.
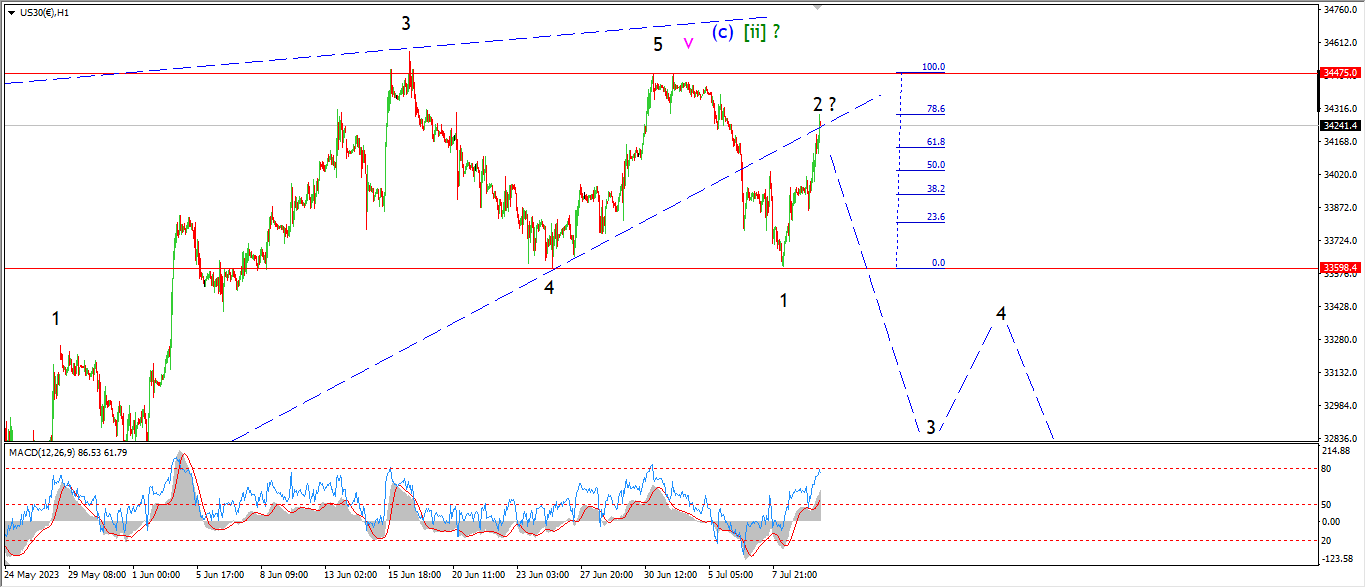
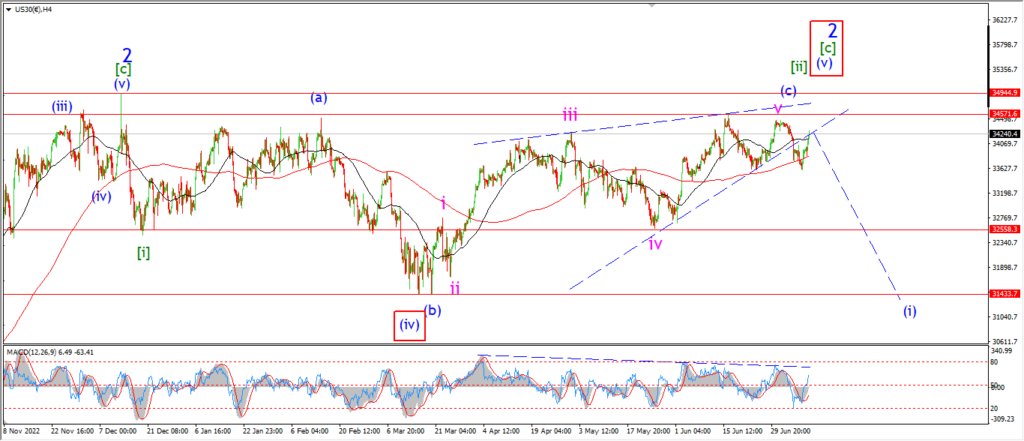
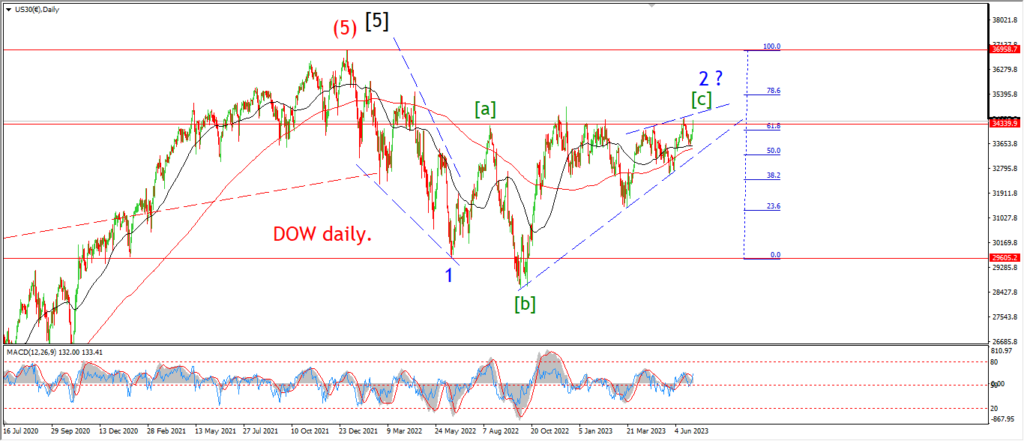
The market pushed higher today but the lower high continues to hold here for wave ‘2’.
the price has traced out three waves up into this high.
And I expect tomorrows action will make or break this wave count.
A sharp decline in wave ‘3’ will really boost the reversal idea.
But if the price continues to make its way higher to threaten the recent highs again,
that will invalidate this short term count for sure.
Tomorrow;
Watch for wave ‘2’ to hold that lower high below the rising trend line.
A sharp drop to break 33600 again will signal wave ‘3’ of ‘i’ is underway.
GOLD
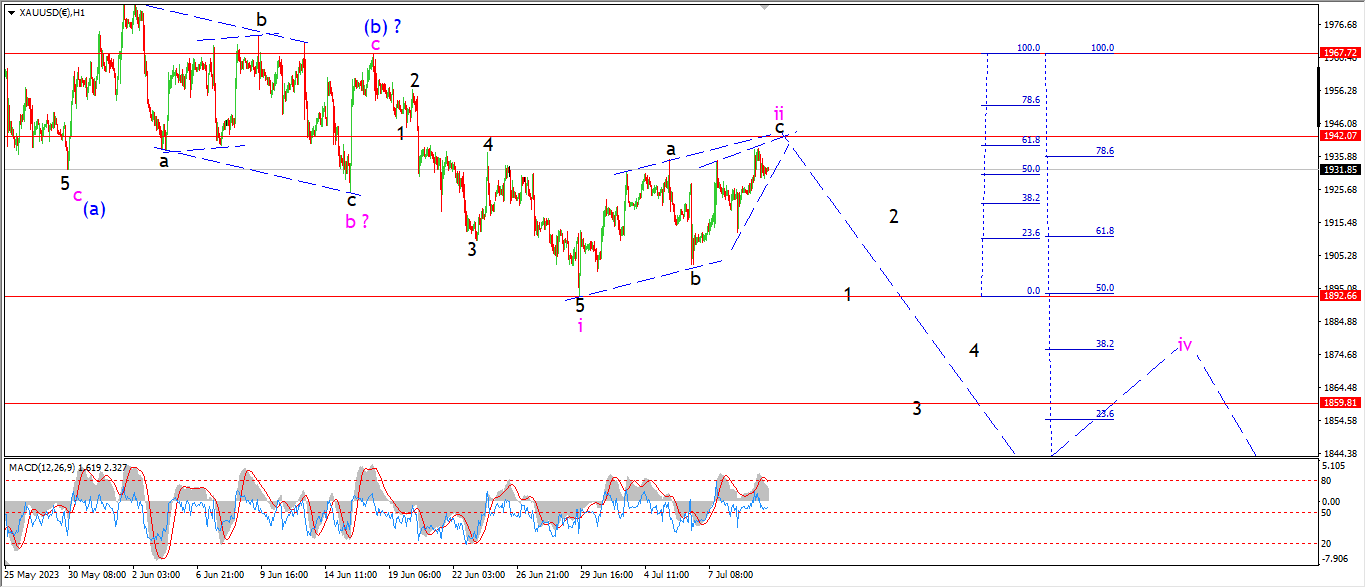
GOLD 1hr.
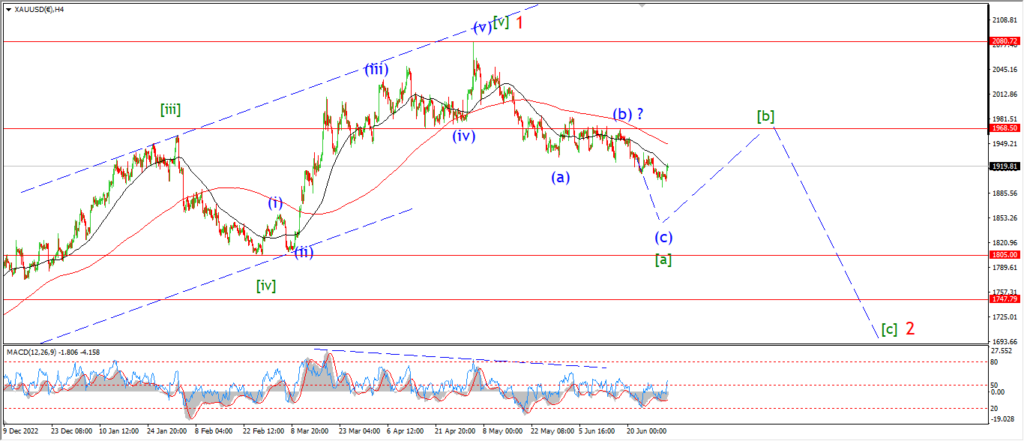
GOLD 4hr.

GOLD daily.
I am still happy with the idea that wave ‘c’ of ‘ii’ is ongoing.
The price has pushed out to a new high for this pattern today.
But the internal action of wave ‘c’ has the appearance of an ending diagonal now.
This does explain the choppy nature of the rise this week.
Tomorrow;
If this pattern is correct,
then wave ‘c’ will push higher once more into that point at the top of the wedge
to complete the larger wave ‘ii’ near 1942.
Wave ‘1’ of ‘iii’ must then turn lower again to break 1892.
CRUDE OIL.
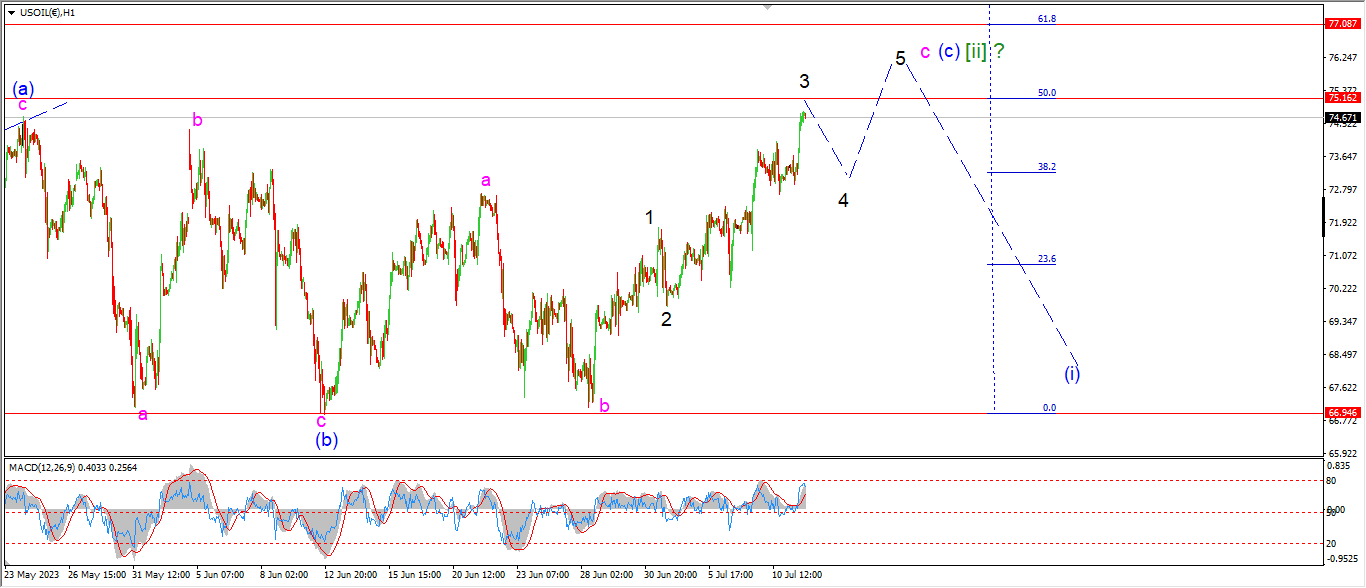
CRUDE OIL 1hr.
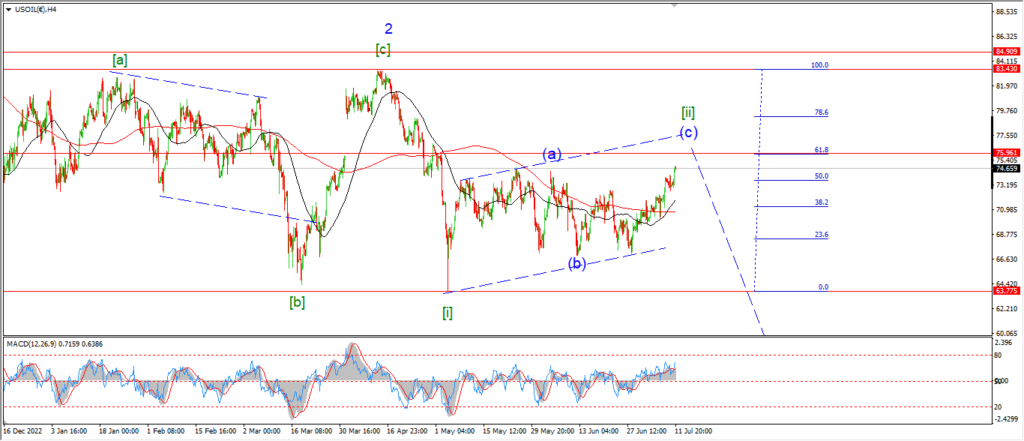
CRUDE OIL 4hr.
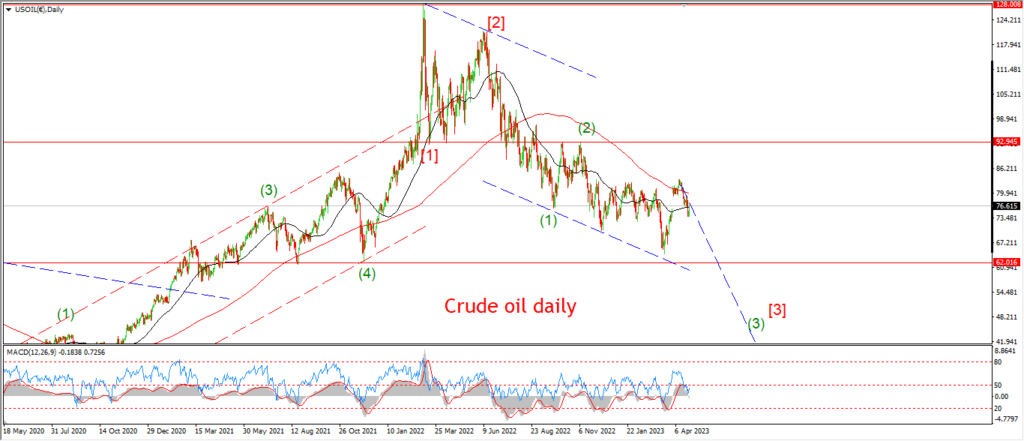
CRUDE OIL daily.
The convoluted pattern in wave [ii] continues for another week it seems.
The price pushed out to a new high above recent resistance today.
and that has invalidated the previous count for wave [ii].
The new wave count for wave [ii] suggests a complex triple combination wave.
Where each sub wave traces out three waves to complete a 3,3,3 pattern overall.
The current rally in wave (c) of [ii] is close to hitting the 62% retracement level of wave [i] now.
and once that happens,
then I will look for a top to close out this pattern again.
Tomorrow;
Watch for wave ‘c’ of (c) to complete a five wave pattern as shown.
A break above the 50% retracement level at 75.16 is the first target.
With the upper band for wave ‘c’ at 77.08 at the 62% level.
S&P 500.
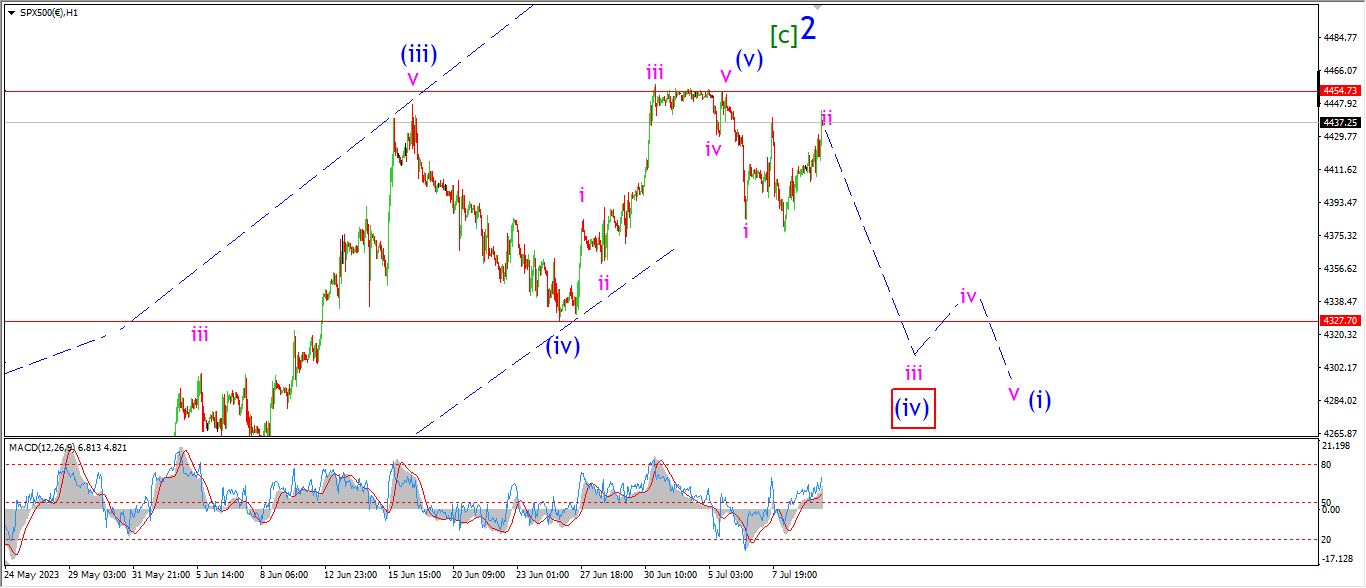
S&P 500 1hr
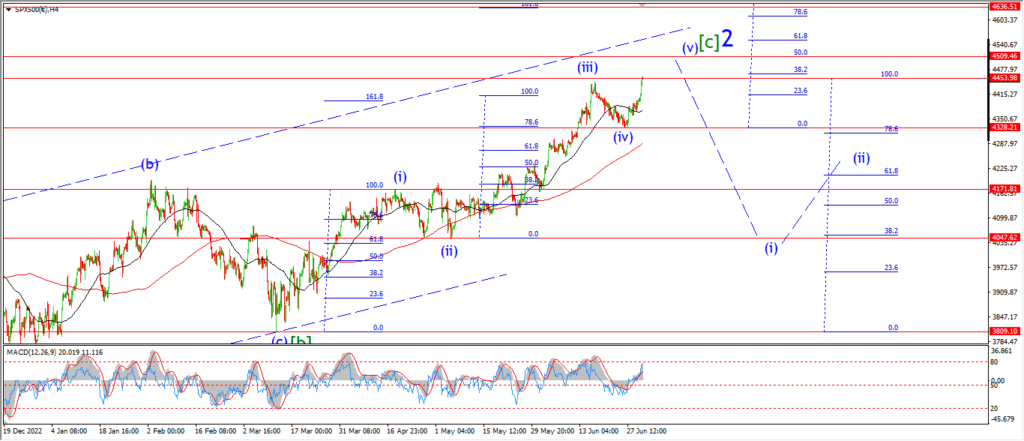
S&P 500 4hr
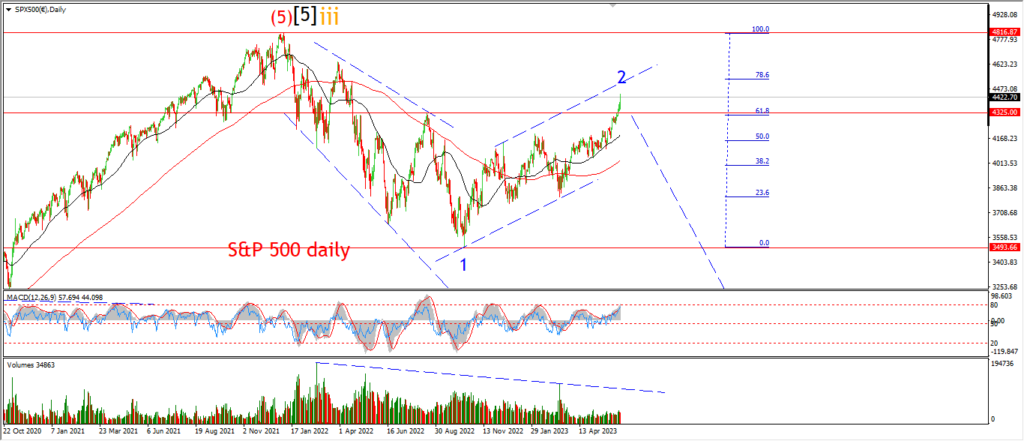
S&P 500 daily.
I am looking for a decline in the S&P in both the main and alternate counts here.
The main count suggests a decline in wave (i) of [i] of ‘3’.
And the alternate count suggests a decline in wave ‘c’ of (iv) now.
In both cases we should see a break of 4327 at a minimum.
The market did rebound today again but and the price is holding at a lower high below wave ‘2’.
I am suggesting that wave ‘iii’ of (i) should turn lower again and break 4327.
and once we see five waves down off the top of wave ‘2’,
that will signal a reversal is building again.
Tomorrow;
Watch for wave ‘ii’ to hold the lower high and turn down again into wave ‘iii’ of (i).
SILVER.
SILVER 1hr
SILVER 4hr.
SILVER daily.
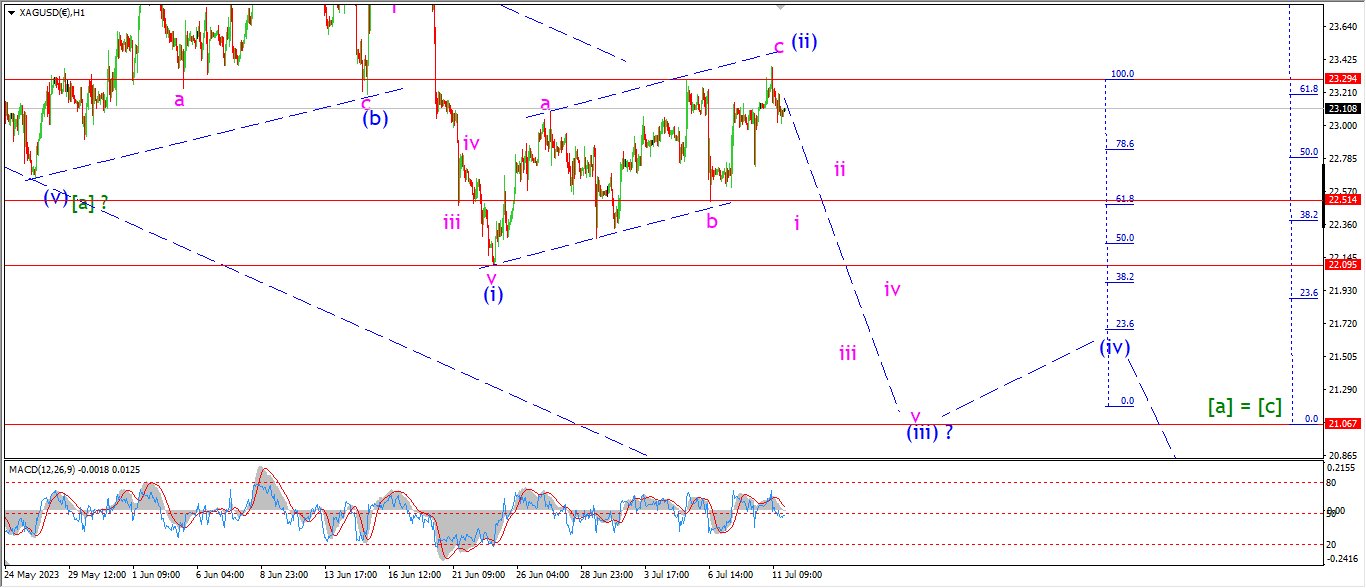
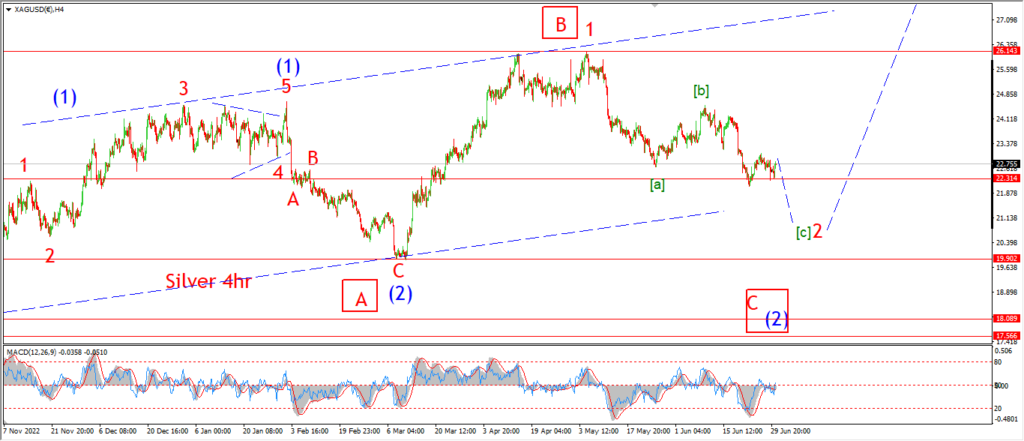
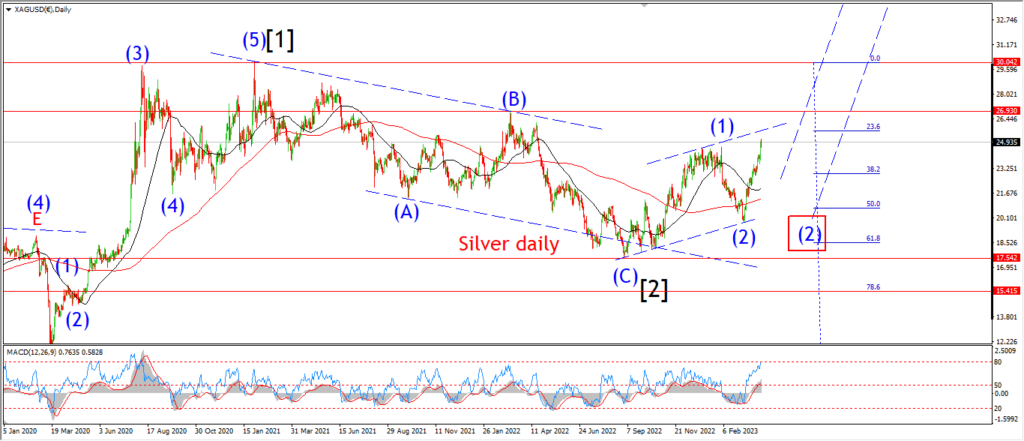
The corrective action continues in silver today also.
The price did break above the previous top at 23.29 today,
but overall I am happy to continue tracking this pattern as a correction rather than anything.
A decline off the top again today may even begin the much anticipatd wave (iii) acceleration.
A break below 22.50 again will signal wave (ii) is done and wave (iii) down has begun.
Tomorrow;
Watch for wave ‘c’ of (ii) to complete and then the initial drop into wave ‘i’ of (iii) should begin.
BITCOIN
BITCOIN 1hr.
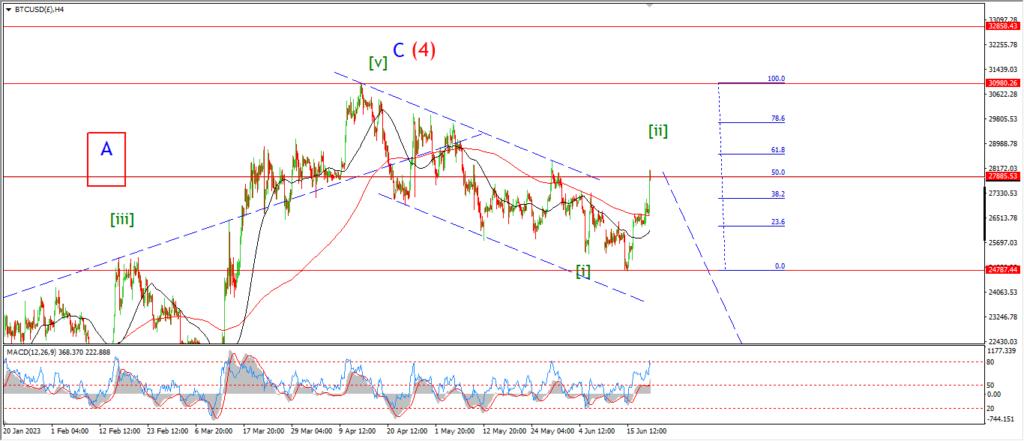
BITCOIN 4hr.
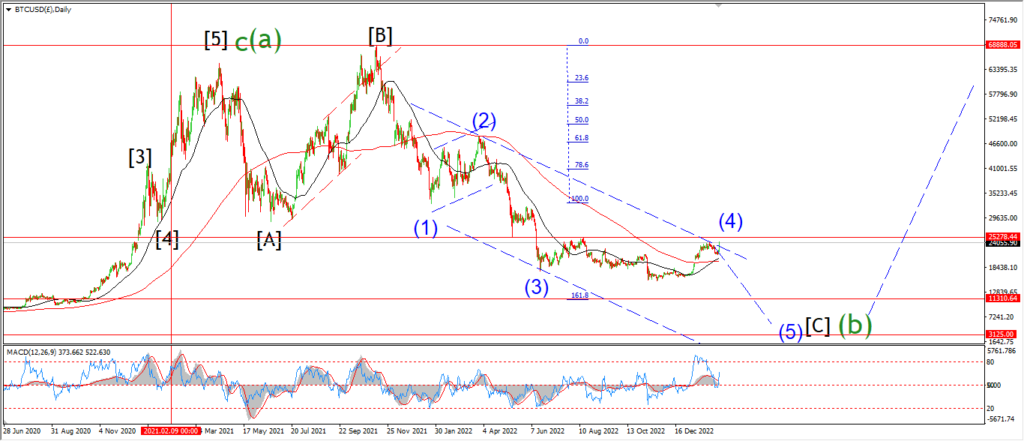
BITCOIN daily.
….
FTSE 100.
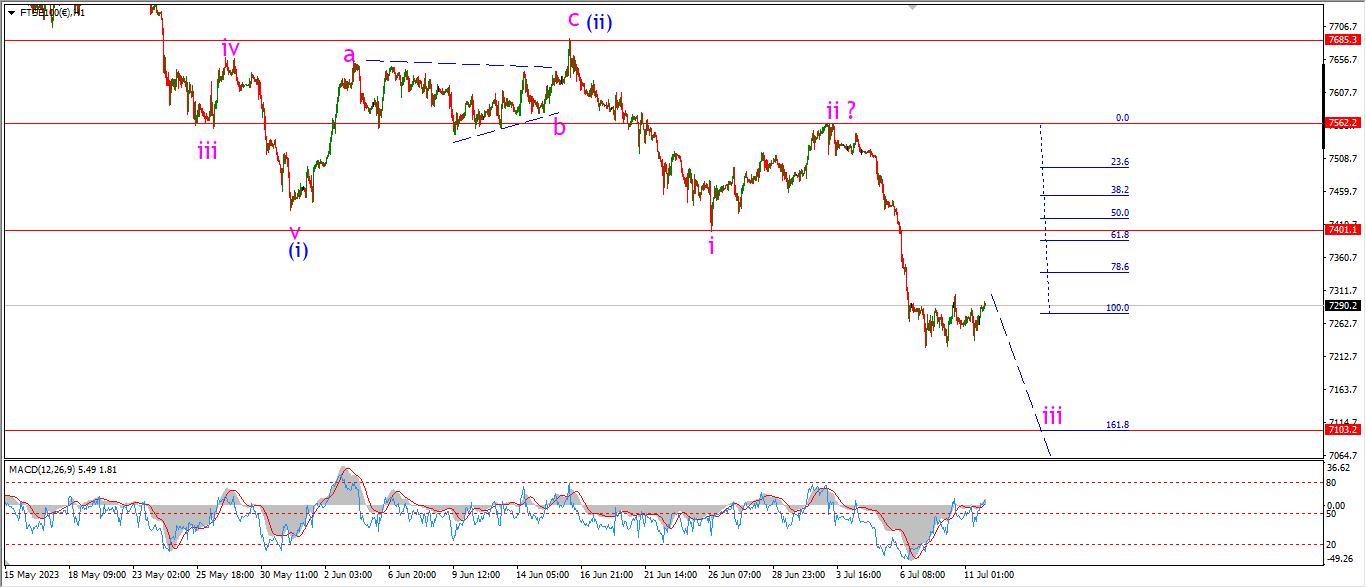
FTSE 100 1hr.
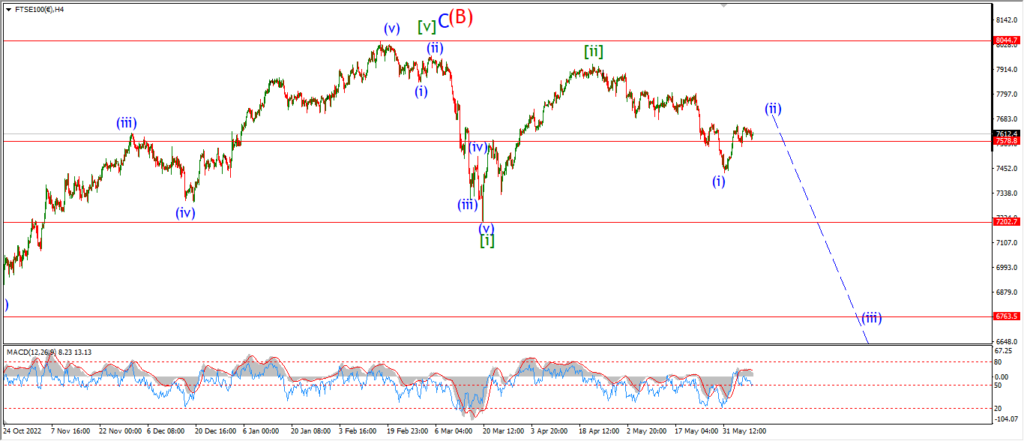
FTSE 100 4hr.
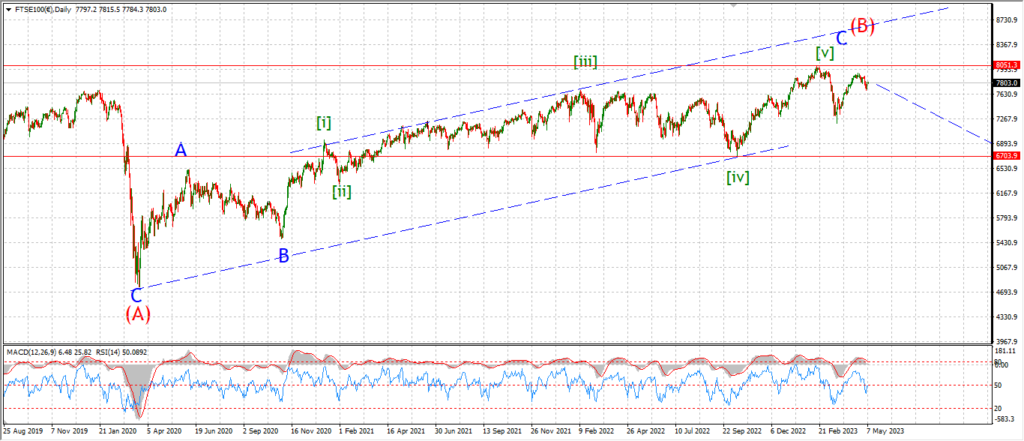
FTSE 100 daily.
….
DAX.
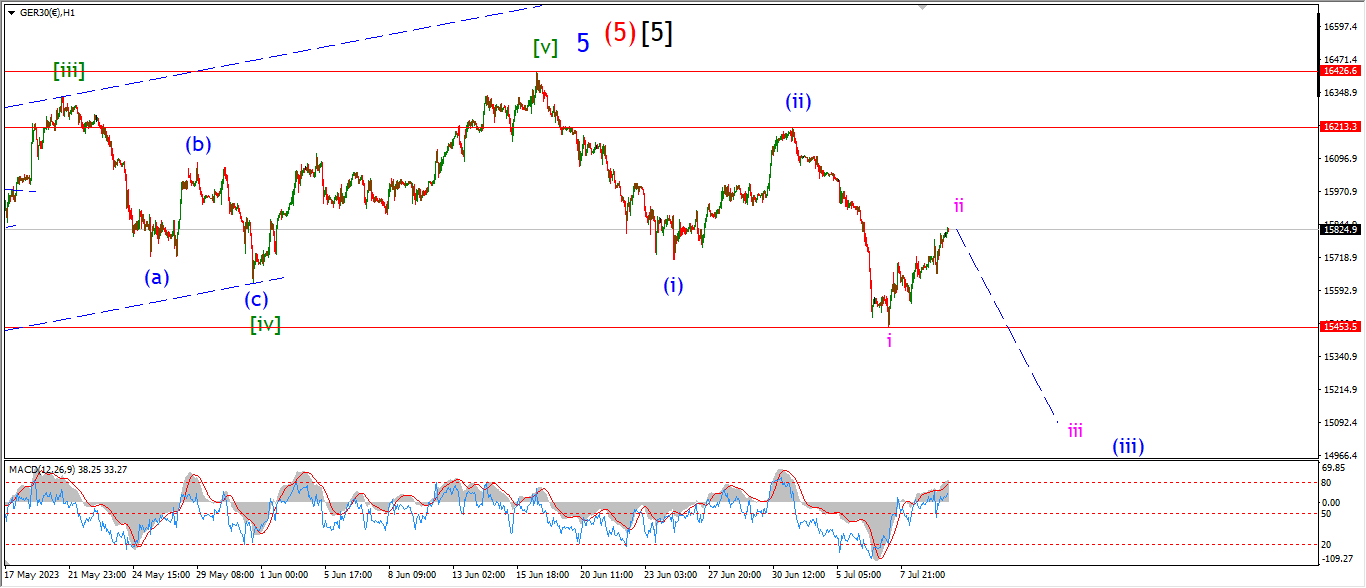
DAX 1hr
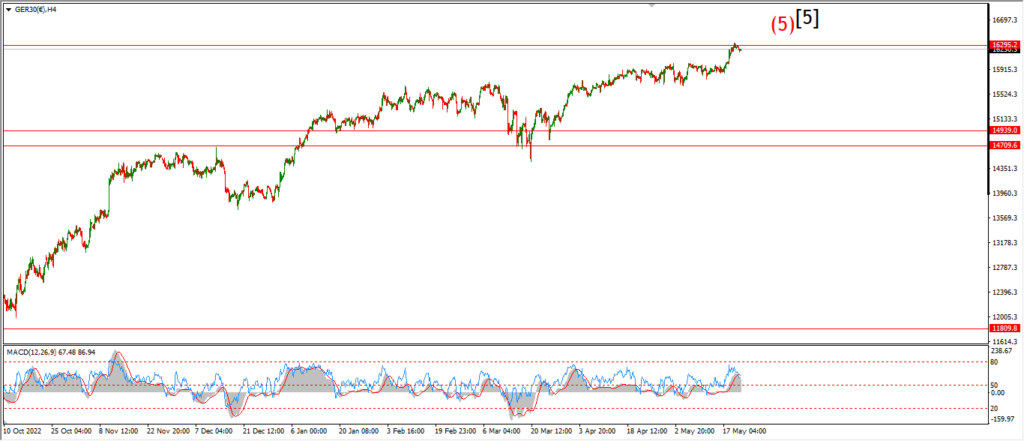
DAX 4hr
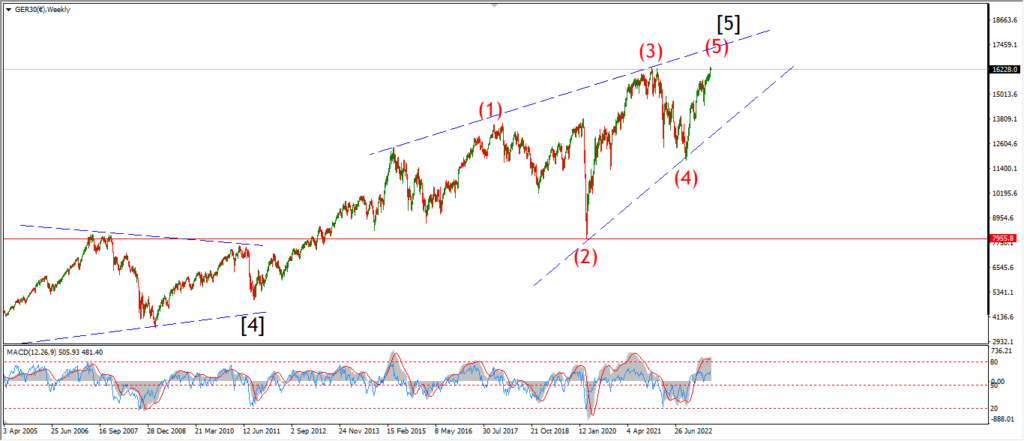
DAX daily.
….
NASDAQ 100.
NASDAQ 1hr

NASDAQ 4hr.
NASDAQ daily.
….