
Good evening to one and all, the Lord’s Blessings to you tonight.
I have been taking stock of the action this evening and I gotta say I’m a bit perplexed in a few places.
In many markets we have upside corrections continuing without faltering,
which is causing me some concern.
A double whammy in the USDX markets with the ECB pushing rates higher and the Fed holding ground.
This seems to have convinced the market that the euro is somehow a better bet!
well for today at least!
I have noticed that knee jerk reactions tend to be punished very quickly these days.
And I think that has something to do with the end of day options market.
That market makes up a huge percentage of the options market now.
and hence,
the knee jerk reaction cannot continue to the next day!
The market has a short term memory problem!
Ok,
here we go.
https://twitter.com/bullwavesreal
EURUSD.
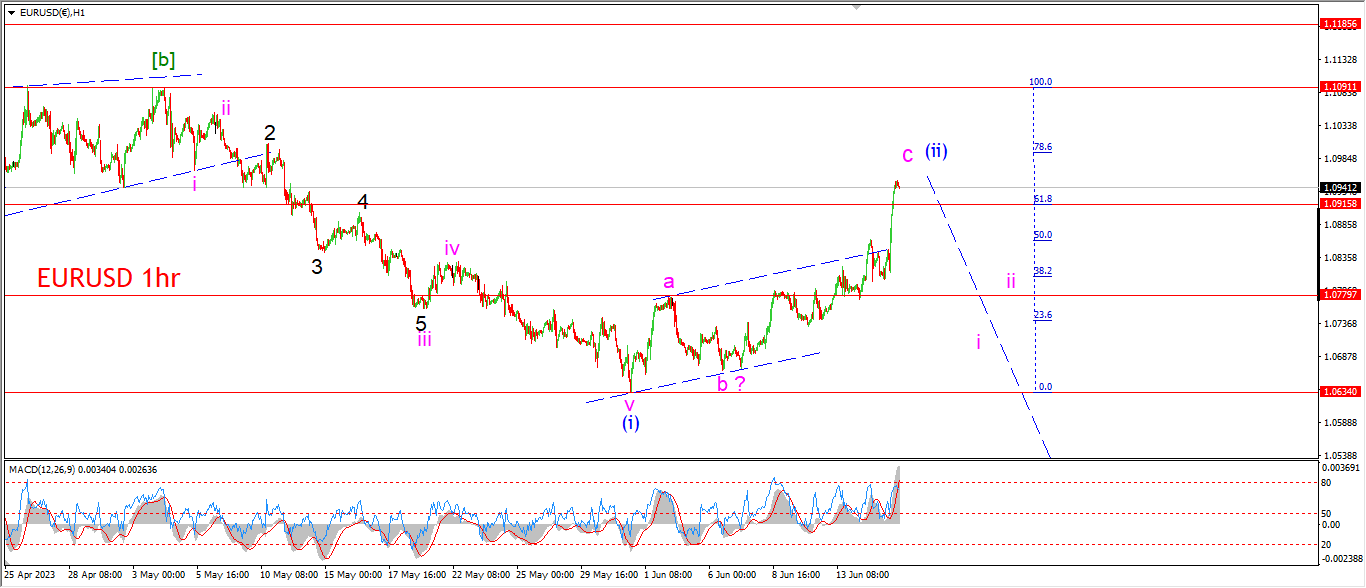
EURUSD 1hr.
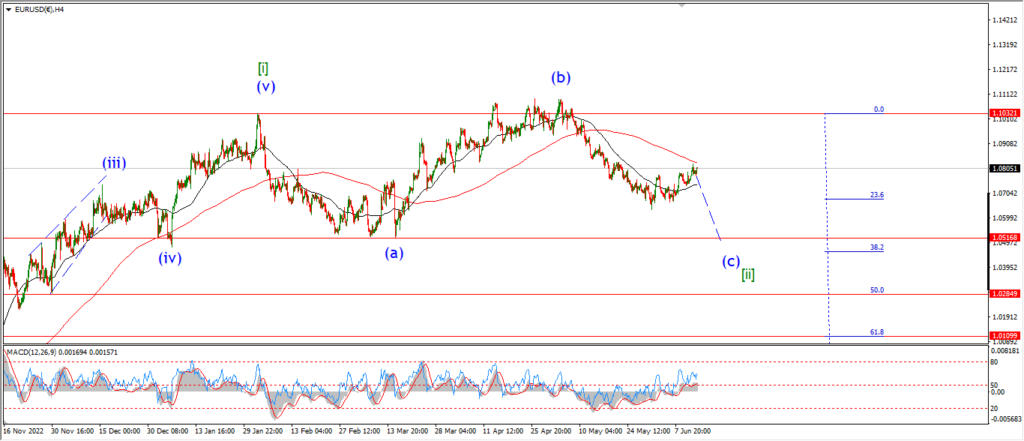
EURUSD 4hr.
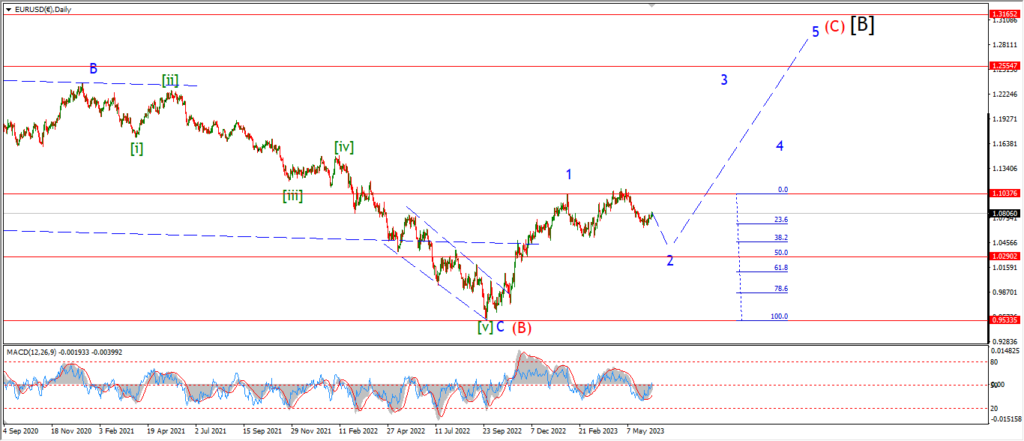
EURUSD daily.
In general I am a EURUSD bull over the rest of this year as you can see in the longer term charts.
but I am not satisfied with the correction in wave ‘2’ yet.
That pattern is not complete at all!
And that is why I continue to look for another leg lower to complete wave ‘2’.
I think I am correct in that assumption.
We will see how that plays out next week I suppose.
Tomorrow;
The spike today is a symptom of that 0dte trade I suspect.
And if that spike reverses tomorrow,
then we have a good chance wave (iii) will come our way next week.
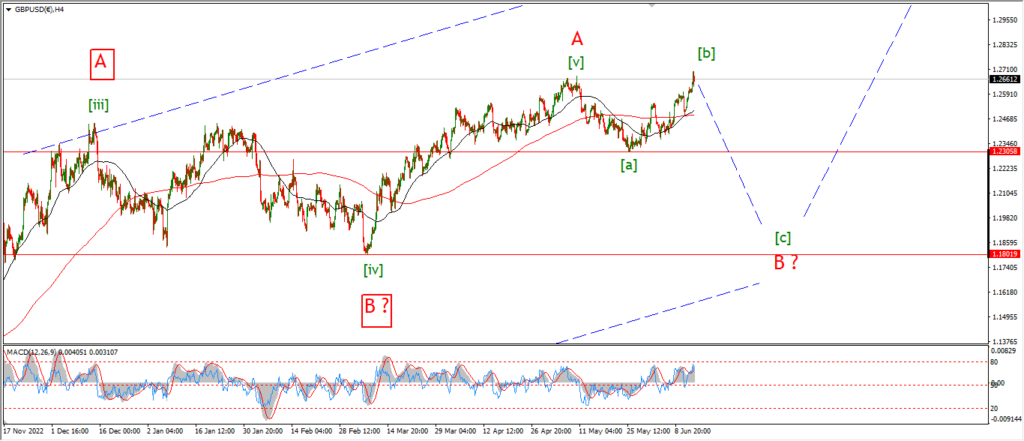
the high of wave [b] must hold.
watch for that initial drop below 1.0780.
GBPUSD
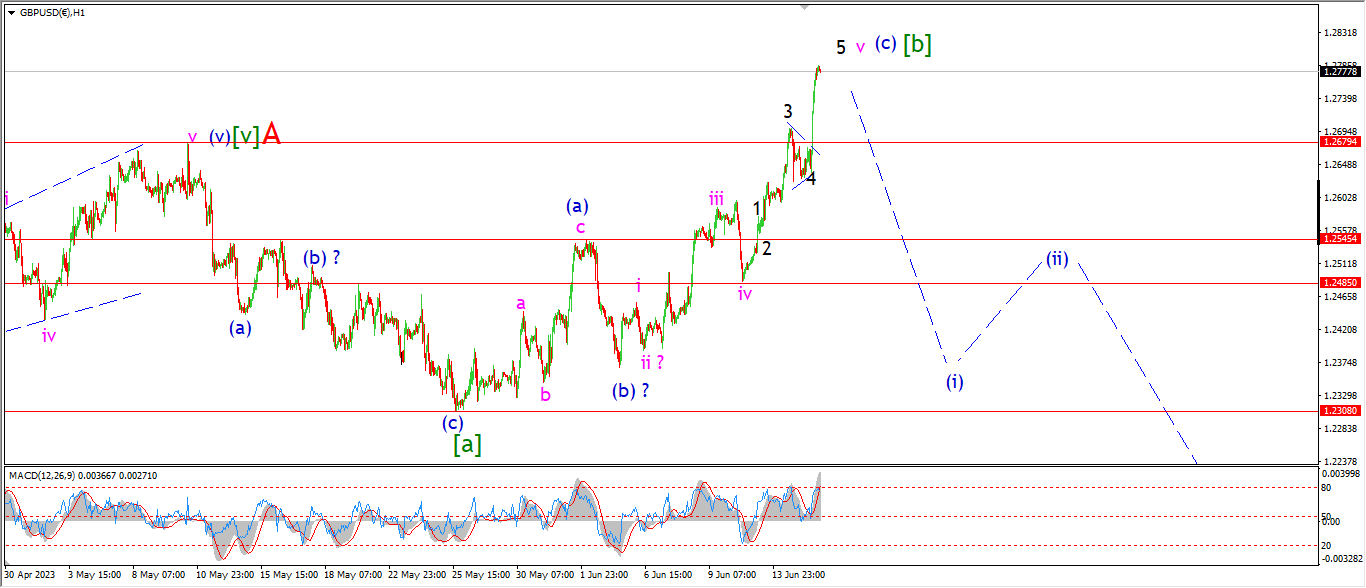
GBPUSD 1hr.
GBPUSD 4hr.

GBPUSD daily.
The main thing that convinces me about this corrective wave [b] top here,
is the fact that the initial rally off the wave [a] low is clearly a three wave pattern.
Wave (a) blue is three waves up,
and now we have an extension in wave (c) to that new high.
The only way this resolves in an expanded flat pattern is by a crushing decline in wave [c] yet to come our way.
Tomorrow;
Lets see if the price can drop back below the wave ‘A’ top again tomorrow to signal wave (i) of [c] has begun.
USDJPY.
USDJPY 1hr.
USDJPY 4hr.

USDJPY daily.
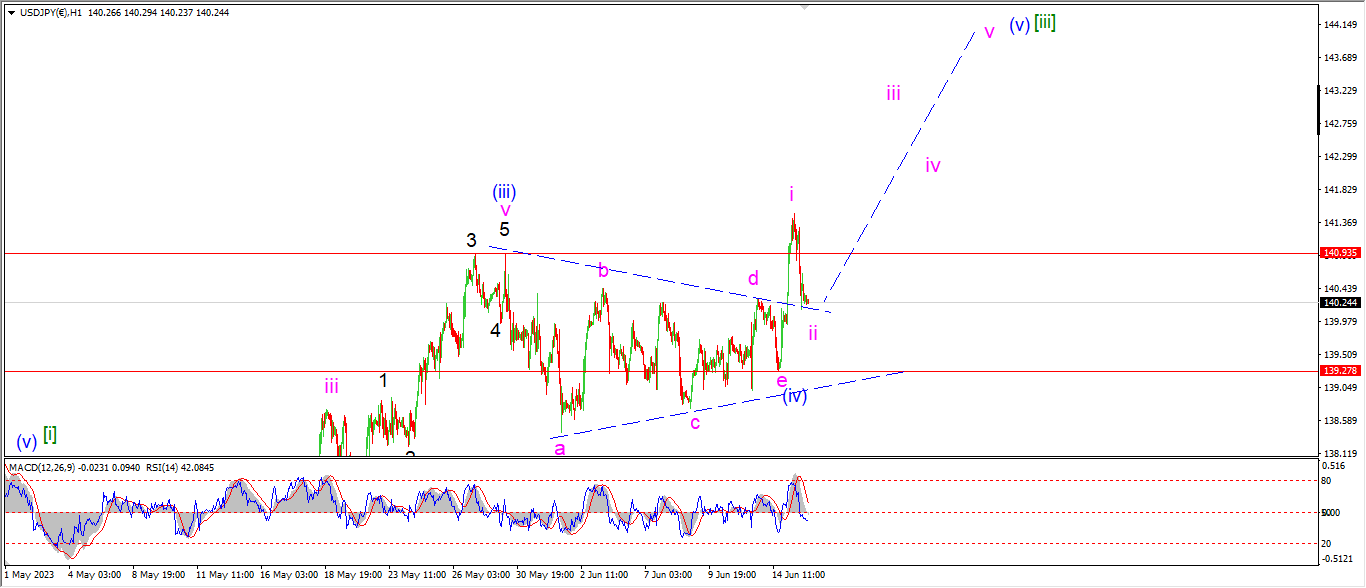
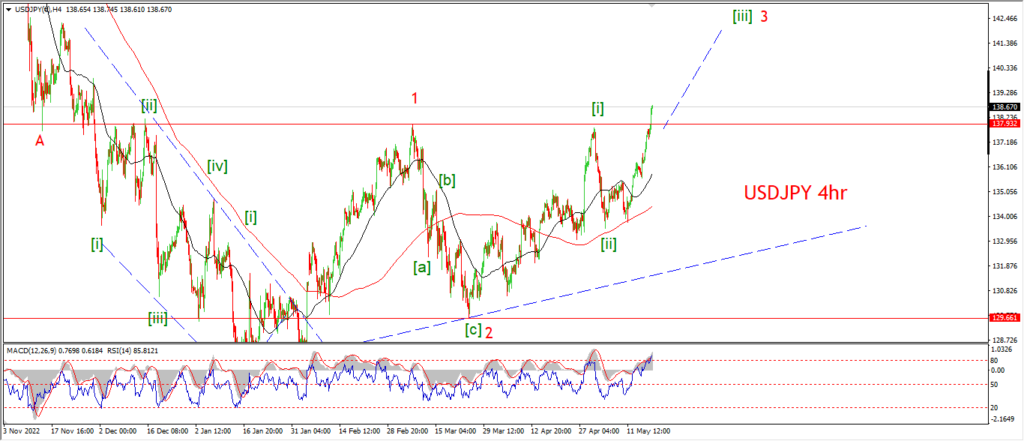
USDJPY has broken a new high above the wave (iii) top,
and now the price has fallen back to a higher low this evening.
I have labelled this action as wave ‘i’ and ‘ii’ of (v).
Wave (v) is expected to continue for most of next week with an ideal target in the 145.00 area.
Tomorrow;
Watch for wave ‘ii’ to hold above 139.27.
wave ‘iii’ should turn higher by the end of tomorrows session.
If that wave (iv) low breaks,
then I will have to consider the higher degree wave [iii] complete.
DOW JONES.
DOW 1hr.
DOW 4hr
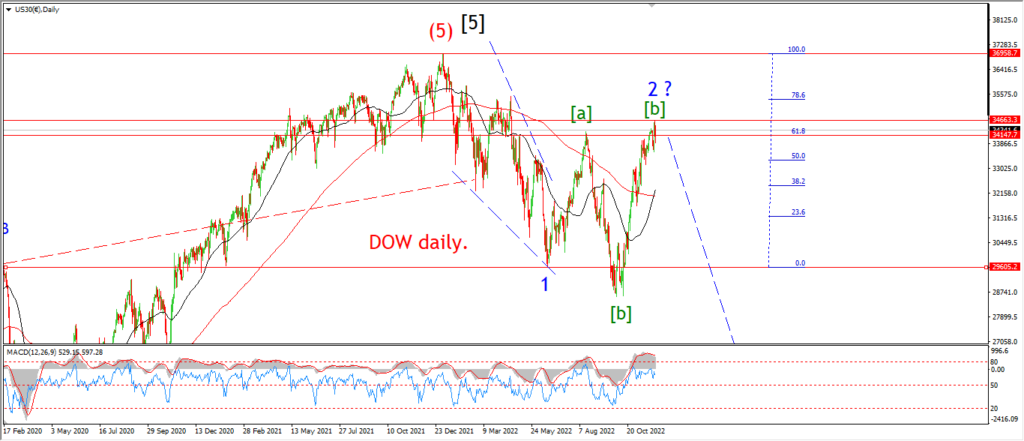
DOW daily.
I am very boring here this week.
I know I may be frustrating you guys and gals with my insistence of the corrective nature of this action.
But I am just not interested in herding at an overbought extreme.
Call me old fashioned!
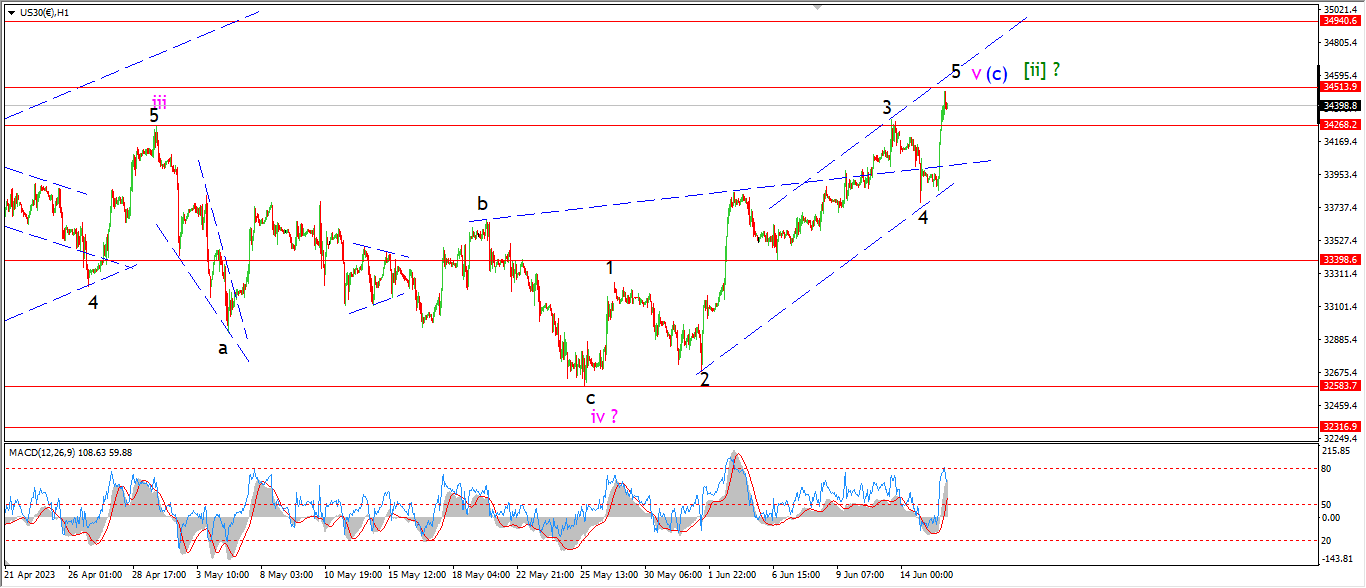
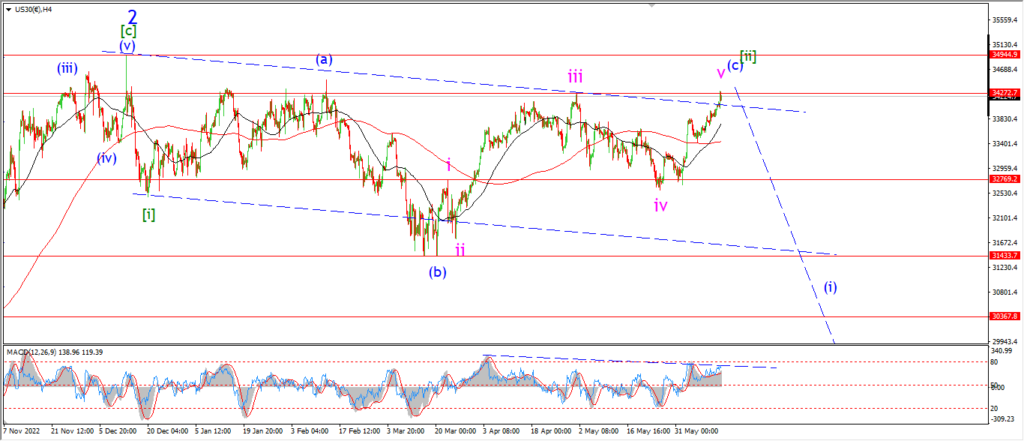
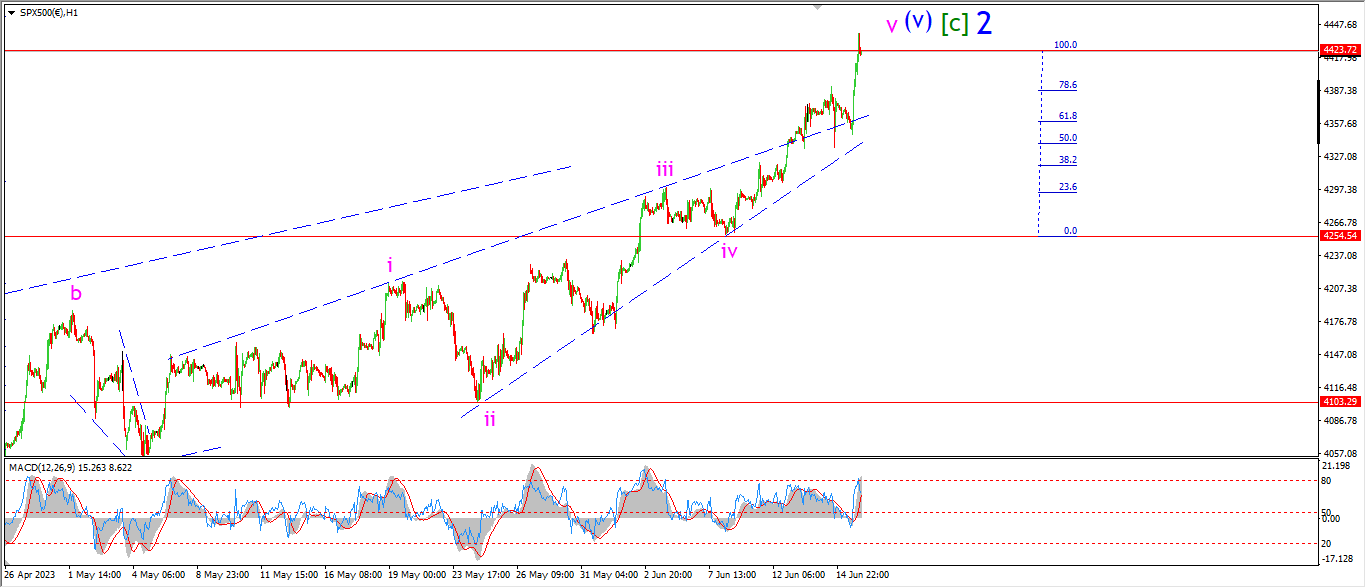
I have labelled wave ‘v’ as an extended rally after todays push higher.
The elliott channel is almost complete in this wave ‘v’ pattern now.
and the top today marks the first clear break of the previous wave ‘iii’ top.
Also,
the top today brings wave (c) in blue right up to the previous wave (a) high at 34513 or so.
If this wave [ii] pattern is correct,
then we are at the termination point right now.
It has got to break now,
its that simple.
Tomorrow;
Watch for the resistance of that wave (a) top to act as a brake on this rally.
The market has called me every time in this wave (c) rally.
Lets see if it can break its own hard resistance level at wave (a).
The invalidation level for this count remains at 34940.
GOLD
GOLD 1hr.
GOLD 4hr.

GOLD daily.
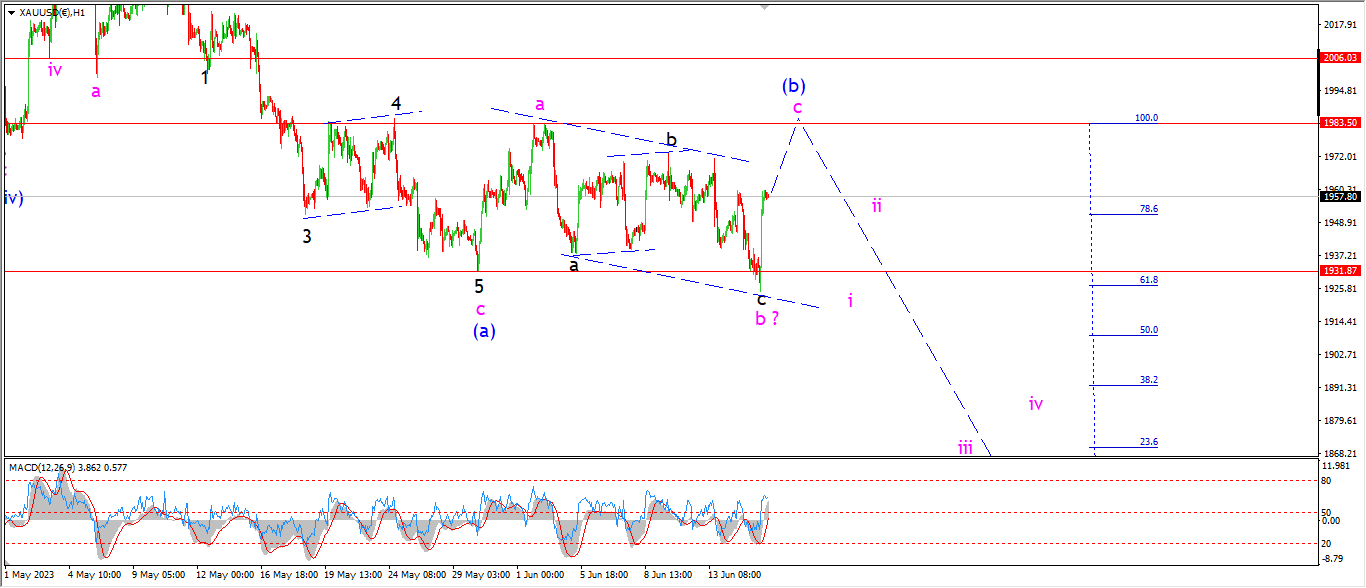
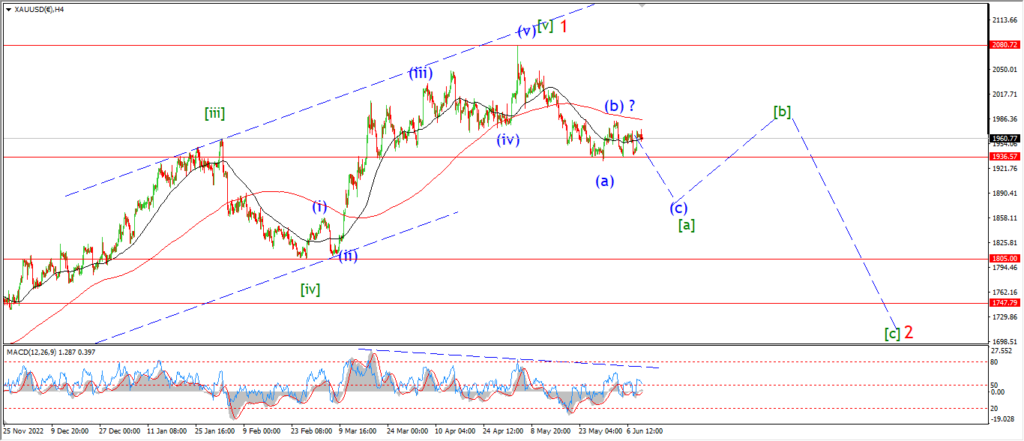
The rally in gold today has forced me to return to the previous version of the wave (b) count.
This pattern suggests wave (b) is an expanded flat correction.
The low this week is wave ‘b’ of (b).
And todays rally begins wave ‘c’ of (b).
The target for wave ‘c’ of (B) in this scenario is at 1983 again.
Tomorrow;
Watch for wave ‘c’ of (b) to top out near 1983 again.
It looks like I will have to wait for next week to begin wave ‘i’ of (c).
CRUDE OIL.
CRUDE OIL 1hr.
CRUDE OIL 4hr.
CRUDE OIL daily.
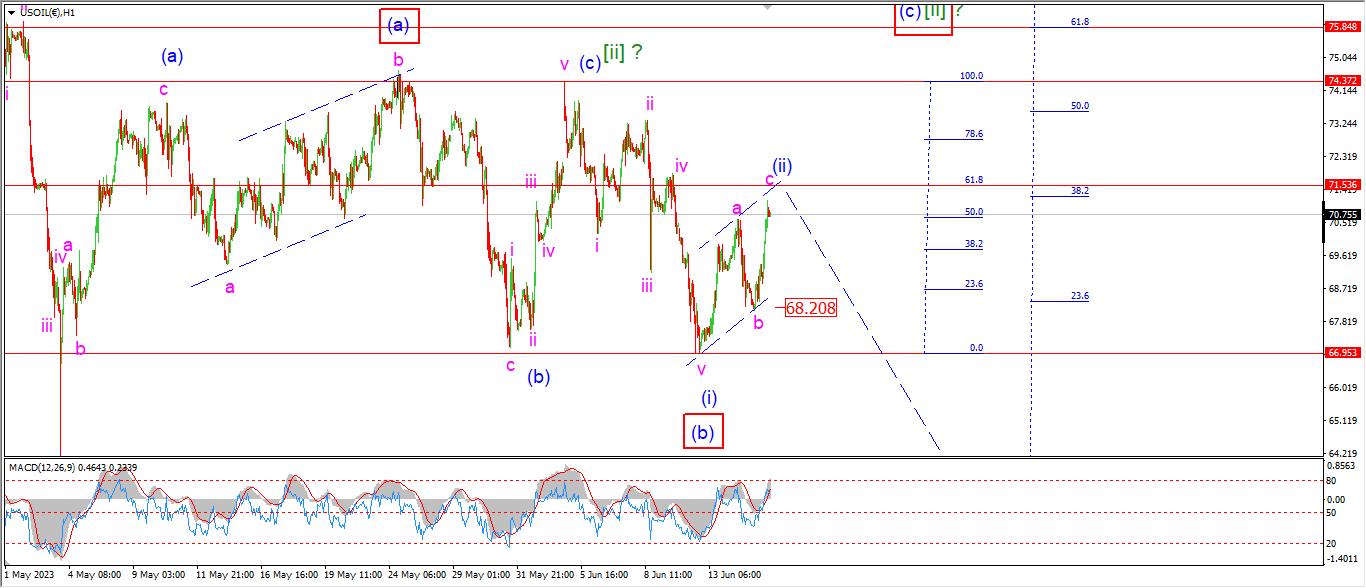
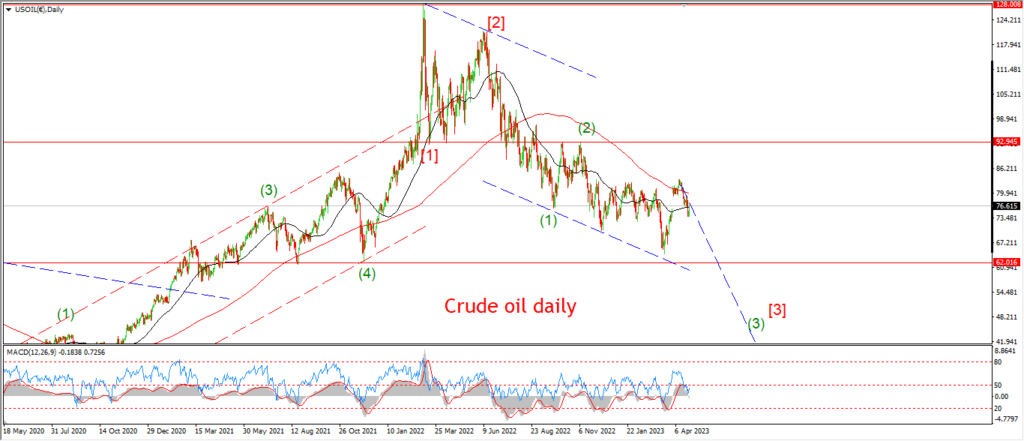
The everything rally appeared in crude oil today also.
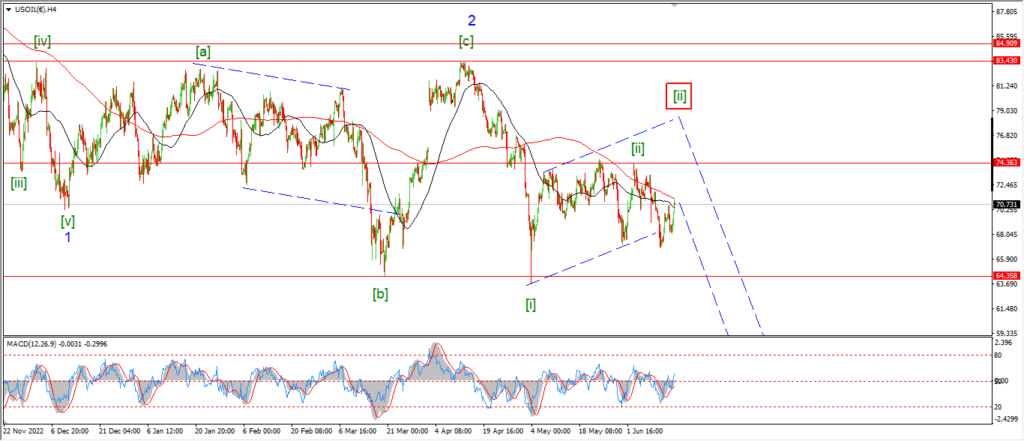
Wave ‘c’ of (ii) has closed out the trend channel this evening and this tree wave pattern higher seems quite reasonable now.
the price hit the 50% retracement level of wave (i) today also.
If the price drops back below that wave ‘b’ low again at 68.20,
then we are looking at a real contender for a third wave acceleration lower over the coming few days.
Tomorrow;
Watch for a signal that wave (ii) is done by reversing back below 68.20 again.
S&P 500.
S&P 500 1hr
S&P 500 4hr
S&P 500 daily.
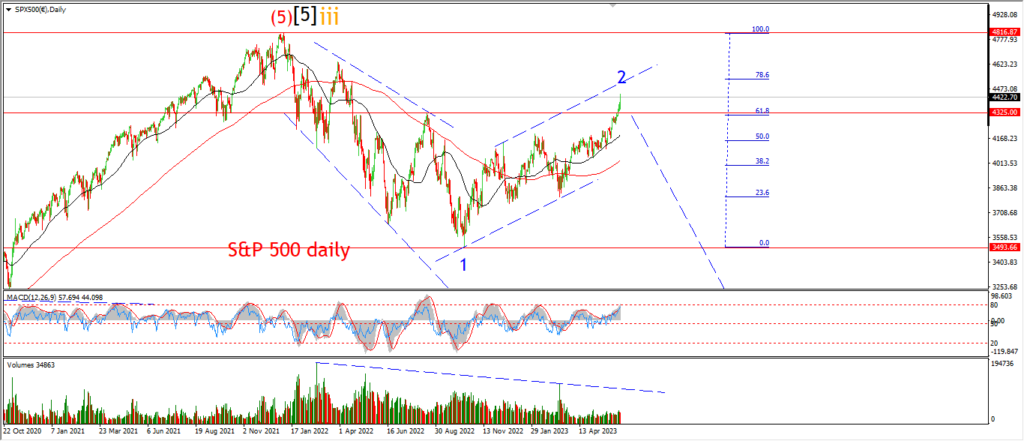
Take a look at that daily chart first this evening.
Do you see what I see at all,
or am I a lonely outsider here.
Am I the only one who is having apocalyptic visions of market deception and eventual destruction.
The greatest deception happens at a second wave top remember.
And here we are!
Three waves up is done in wave ‘2’.
It’s overdone in my book,
but that is neither here nor there really.
That pattern into wave ‘2’ blue is a clear three wave pattern higher.
The market is convinced there is a melt up coming.
I beg to differ as you well know.
If this wave ‘2’ has done its job well,
then the majority will be convinced that all is well.
And I suspect that is what the general population are thinking here.
Despite all the glaring problems us few can see.
The 4hr chart is no different.
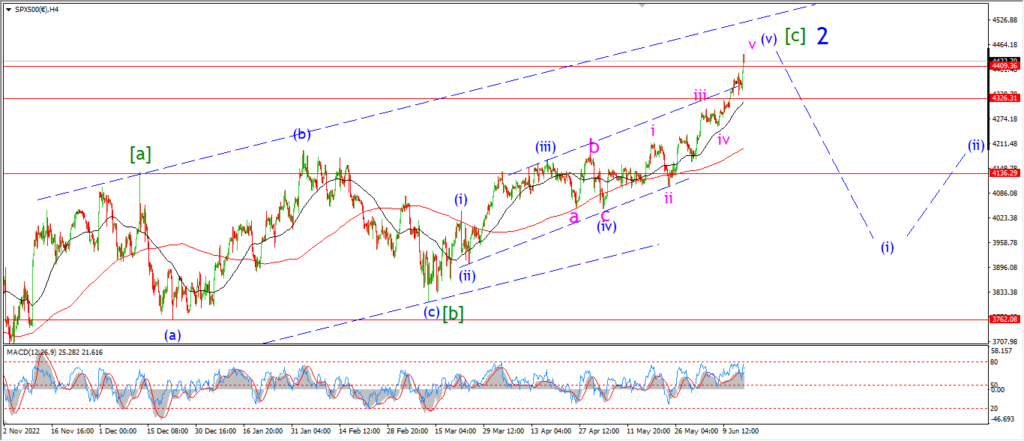
A parabolic rally in wave (v) has brought wave [c] close to closing the trend channel in wave ‘2’.
How long more can this market disregard reality and keep up the rally.
We will see.
This rally has already gone further than I ever expected that much you know.
So I will hold my peace here until the rally cracks and gives us another chance at a reversal.
Tomorrow;
An extended rally in wave ‘v’ of (v) of (c) of ‘2’ is what we are looking at here.
The trend channel has been broken by a throw over in wave (v) [c].
That should be enough to call a halt to the rally usually.
So lets see if this rally snaps tomorrow to reverse that spike rally.
SILVER.
SILVER 1hr
SILVER 4hr.
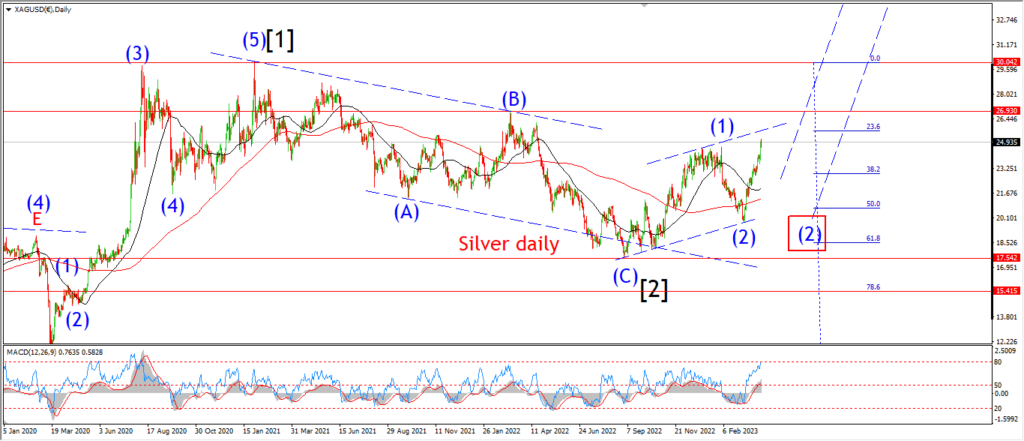
SILVER daily.
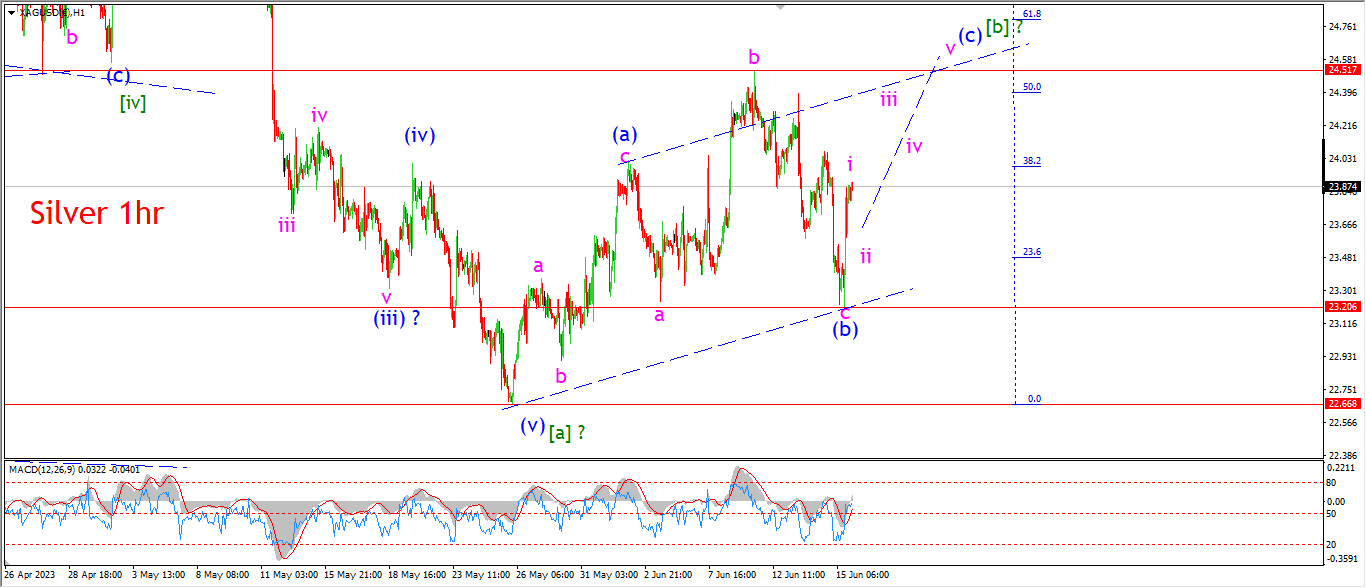
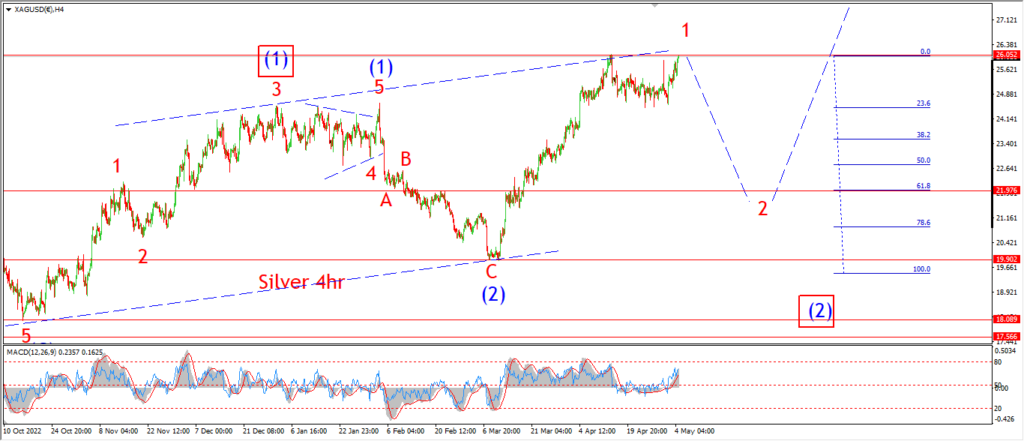
I have re-worked this wave [b] correction today after that rally.
The decline this week was encouraging,
but it has not made the progress that I expected into wave [c].
So now I am suggesting an expanded flat correction for wave (b),
and a rally into wave (c) left to come.
Todays spike higher is labelled wave ‘i’ of (c).
So I expect a five wave rally in wave (c) to develop over the coming few days.
Tomorrow;
Watch for wave ‘ii’ of (c) to form a higher low tomorrow.
Wave ‘iii’ will wait until next week.
BITCOIN
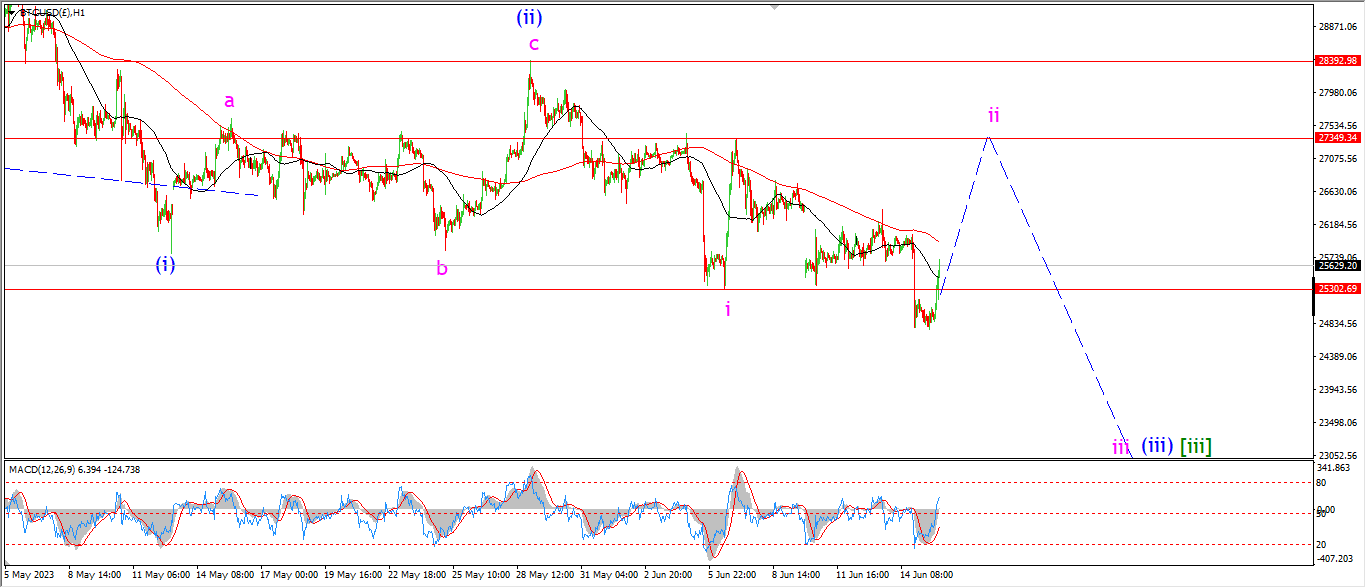
BITCOIN 1hr.

BITCOIN 4hr.
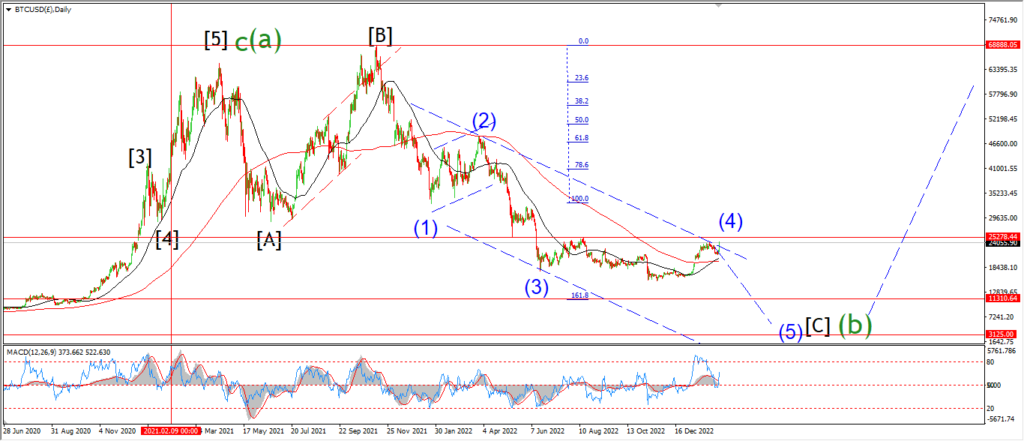
BITCOIN daily.
….
FTSE 100.
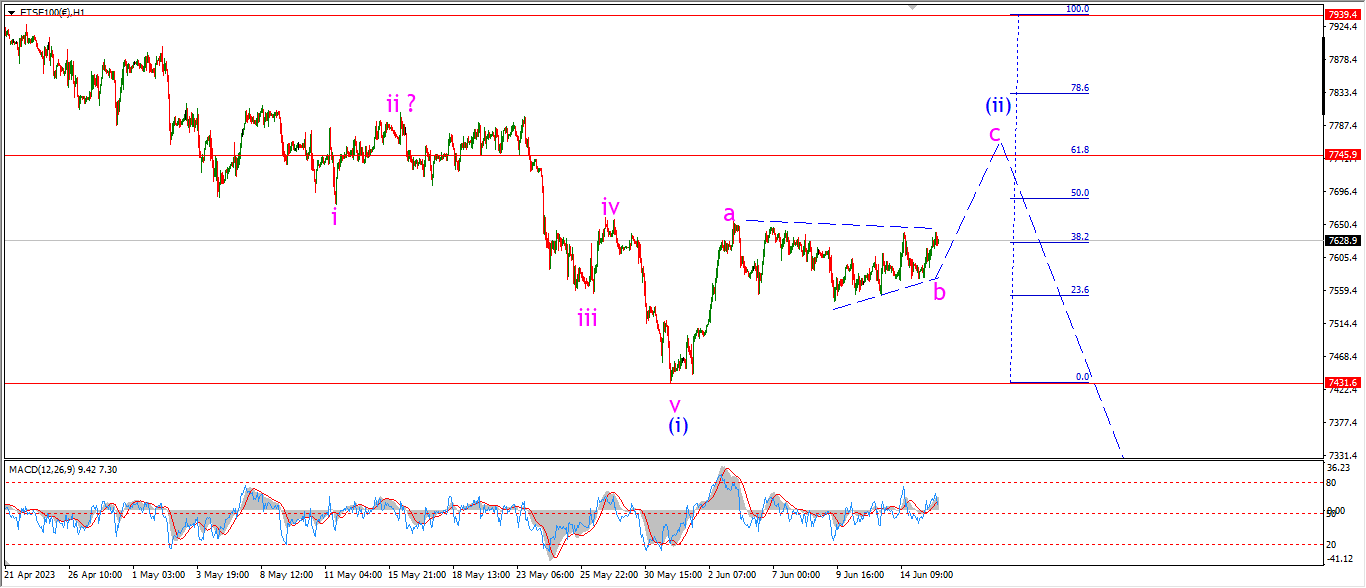
FTSE 100 1hr.
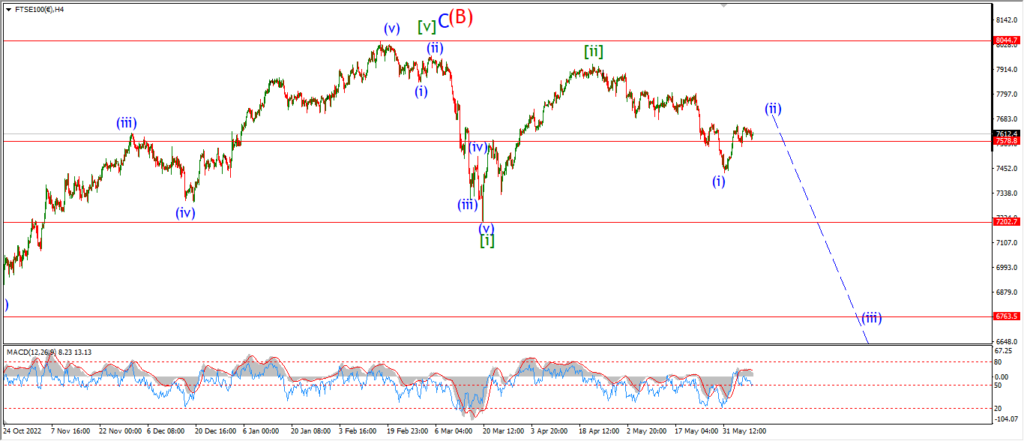
FTSE 100 4hr.
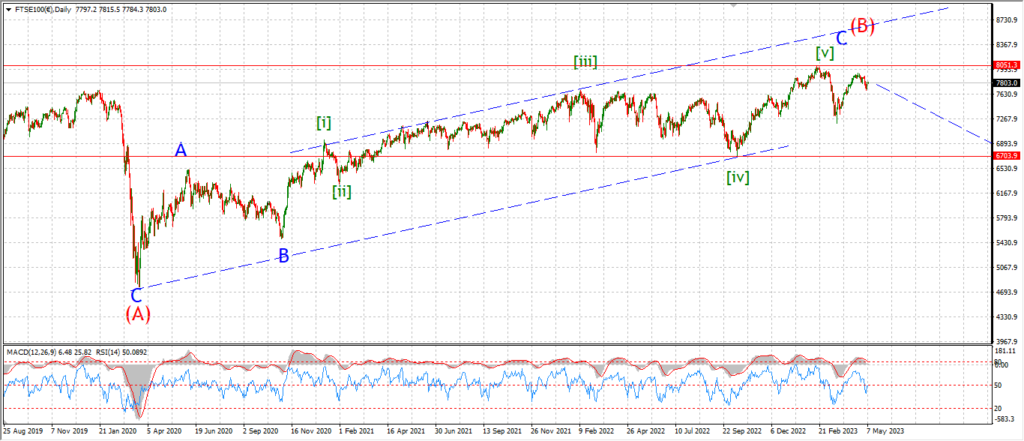
FTSE 100 daily.
….
DAX.
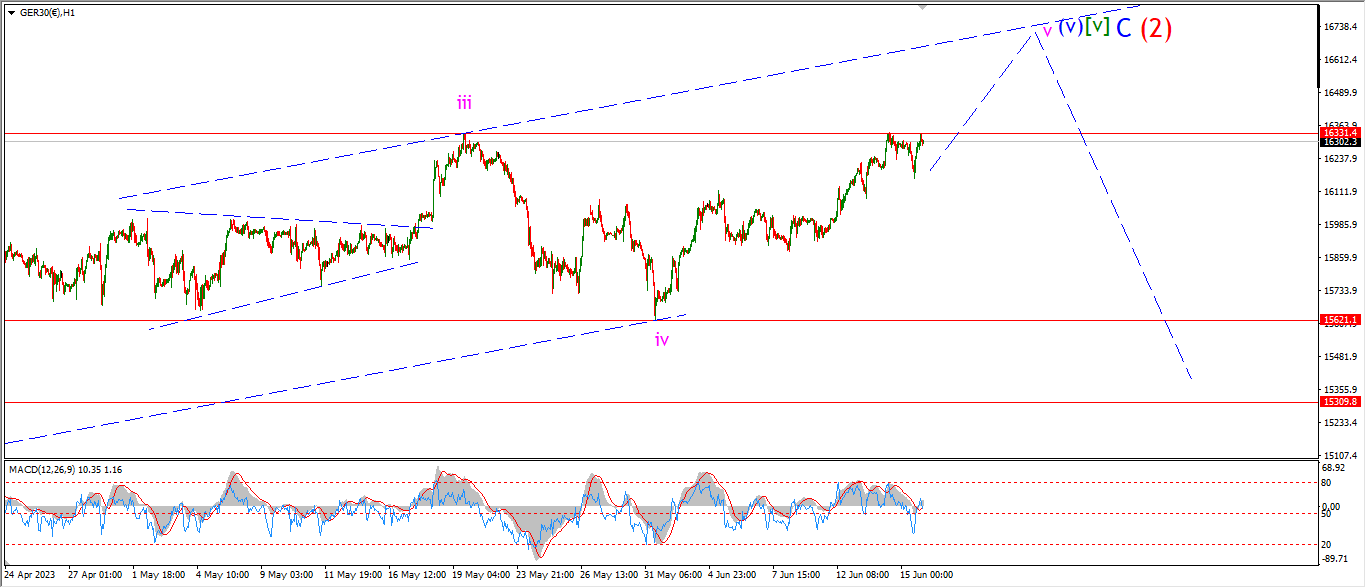
DAX 1hr
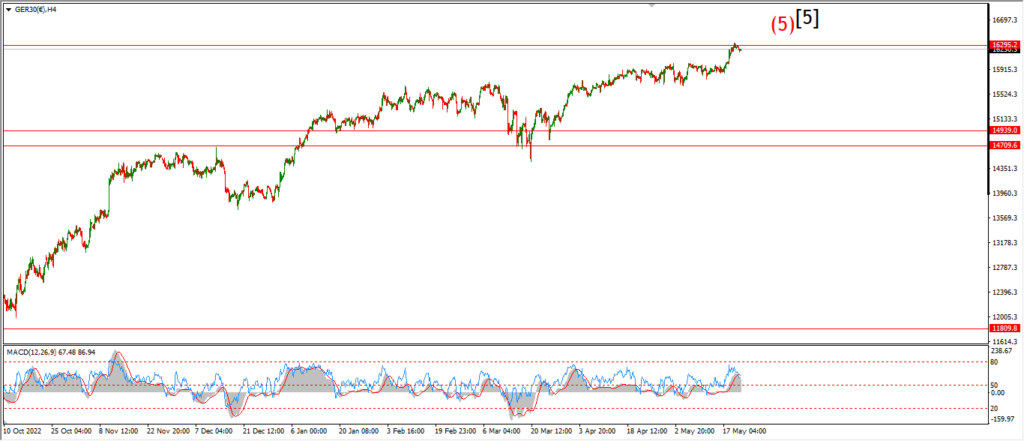
DAX 4hr
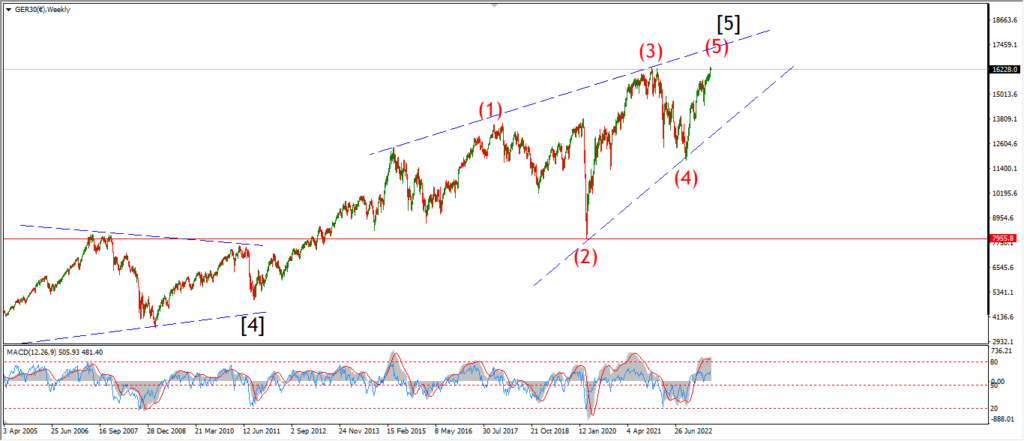
DAX daily.
….
NASDAQ 100.
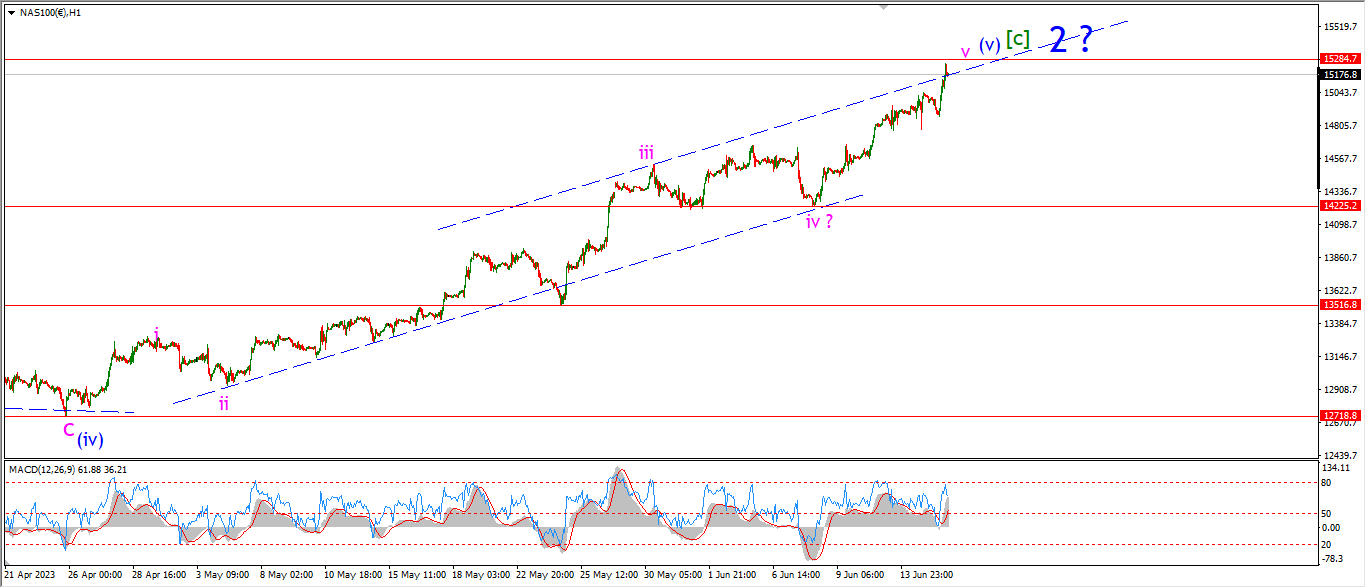
NASDAQ 1hr
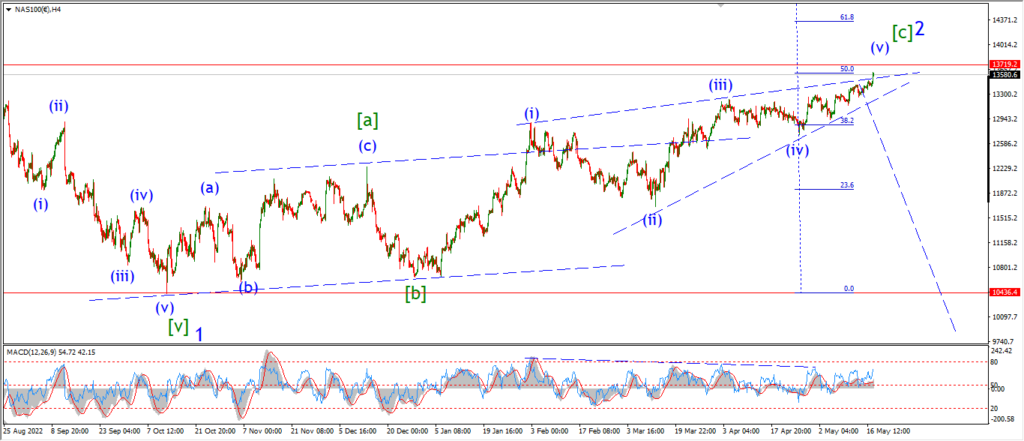
NASDAQ 4hr.

NASDAQ daily.
….