
Good evening to one and all.
The Lord’s Blessing’s to you all again tonight.
https://twitter.com/bullwavesreal
EURUSD.
EURUSD 1hr.
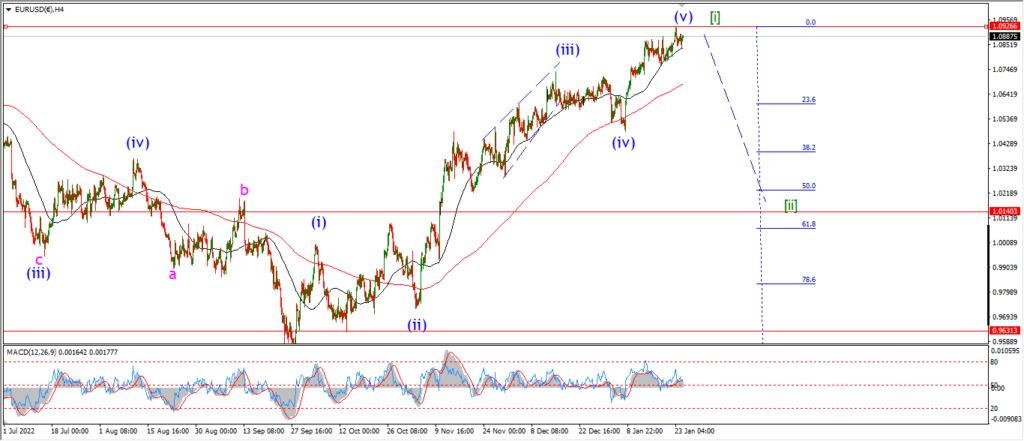
EURUSD 4hr.

EURUSD daily.
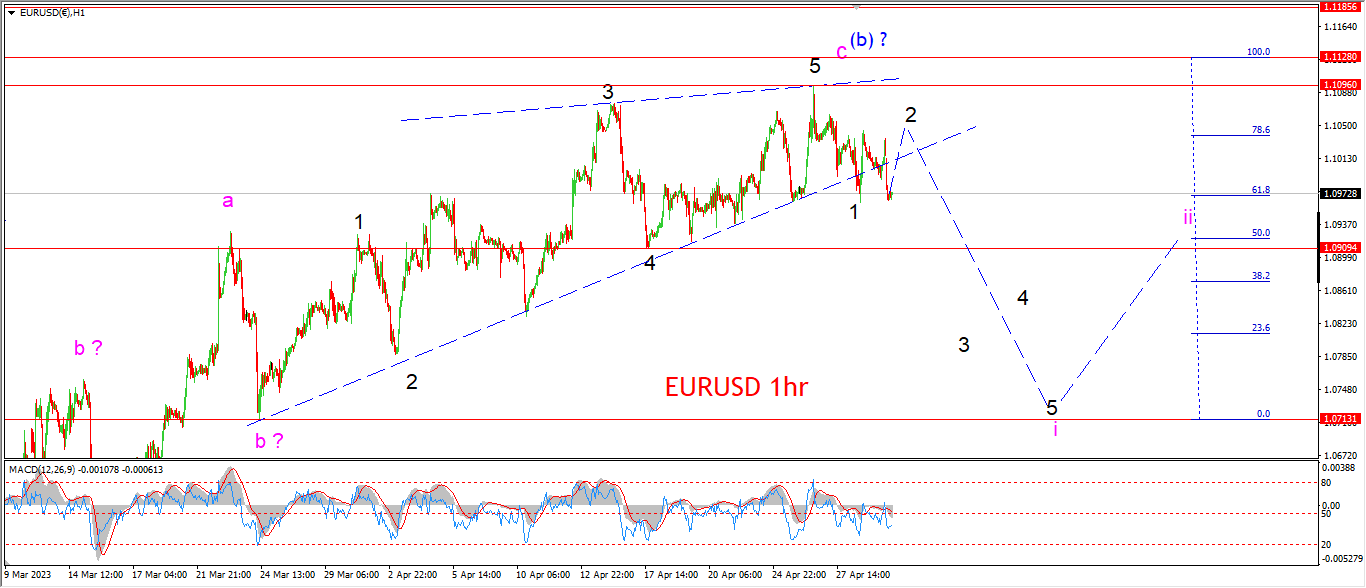
EURUSD turned lower today again and the final spike into wave ‘5’ of ‘c’ has been fully retraced again.
At the moment I am looking at this move as part of that wave ‘2’ correction forming a lower high.
So far there is three waves down into the low of the session.
This suggests wave ‘2’ will turn higher to complete a zigzag correction as shown.
If the price continues lower early tomorrow and breaks the wave ‘4’ low at 1.09 again,
that will confirm wave ‘i’ is underway.
Tomorrow;
Watch for that lower high to complete below 1.1096 in wave ‘2’ of ‘i’.
wave ‘3’ of ‘i’ will break 1.09 to confirm the pattern.
GBPUSD
GBPUSD 1hr.
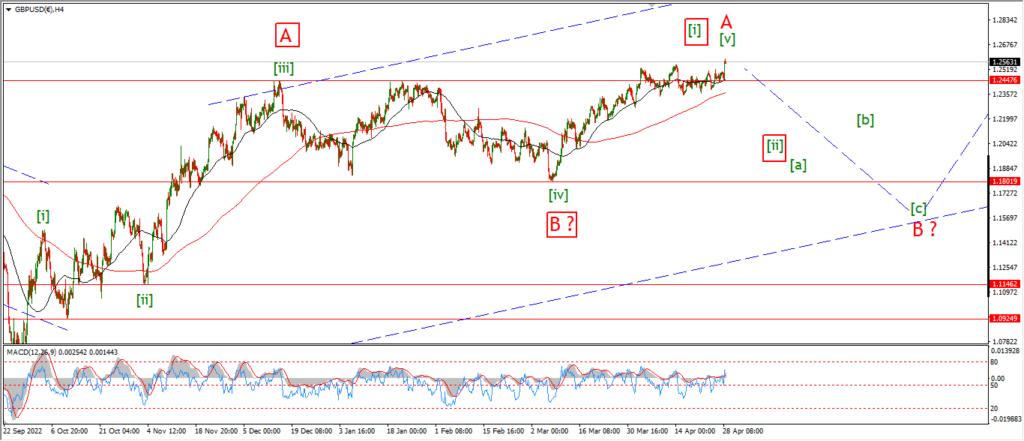
GBPUSD 4hr.

GBPUSD daily.
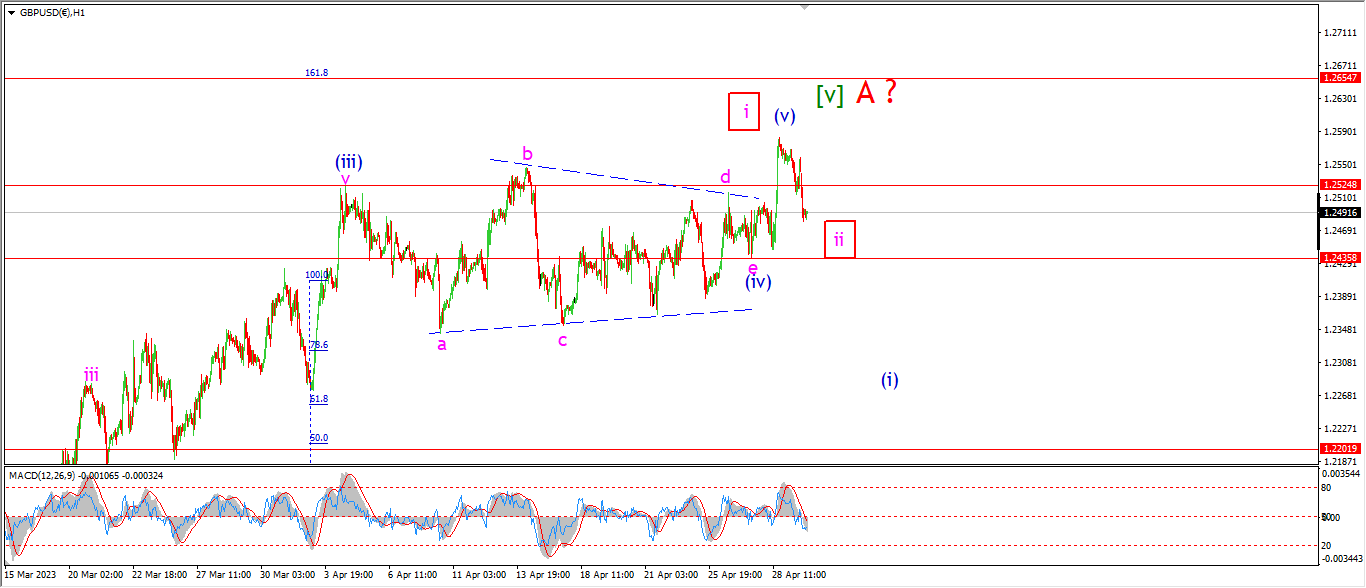
A sharp turn lower in cable today is suggesting the top is already in for wave (v) of [v] again.
The price must break below the previous triangle correction in wave (iv) to confirm that view.
So the key level in this short term chart lies at 1.2435.
A solid break down below that level will signal wave (i) of [i] of ‘C’ has finally begun.
The alternate count for wave (v) blue is shown also.
It shows an extended pattern in wave (v).
this count will be ruled out with a break of that wave (iv) low.
Tomorrow;
Watch for a break of 1.2435 to signal wave (i) is underway.
USDJPY.
USDJPY 1hr.
USDJPY 4hr.

USDJPY daily.
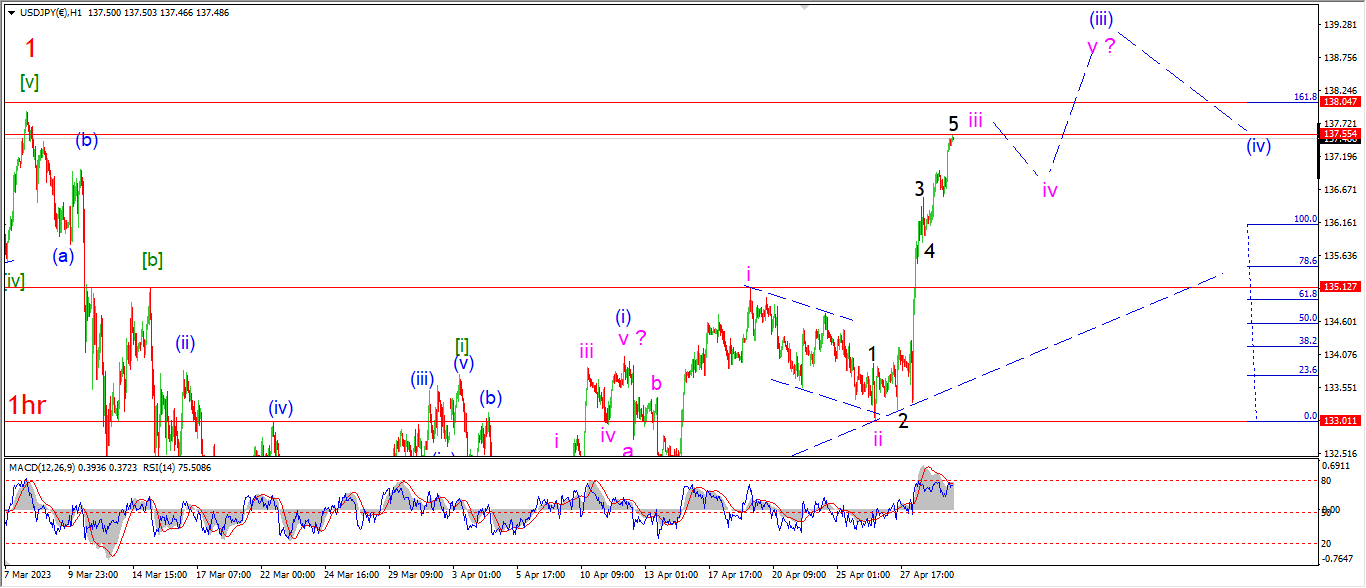
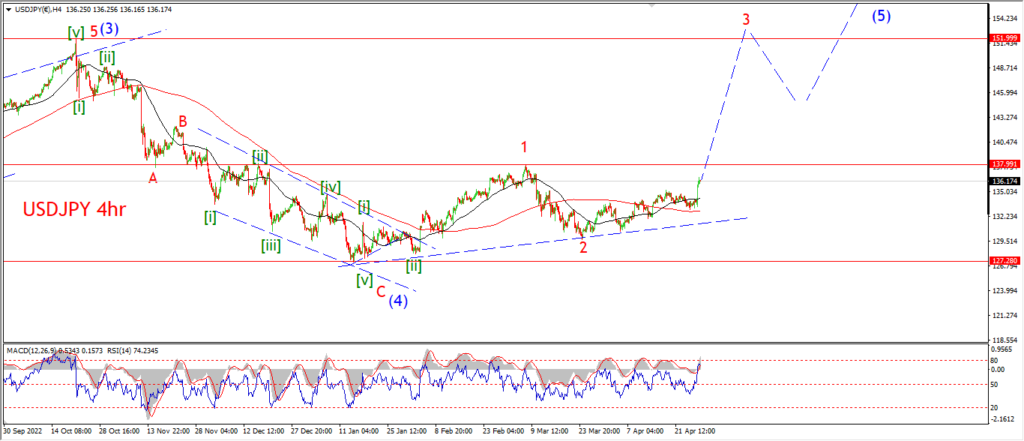
USDJPY is now close to completing a five wave rally in wave ‘iii’ of (iii).
the pattern surely fits a third wave acceleration,
and the rally has hit the Fibonacci target area for wave ‘iii’ also today.
The ideal high for wave ‘iii’ pink lies at 138.04.
We will see if that happens overnight.
If wave ‘iii’ of (iii) is now complete.
Then we should see a small correction in wave ‘iv’ pink over the coming few sessions.
That correction must hold above the wave ‘i’ high at 135.12.
Tomorrow;
Watch for wave ‘iii’ to complete soo in the target area.
Wave ‘iv’ should fall back into the 136.00 area again in three waves.
DOW JONES.
DOW 1hr.
DOW 4hr
DOW daily.
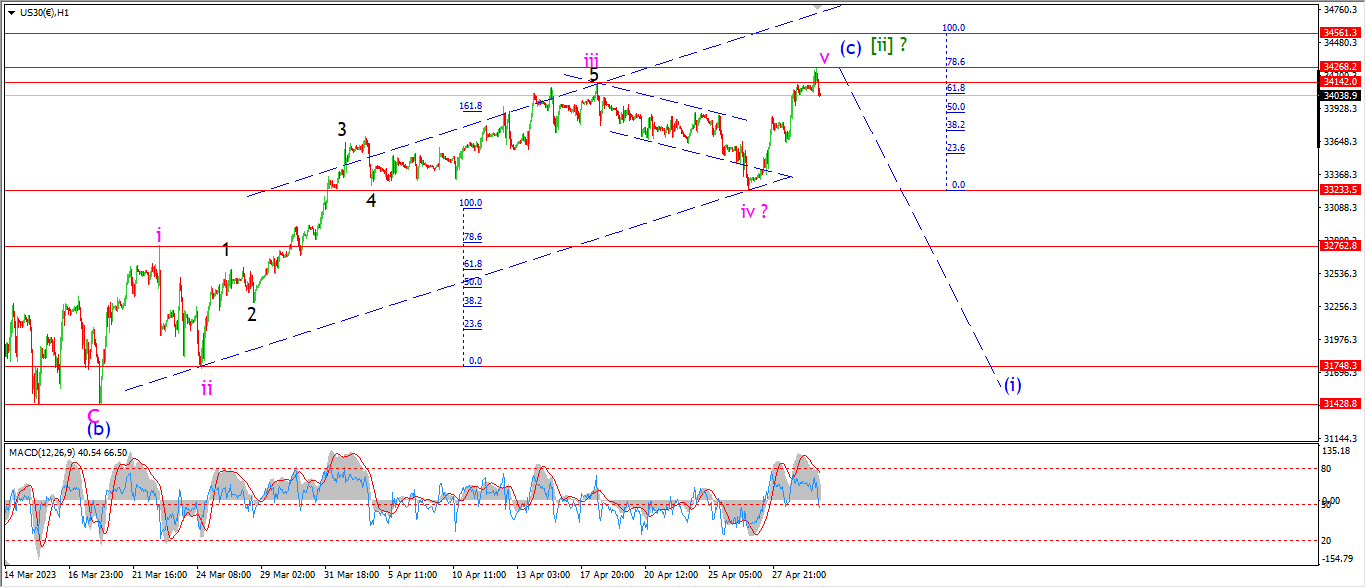
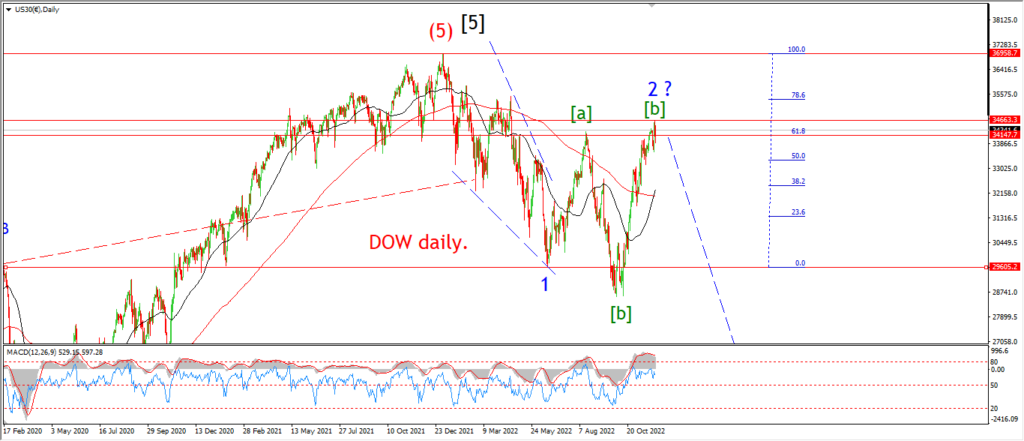
If we take this new count for wave (c) of [ii] and do a fibonacci analysis on the subwaves,
then we can get a handle on how mature this rally is in wave (c).
Wave ‘i’ pink reached from 31428 to 32760.
And if we take a Fibonacci grid off that wave and extend off the wave ‘ii’ low we get a target area for wave ‘iii’.
Wave ‘iii’ topped out above that level by 150 points at 34142 and then fell into wave ‘iv’ at 33233.
Wave ‘iv’ completed at 33233,
and then wave ‘v’ rallied last week to break above the wave ‘iii’ high today,
meeting the minimum target for a fifth wave.
Wave ‘v’ reached 78.6% of wave ‘i’ at today high.
Now what?
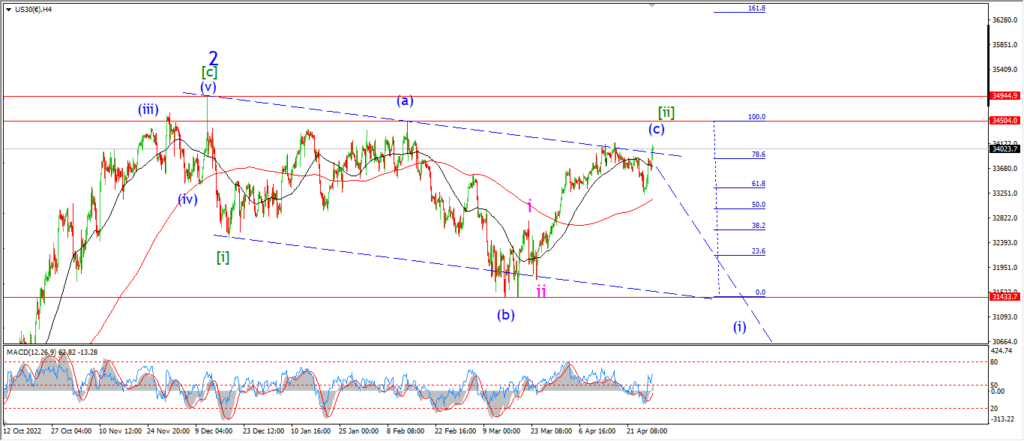
On the 4hr chart you can see that this pattern in wave [ii] has completed a running flat correction.
Wave (c) has not broken the wave (a) high so far.
Of course this rally has broken so many of my previous suggested patterns,
even into last week.
and that really does not inspire confidence I know.
I can only tell you what I see here.
And with the back drop of bank failures, recession,
and outright willful blindness on the part of both the public at large and the establishment,
I can’t see any other outcome that disaster here.
Dr doom is back I suppose!
Tomorrow;
Lets see if this week can finally bring my long awaited wave (i) decline in five waves.
Wave ‘iv’ forms the initial support at 33233.
Lets keep an eye on that level for a signal.
GOLD
GOLD 1hr.
GOLD 4hr.

GOLD daily.
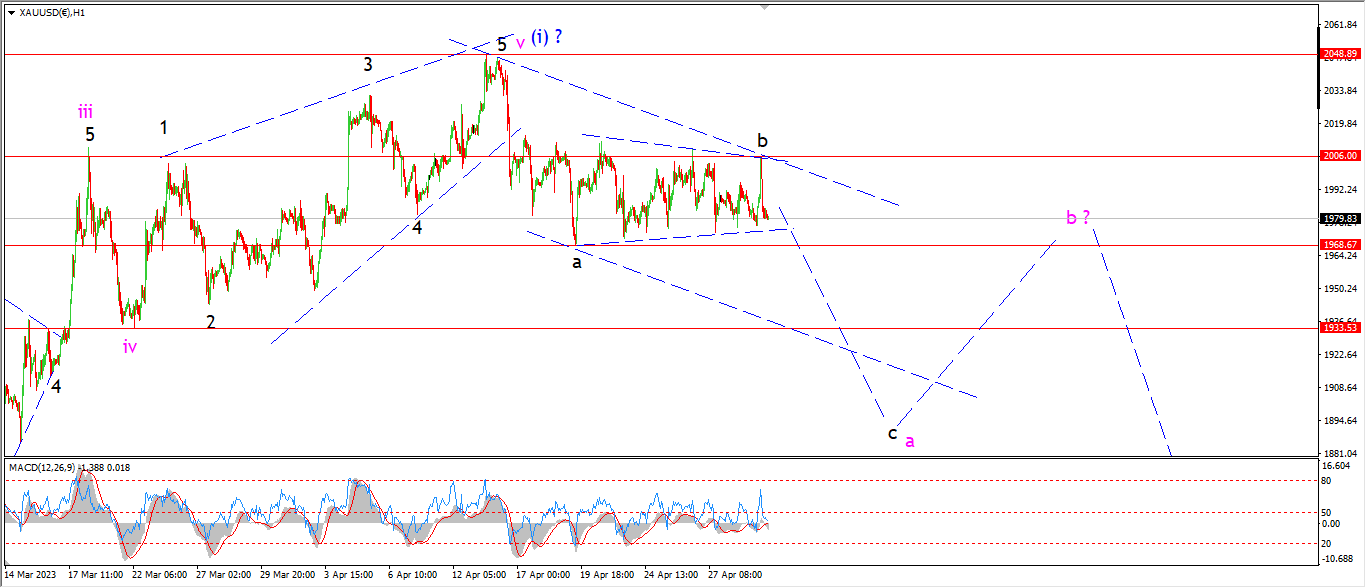
I am now showing a possible three wave decline in wave ‘a’ pink rather than a five wave pattern.
The action today seems to have completed a contracting triangle in wave ‘b’ of ‘a’.
and if we see a new decline below 1968 again that will signal wave ‘c’ of ‘a’ is underway.
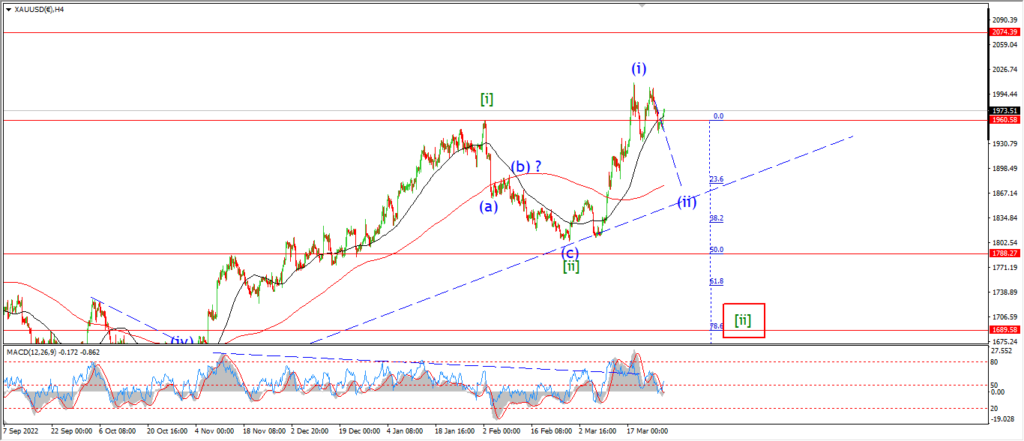
This new pattern does not change the overall outlook for wave ‘a’,
I am looking for wave ‘c’ of ‘a’ to fall into the 1900 area to complete the initial decline of wave (ii).
Tomorrow;
Watch for wave ‘b’ to hold at 2006.
Wave ‘c’ will be confirmed with a break below 1968 again.
CRUDE OIL.
CRUDE OIL 1hr.
CRUDE OIL 4hr.
CRUDE OIL daily.
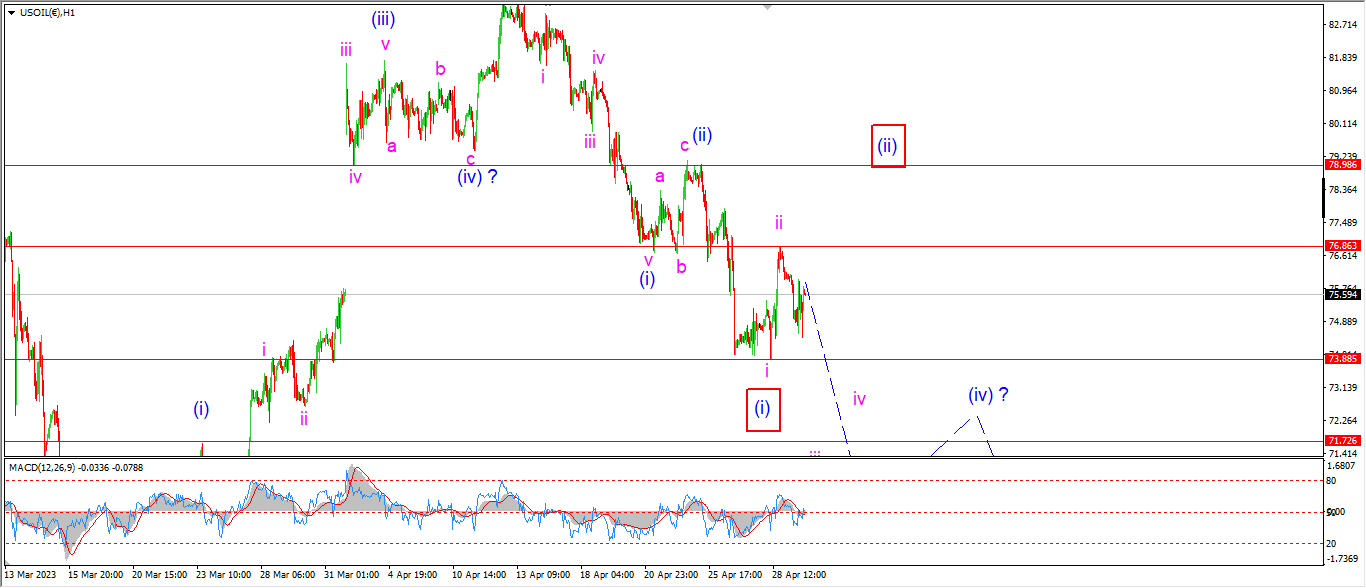
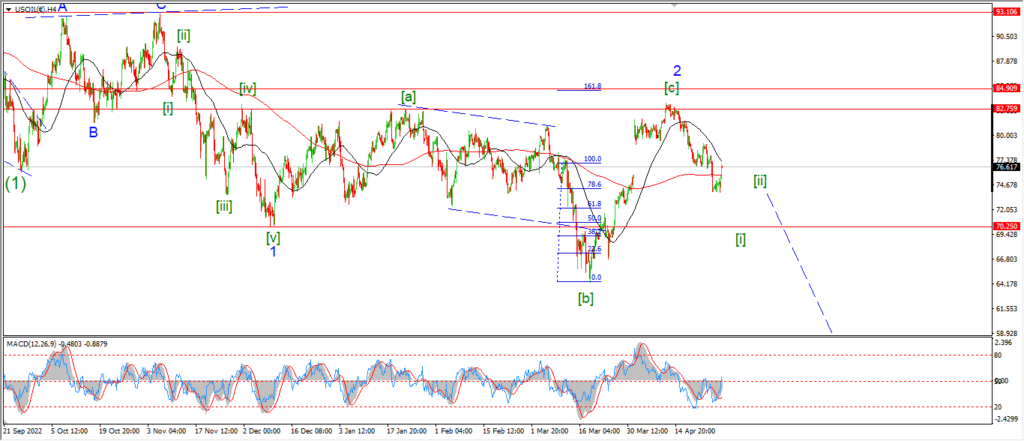
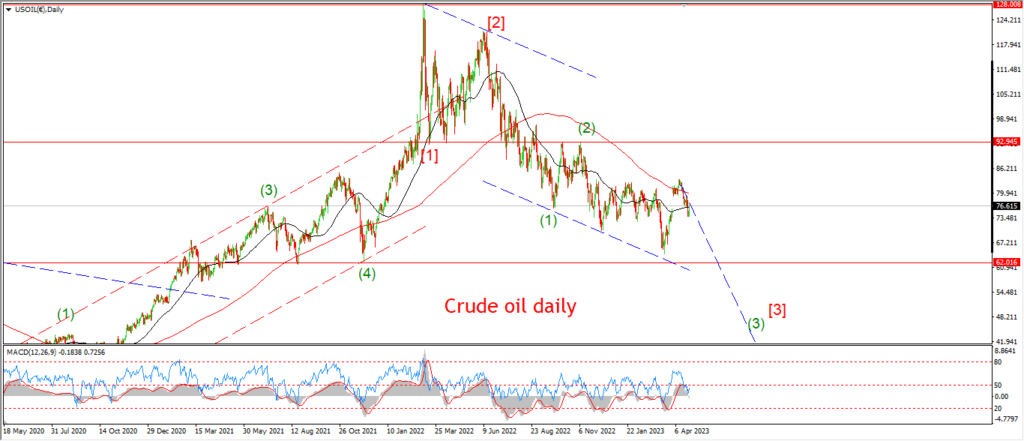
The short term count has a two possibilities in play here.
I can still view the current declines as a developing wave (iii) of [i] down.
and that is the main count.
The wave ‘ii’ high is holding today,
and if we see a break below 73.88 again that will signal wave ‘iii’ of (iii) is underway.
The alternate count allows for a larger wave (ii) retracement off last weeks lows.
If the price breaks 76.86 again that will signal wave ‘c’ of (ii) is underway
and we can then expect this alternate wave (ii) to complete three waves up near 79.00 again later this week.
Tomorrow;
The high at wave ‘ii’ must hold at 76.86.
Wave ‘iii’ down should continue lower in five waves.
And a break below 73.88 again will confirm wave ‘iii’ is underway.
S&P 500.
S&P 500 1hr
S&P 500 4hr
S&P 500 daily.
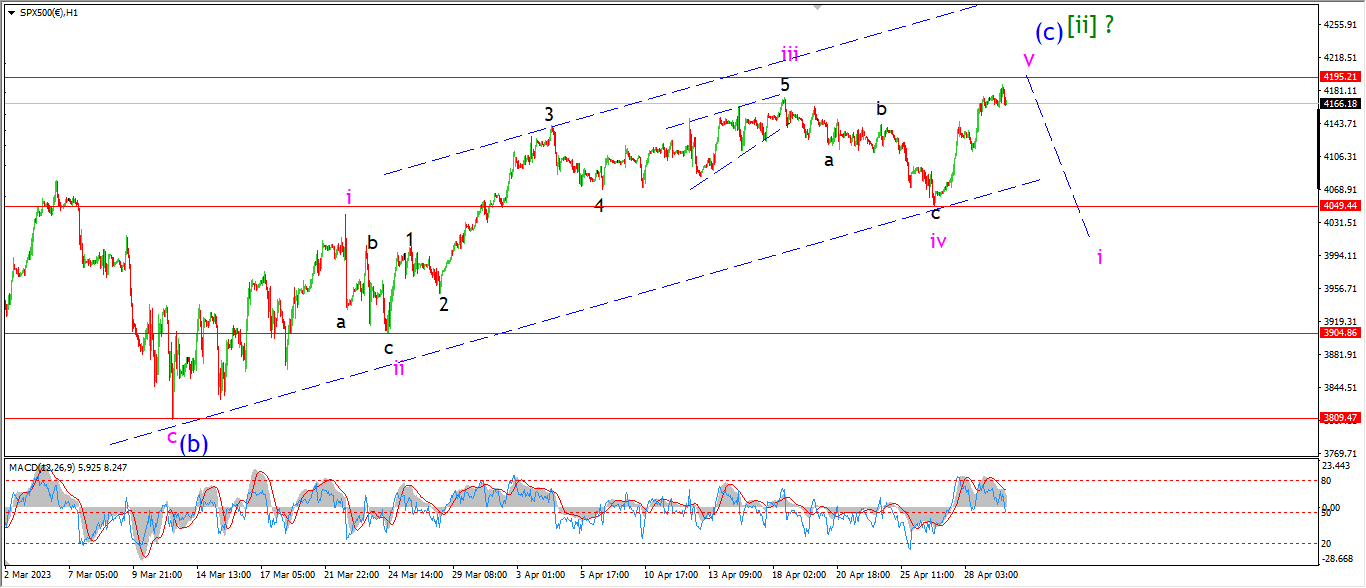
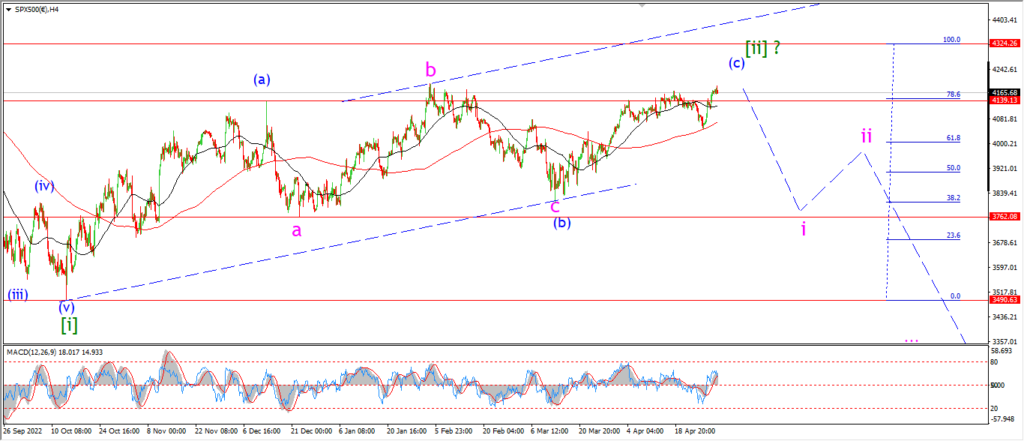
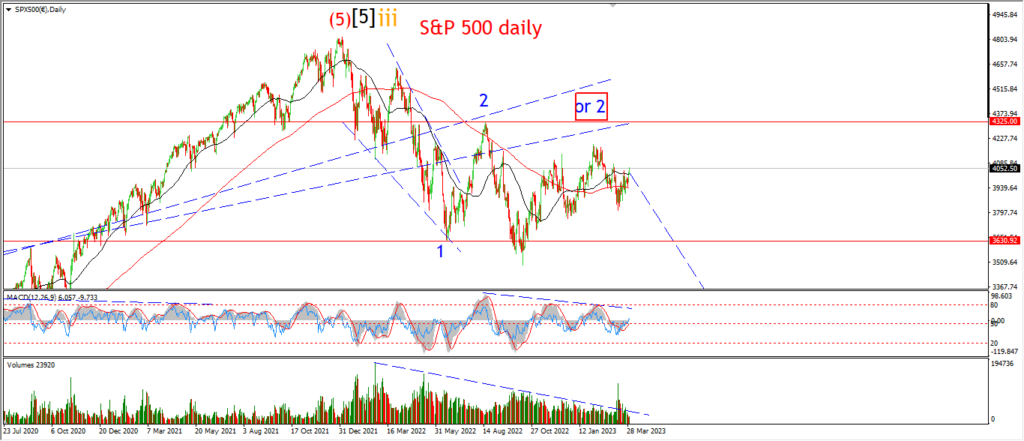
I have switched to the alternate count in the S&P also tonight and while this is disappointing to me,
I continue to view this pattern off last Octobers lows as a three wave rally.
And the current highs are completing wave (c) of [ii].
This is best viewed on the 4hr chart.
Wave (c) of [ii] is shown in full on the hourly chart.
The initial rally off the wave (b) low is viewed as a leading wedge now.
This initial rally pattern is the reason that I kept with the previous wave count for so long,
as it does read well as a three wave correction higher also.
But here we are!
Wave ‘iii’ traced out a five wave extended pattern completing in an ending diagonal.
And wave ‘v’ has hit a new high for the rally today which seals the deal for this count.
In theory this rally is now complete in wave (c).
Of course only time will tell if that is enough to call a halt to this wave (c) rally.
Tomorrow;
Watch that wave ‘iv’ low again at 4049.
Wave ‘i’ of (i) of [iii] should break that level with ease if this market does turn lower.
SILVER.
SILVER 1hr
SILVER 4hr.
SILVER daily.
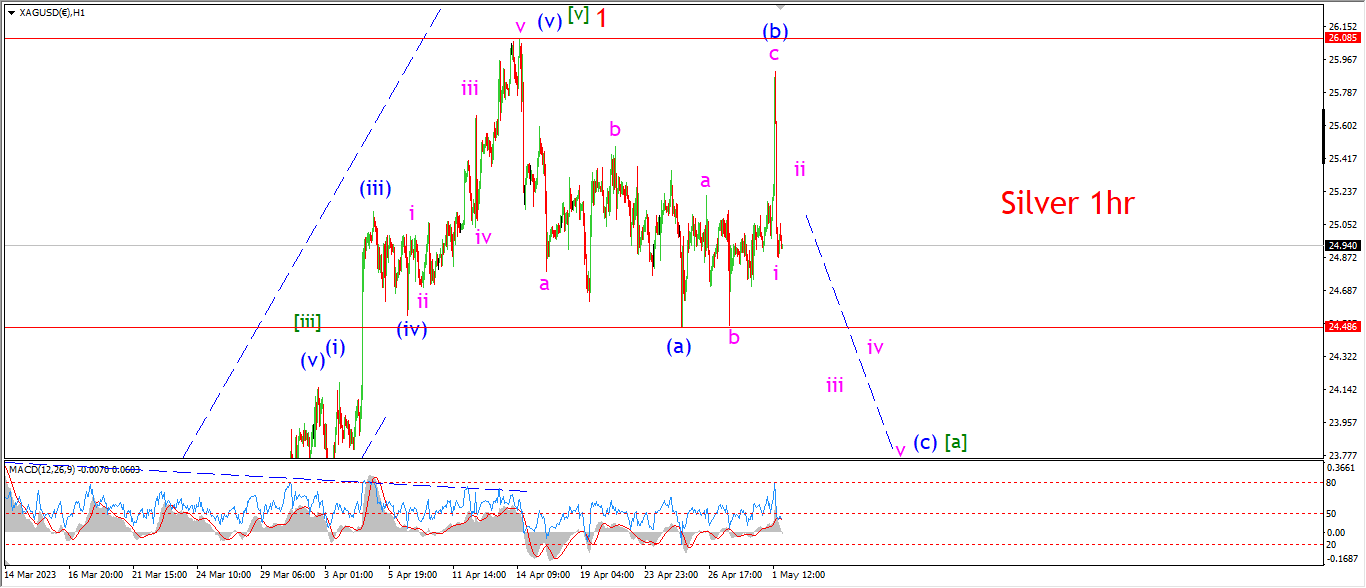
Silver staged a major surprise rally today and almost broke to a new high
but failed to manage that and reversed just as quickly this evening.
I cant explain the reason for that spike,
it happened in the premarket U.S and then as soon as the market opened,
immediately all gains wiped out.
I smell a rat at work here!
Any,
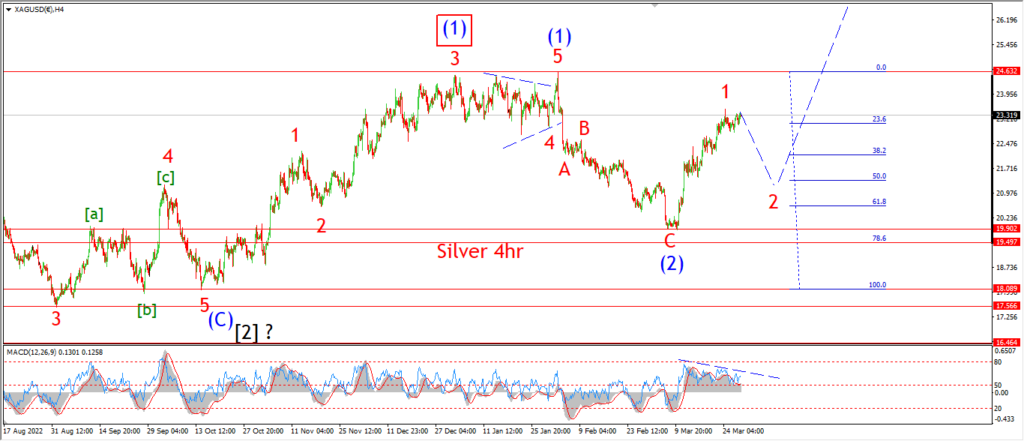
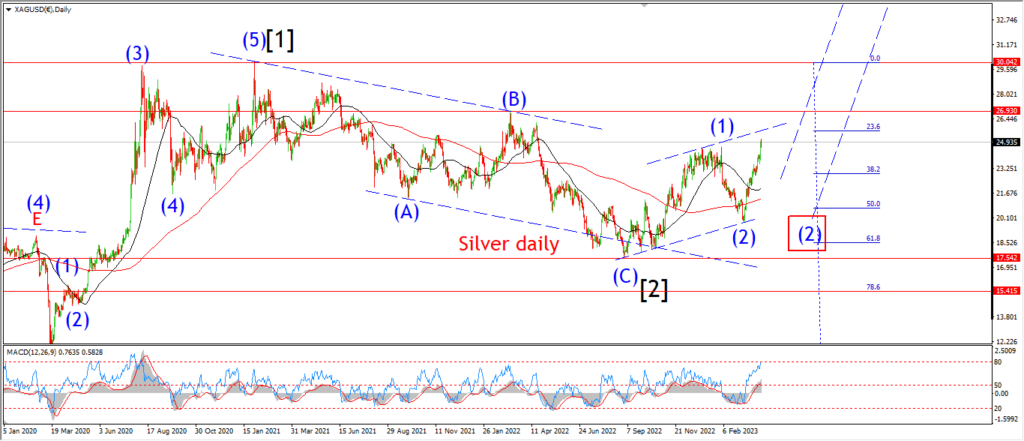
the main count holds for wave [a] of ‘2’.
Wave (c) should now be well underway with that sharp decline.
We should see a break of 24.48 at a minimum in wave (c).
BITCOIN
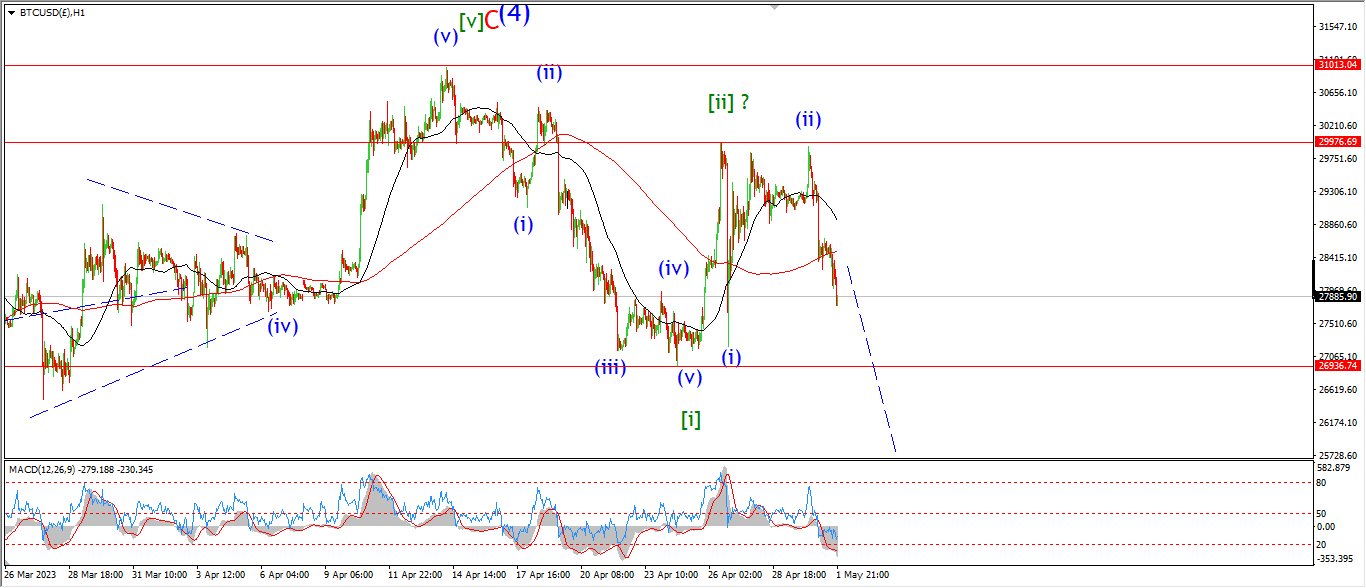
BITCOIN 1hr.

BITCOIN 4hr.
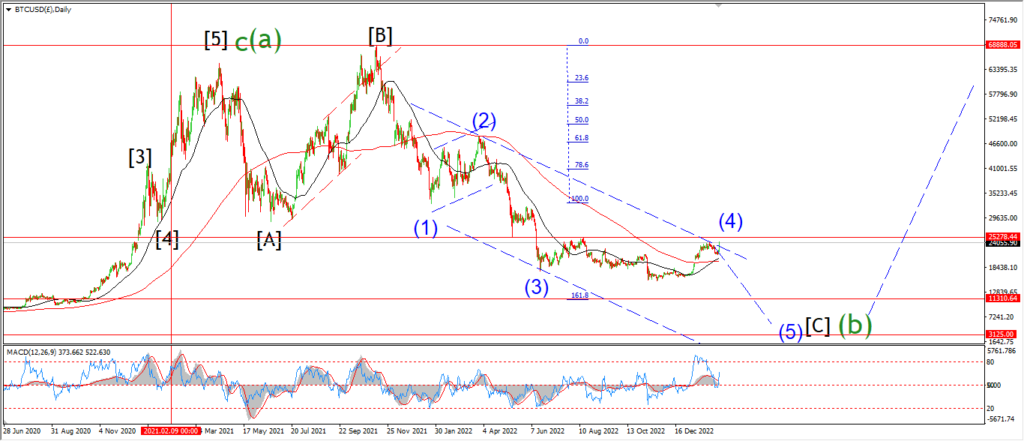
BITCOIN daily.
….
FTSE 100.
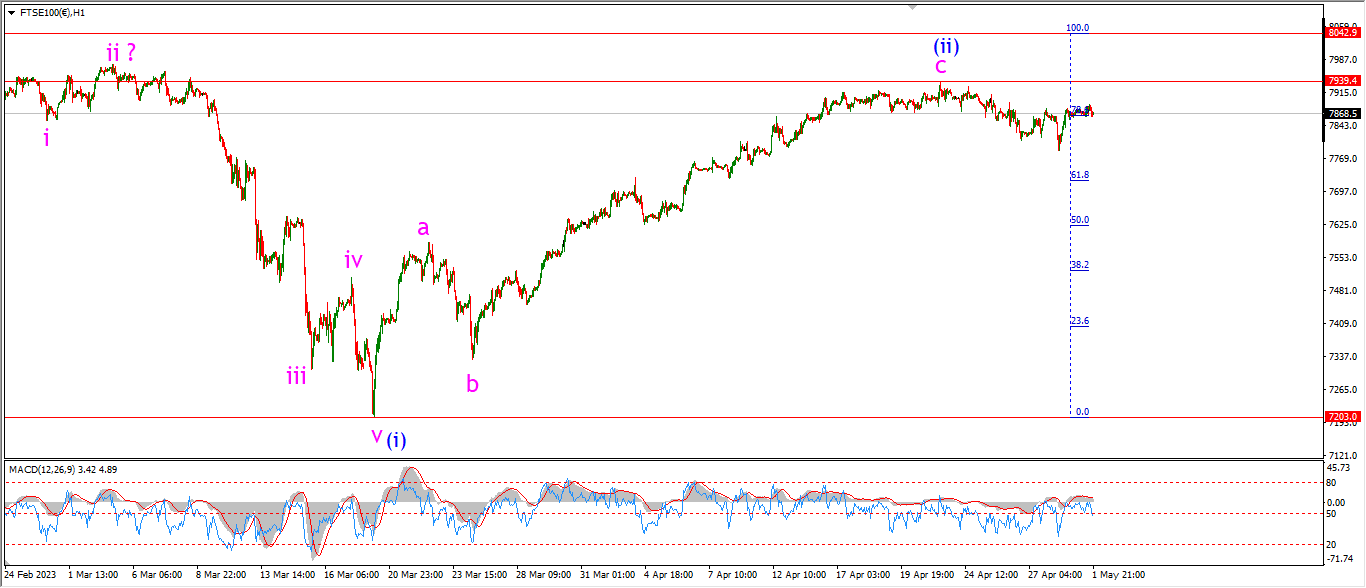
FTSE 100 1hr.
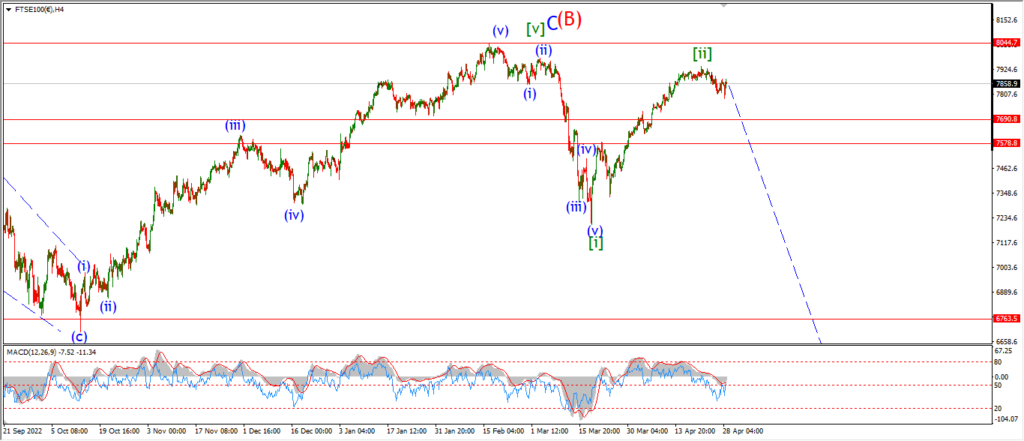
FTSE 100 4hr.

FTSE 100 daily.
….
DAX.
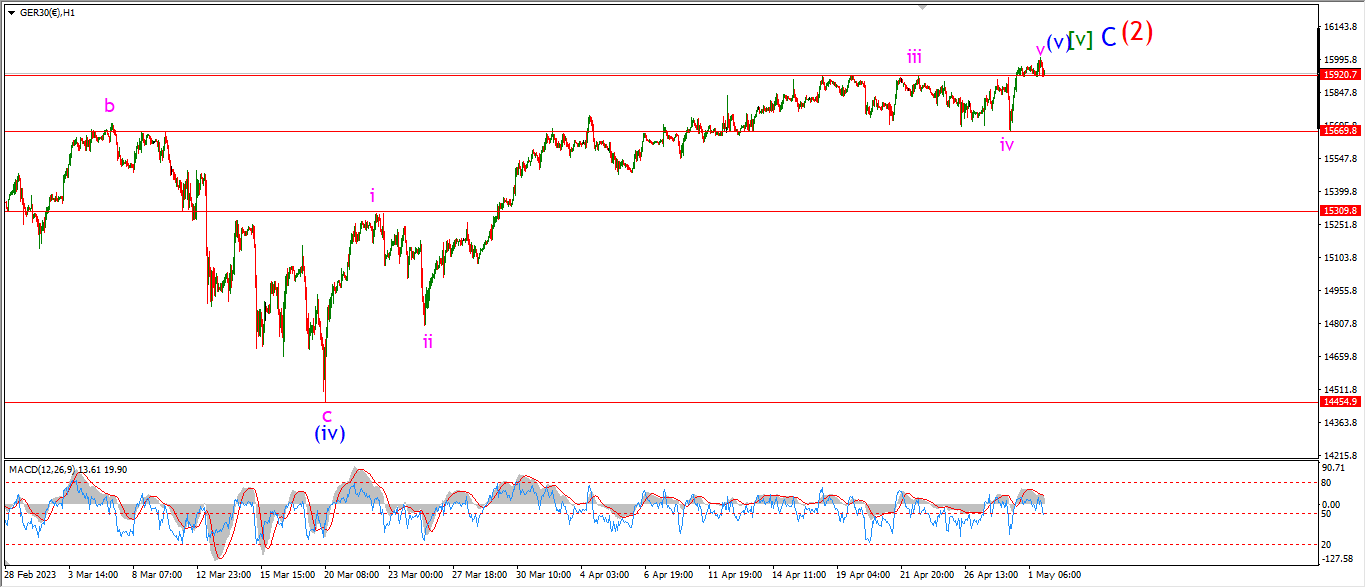
DAX 1hr
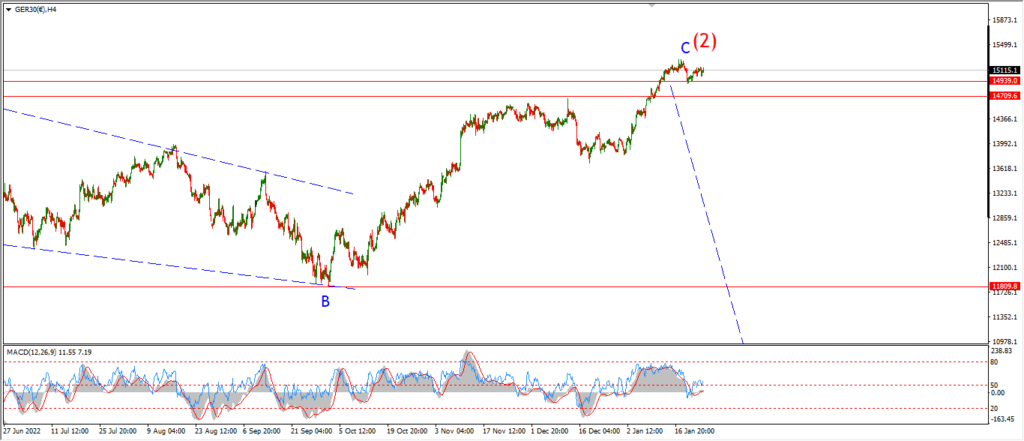
DAX 4hr

DAX daily.
….
NASDAQ 100.
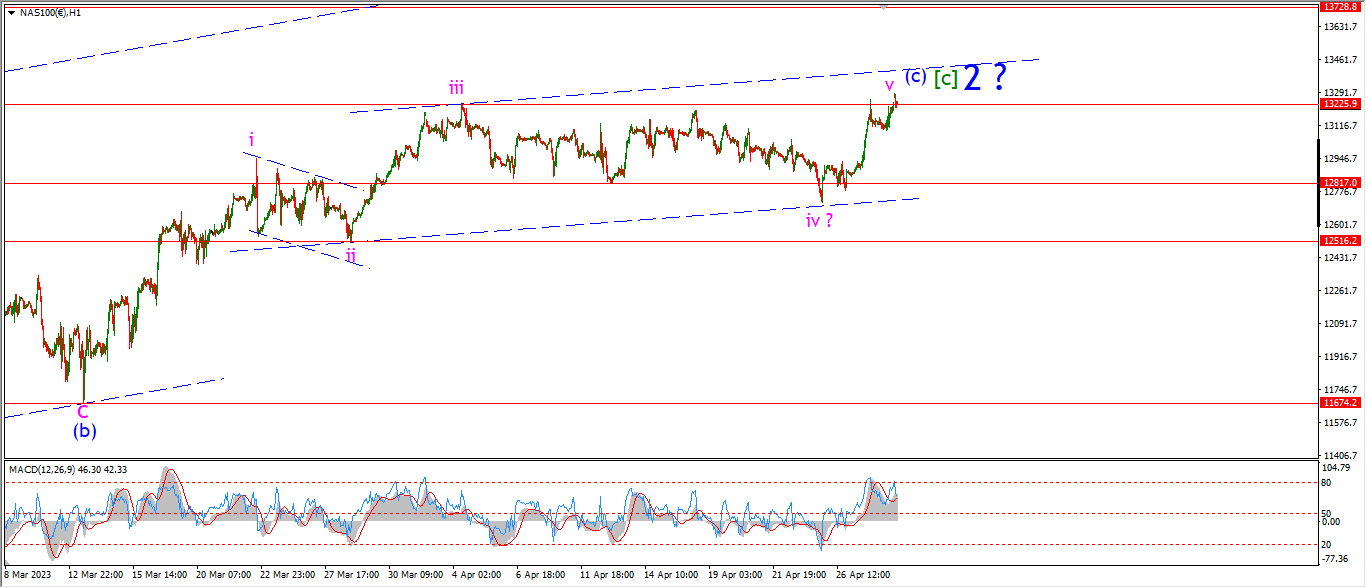
NASDAQ 1hr
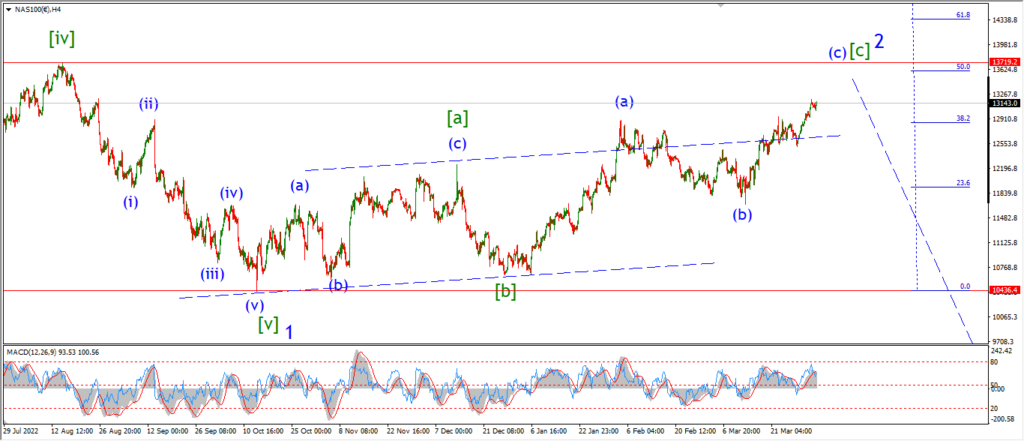
NASDAQ 4hr.

NASDAQ daily.
….