
Good evening to one and all.
The Lord’s Blessing’s to you all again tonight.
I am wondering if something has snapped in the markets today.
Did we finally get that long awaited regime change here?
Its too early to tell,
but I am hopeful now that a possible turn in the markets is beginning at least.
On with the show!
https://twitter.com/bullwavesreal
EURUSD.
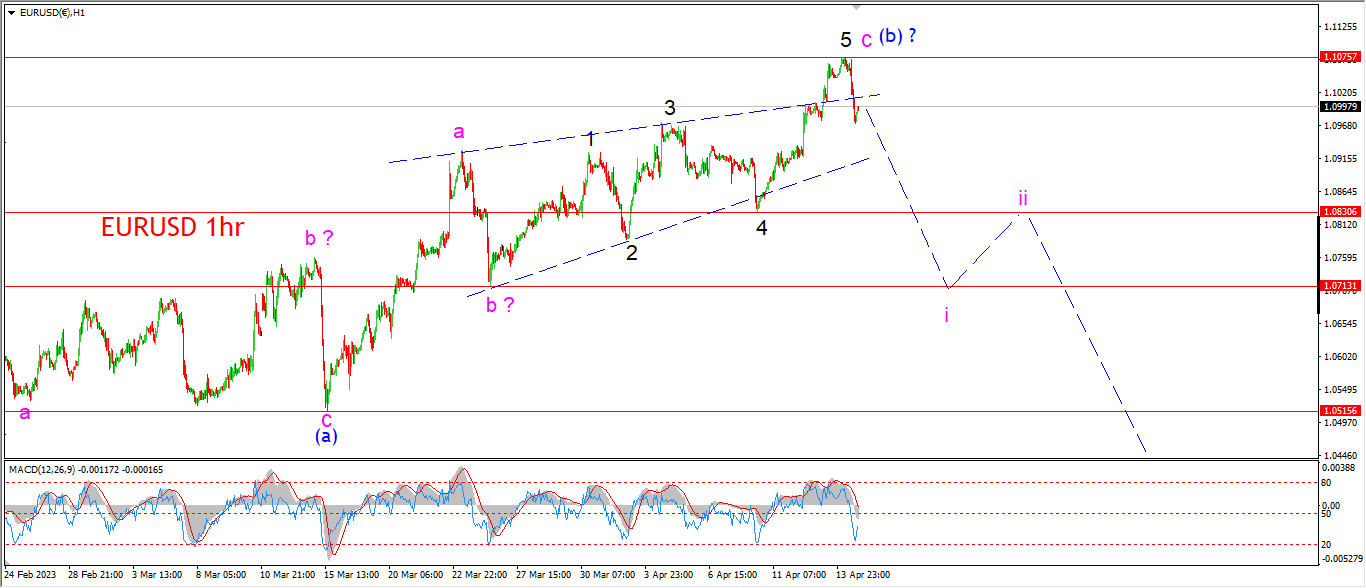
EURUSD 1hr.
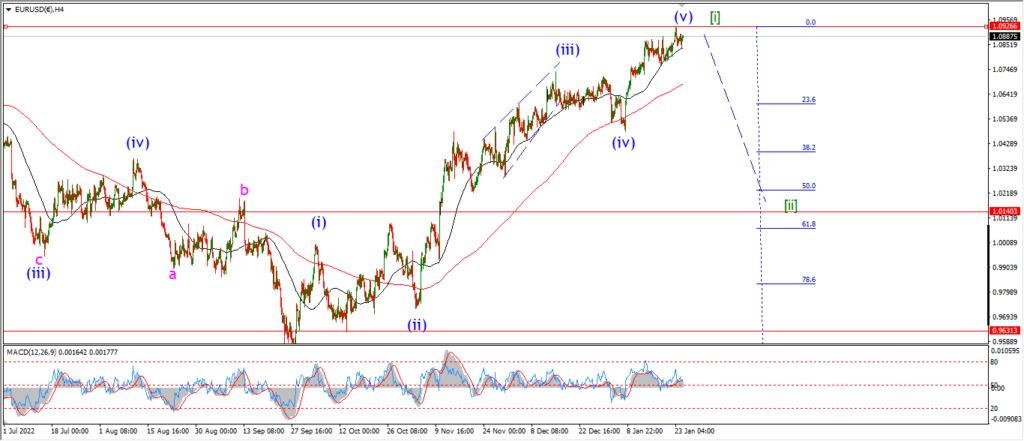
EURUSD 4hr.

EURUSD daily.
EURUSD is again making an attempt at turning impulsively off the top of wave (b).
The price has dropped back into the rising wedge today which has at least put a stop the rally in wave ‘c’ for now.
I want to see a drop below wave ‘4’ at 1.0830 as an initial signal that wave ‘i’ of (c) is underway.
Monday;
watch for that wave (b) top to hold first on Monday.
Five waves down in wave ‘i’ should fall back into the 1.0700 handle again as shown.
GBPUSD
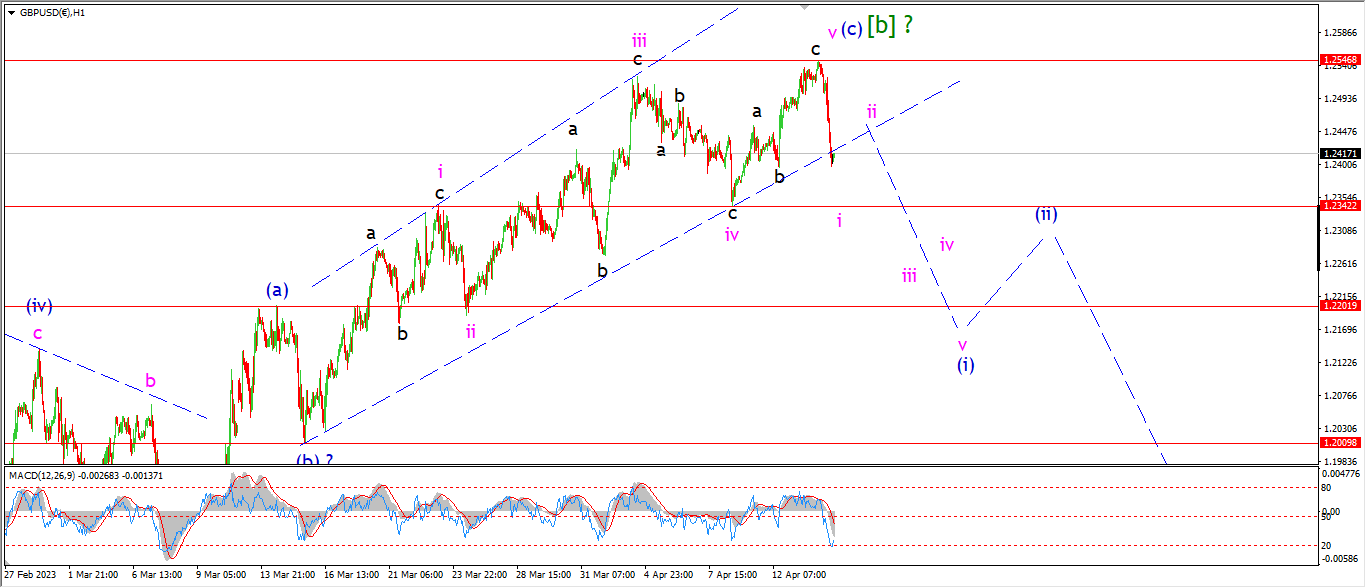
GBPUSD 1hr.
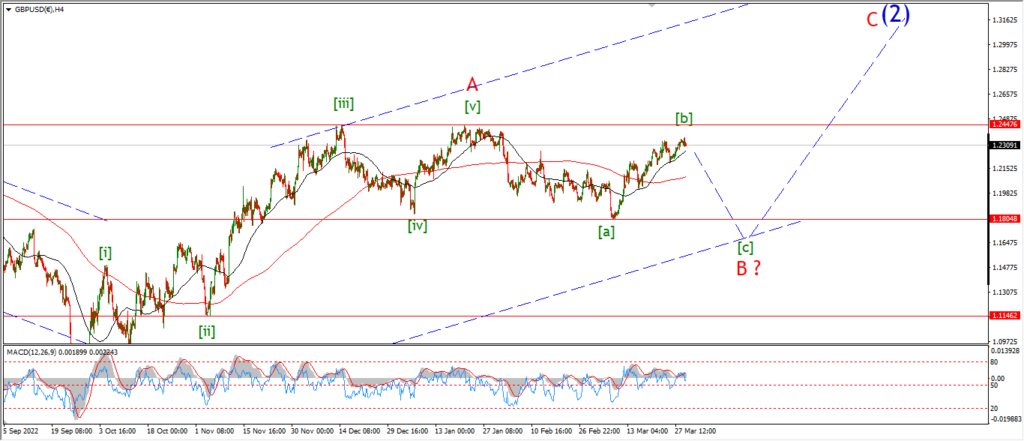
GBPUSD 4hr.

GBPUSD daily.
Cable also reversed off this weeks top in an impulsive manner today.
The top of wave [b] now sits at 1.2547.
WAve (i) of [c] down will be confirmed with a break of 1.2200 again.
But a break of the wave ‘iv’ low at 1.2342 will signal a possible reversal is in play.
Monday.
watch for wave (i) of [c] to take over and drop into 1.2200 to confirm the top.
If we see a lower high early in the week,
that will suggest wave ‘i’ and ‘ii’ is complete.
USDJPY.
USDJPY 1hr.
USDJPY 4hr.

USDJPY daily.
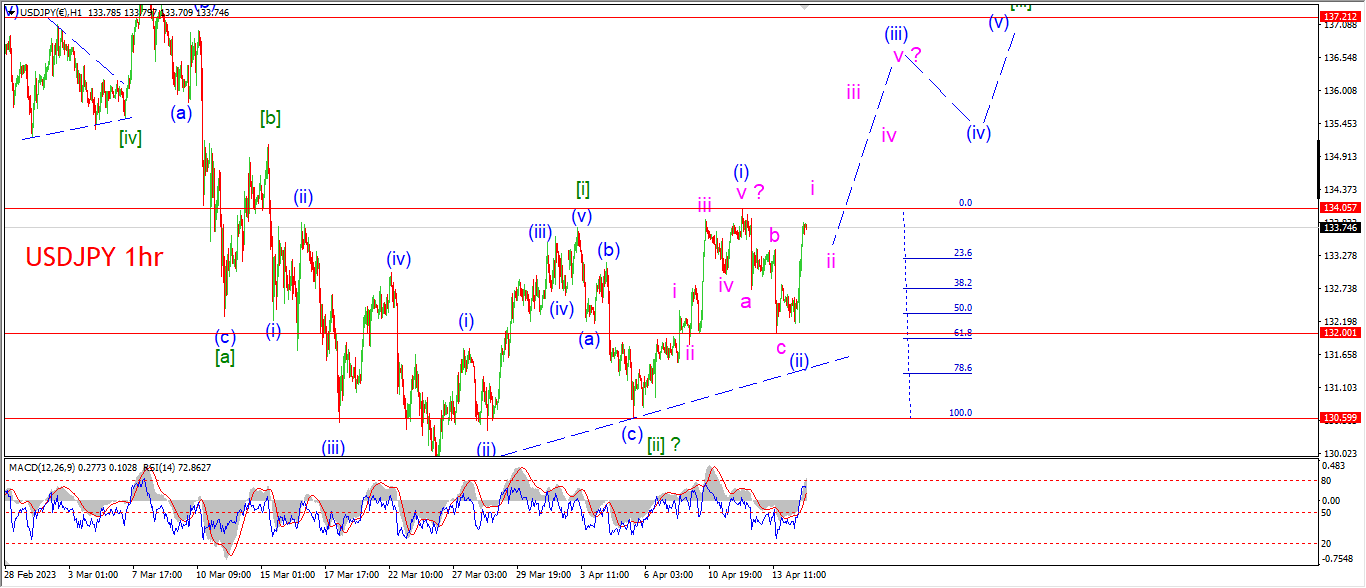
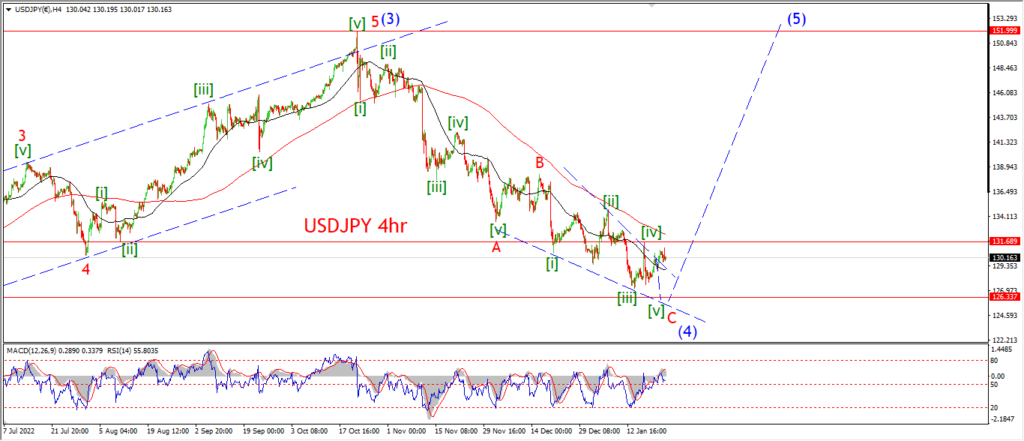
The rally today has retraced most of the wave (ii) decline now.
So the action now favors the bullish setup again as we hit the close this evening.
I want to see a solid acceleration in wave (iii) of [iii] next week.
I am suggesting a top near 136.00 for wave (iii).
And once we see a break above the wave (i) high at 134.05 again that will definitely add weight to the idea here.
Tomorrow;
Watch for wave (iii) to take over next week.
Wave ‘i’ and ‘ii’ should form a higher low above 132.00.
DOW JONES.
DOW 1hr.
DOW 4hr
DOW daily.
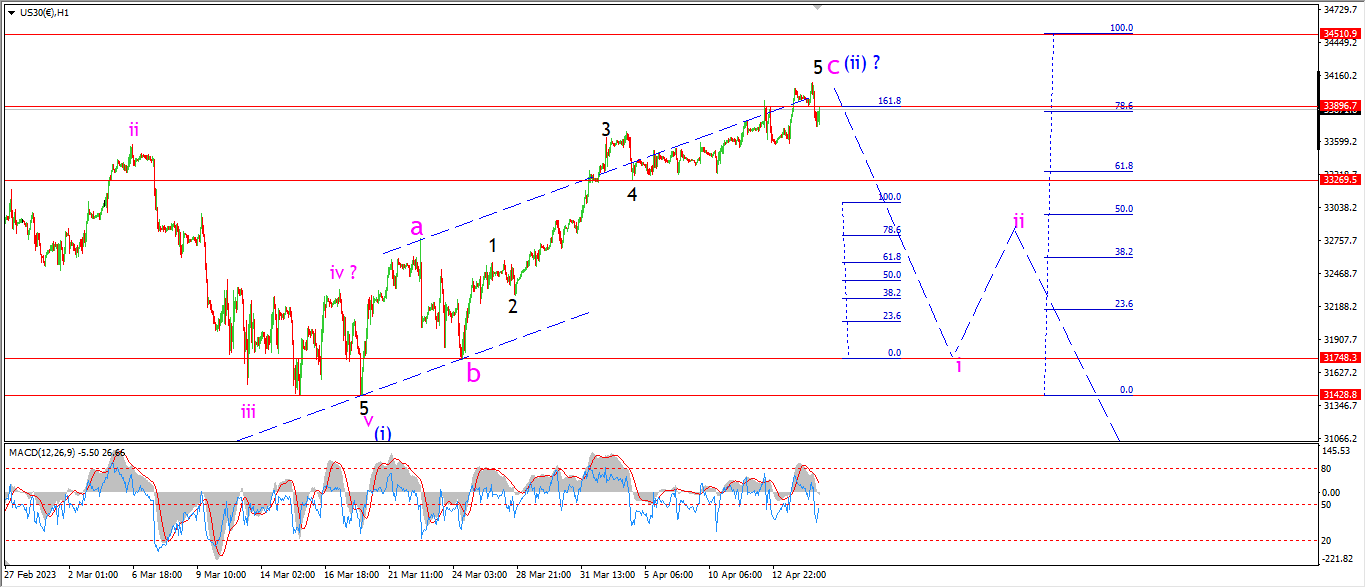
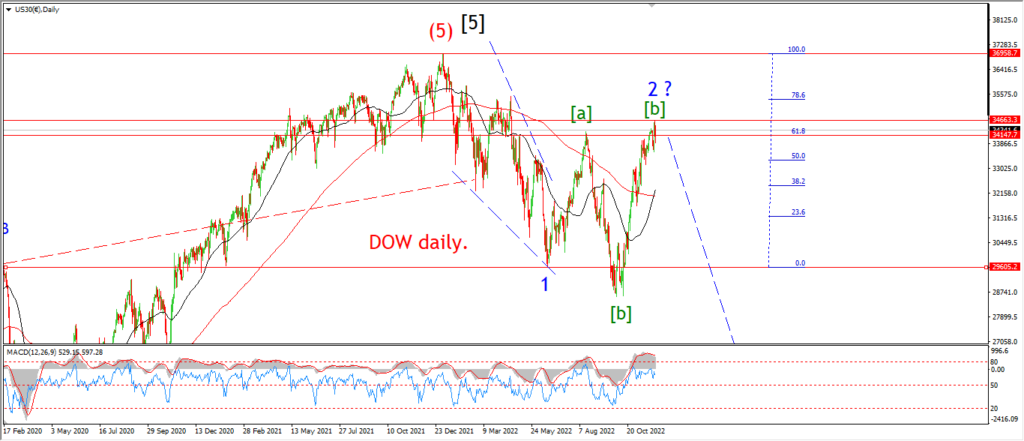
I did a little review of the Fibonacci relationships within the wave (ii) pattern on the video earlier today,
so I suggest you take a look at that to see how nice this pattern has actually developed in wave (ii).
A quick run down for you here.
Wave ‘c’ pink topped out just above the 162% extension of wave ‘a’.
Wave ‘5’ of ‘c’ reached 100% of wave ‘1’ of ‘c’.
Wave ‘3’ of ‘c’ reached 162% of wave ‘1’ of ‘c’.
And all that managed a break of the 78.6% retracement,
with the market closing below that level again this evening.
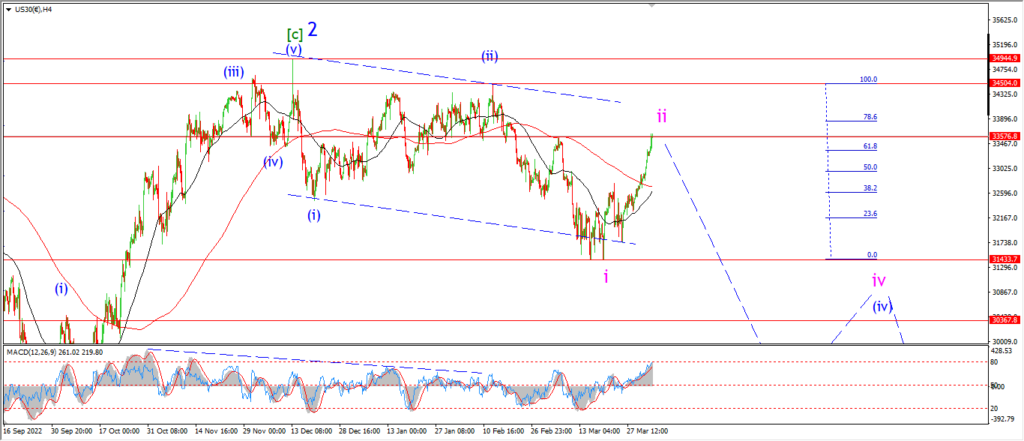
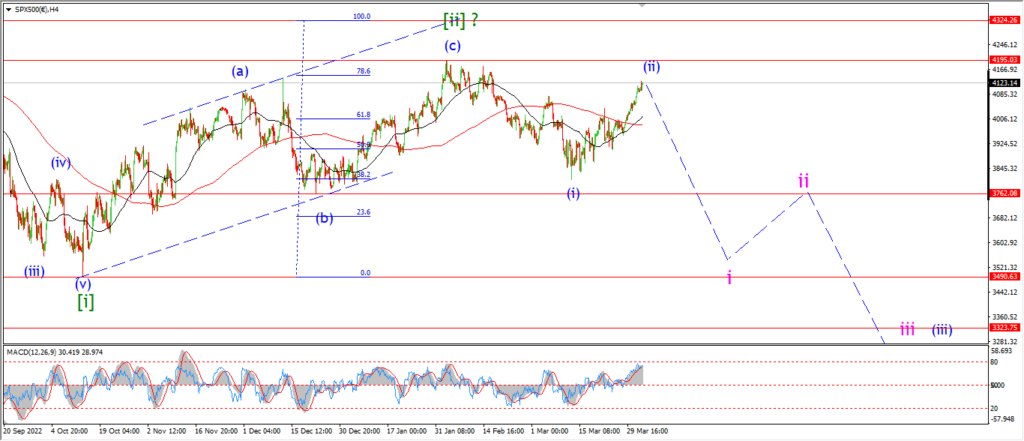
I laid out my case here for a major reversal down into wave (iii) of [iii].
I just cant say for certain that call will come to pass.
I am just looking at the possible patterns from the largest degree down to the hourly charts.
And the present you with my findings.
I cannot see a bullish outcome here,
but maybe I’m blind!
Monday;
Watch for wave (ii) to hold below that invalidation high at wave [ii] green at 34500.
Wave ‘i’ of (iii) must turn down and fall in five waves towards 32000 again.
GOLD
GOLD 1hr.
GOLD 4hr.

GOLD daily.
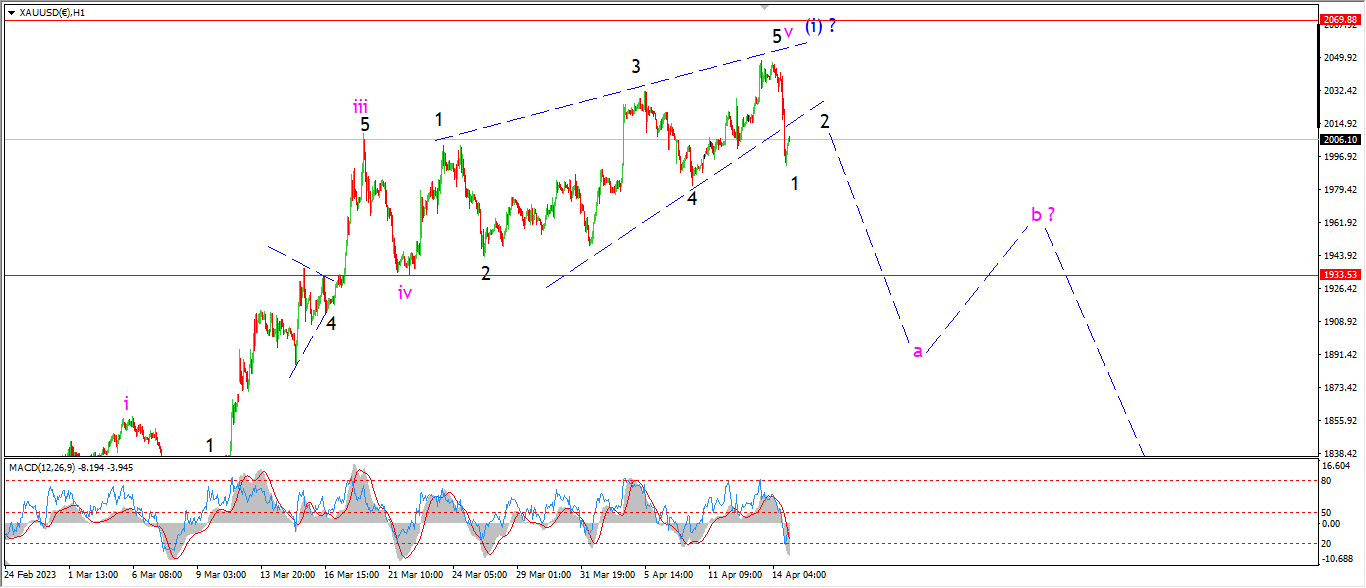
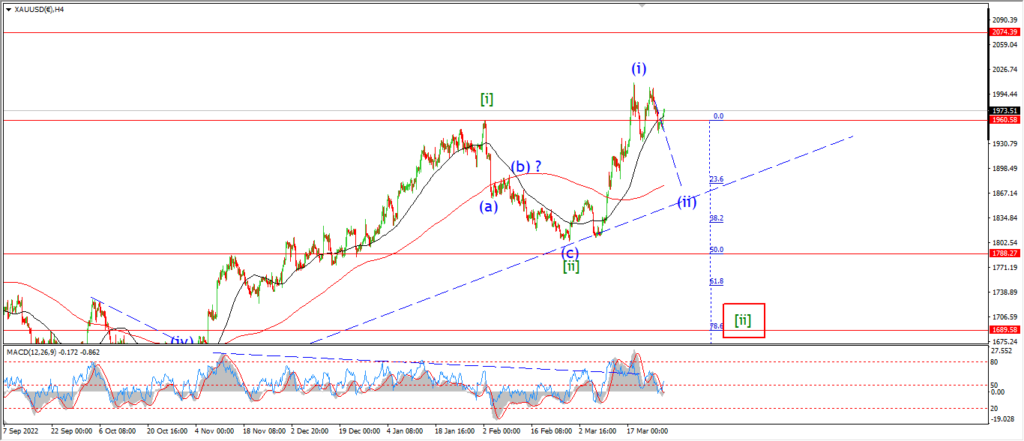
Gold sliced down below the rising wedge pattern today after a possible top in wave ‘v’ of (i) at yesterdays highs.
You know I am looking for a decline into wave ‘a’ of (ii) now.
And wave ‘a’ should break below 1930 at a minimum.
todays decline may be wave ‘1’ of ‘a’,
and that suggests we will see a second wave lower high at wave ‘2’ on Monday.
Monday;
Watch for the price to form a bearish lower high in wave ‘2’ of ‘a’.
Wave ‘a’ should continue lower for most of next week if the top has finally been formed at Thursdays high.
CRUDE OIL.
CRUDE OIL 1hr.
CRUDE OIL 4hr.
CRUDE OIL daily.
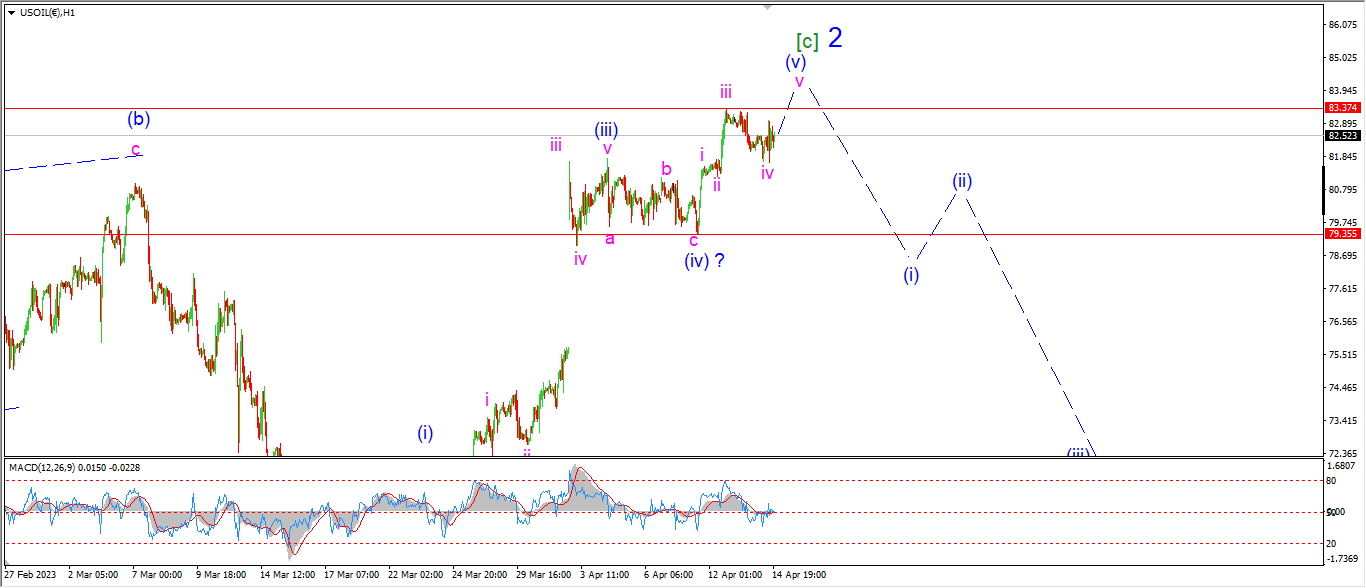
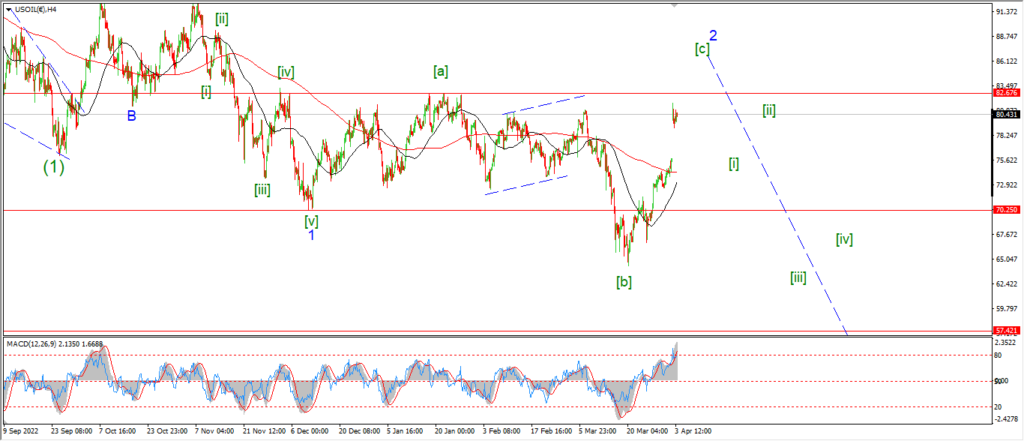
Crude has found a temporary top at 83.37,
I am labelling this as wave ‘iii’ of (v) of [c].
So at the moment the pattern allows for another spike on Monday in wave ‘v’ of (v).
But after that I will be looking for signs of a reversal into wave (i) again.
As you know,
this wave [c] rally is part of an expanded flat correction in wave ‘2’.
And wave [c] will reach 162% of wave [a] at 84.90.
So we are already very close to an ideal high for wave [c] after a sustained rally off the march 20th lows.
Monday;
Watch for wave (v) to complete wave [c] with one more high in wave ‘v’ pink.
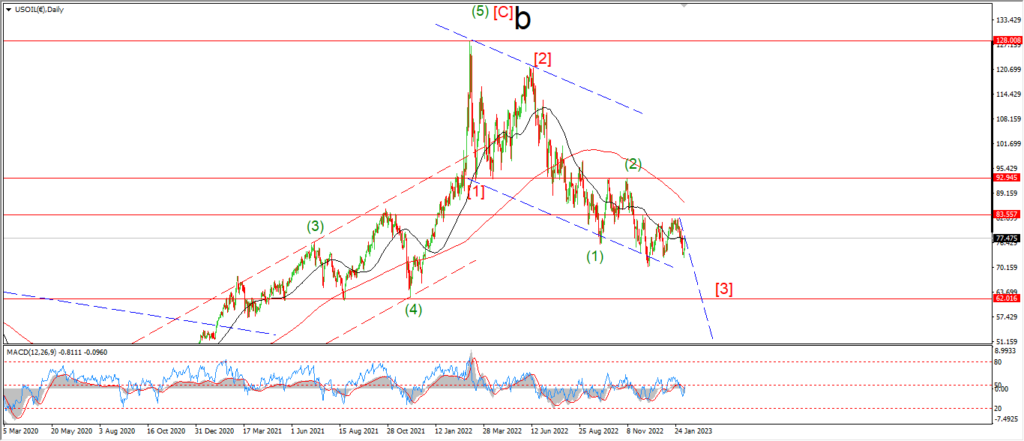
By the second half of the week we should be able to look lower into wave [i] of ‘3’ again.
S&P 500.
S&P 500 1hr
S&P 500 4hr
S&P 500 daily.
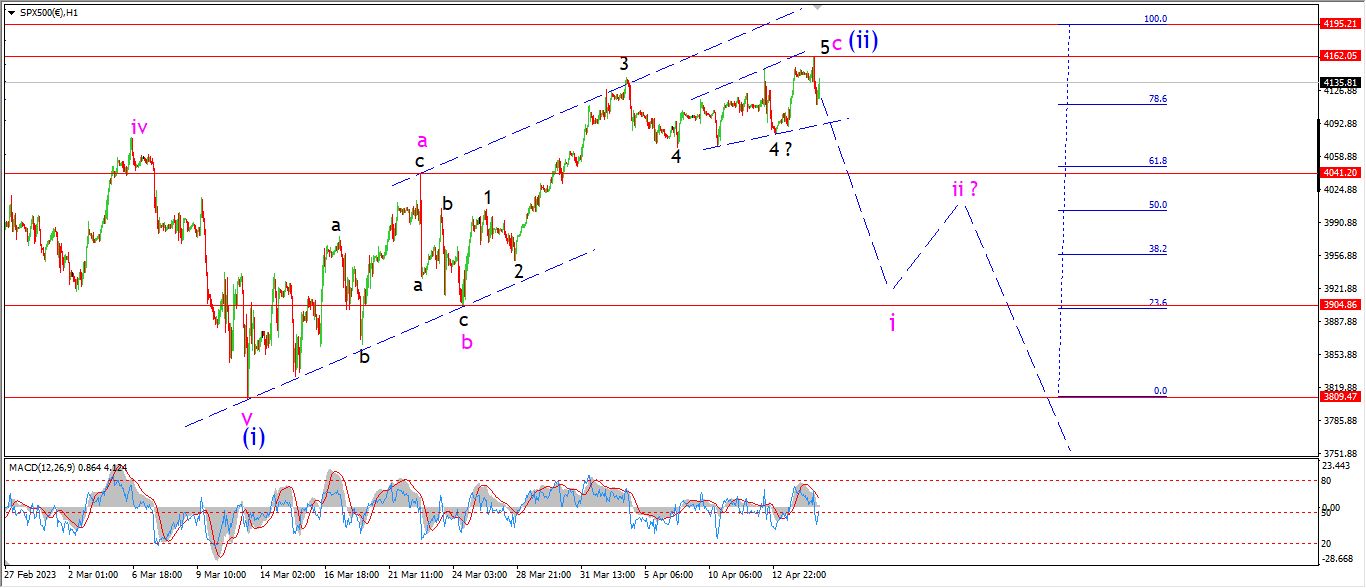
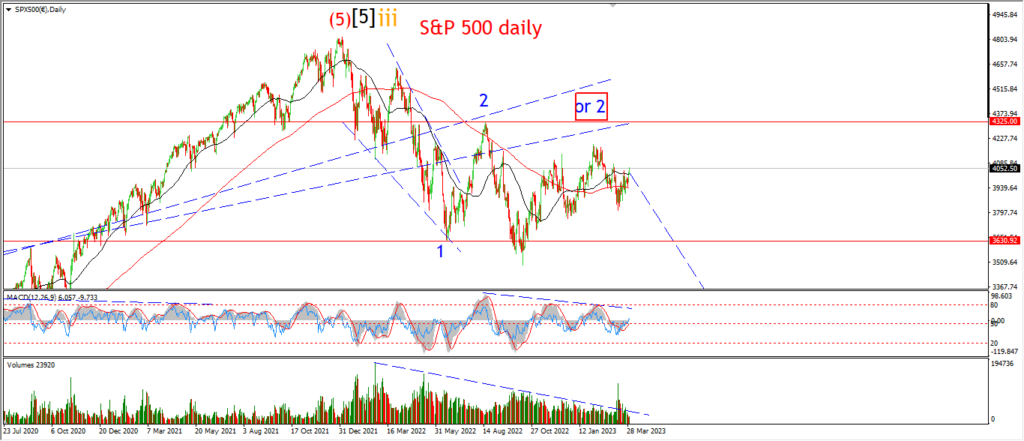
I am wondering tonight about the pattern in wave ‘5’ of ‘c’ again.
There is a possibility that wave ‘5’ formed an expanding wedge pattern.
With wave ‘i’ of (iii) beginning off todays top.
The other competing count for wave ‘c’ suggests wave ‘4’ of ‘c’ is a running flat,
and wave ‘5’ of ‘c’ just completed five waves up at todays high.
All this depends on wave (ii) actually holding below 4195 at the wave [ii] high.
So it is crucial that the market turns lower on Monday to avoid invalidating this count.
Tomorrow;
Watch for wave ‘i’ of (iii) to turn lower immediately on Monday and then break 4040 again.
SILVER.
SILVER 1hr
SILVER 4hr.
SILVER daily.
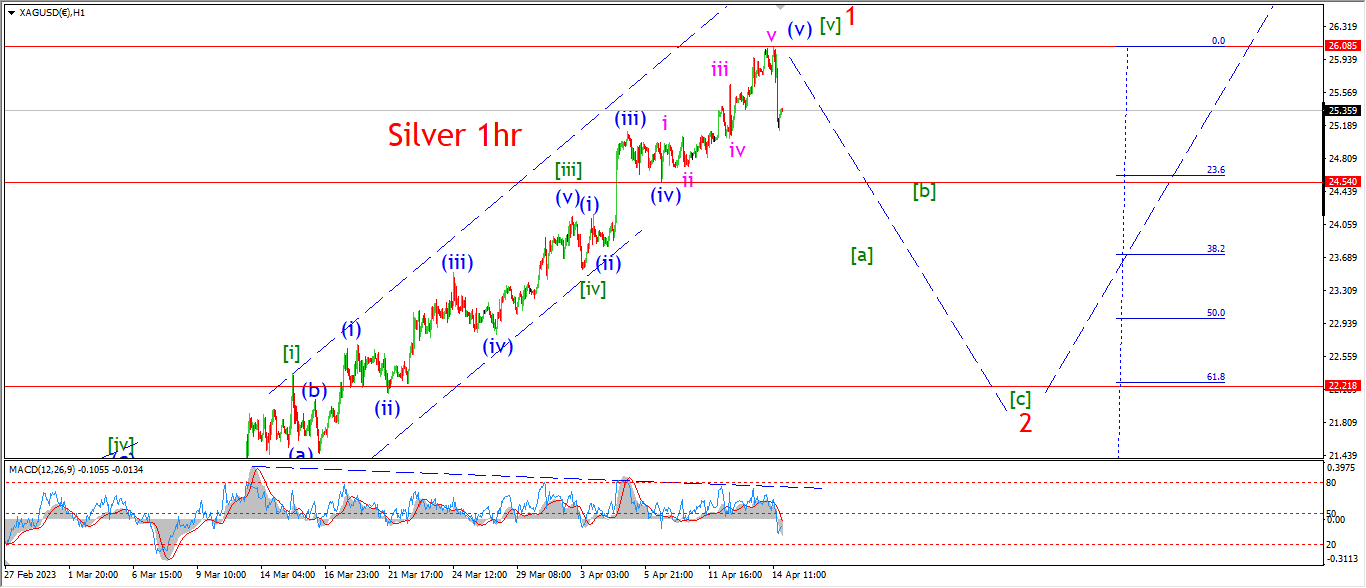
Todays sharp spike lower is actually the largest drop in over a month!
While this does not confirm anything,
it sure is nice to see a drop off a completed pattern for a change.
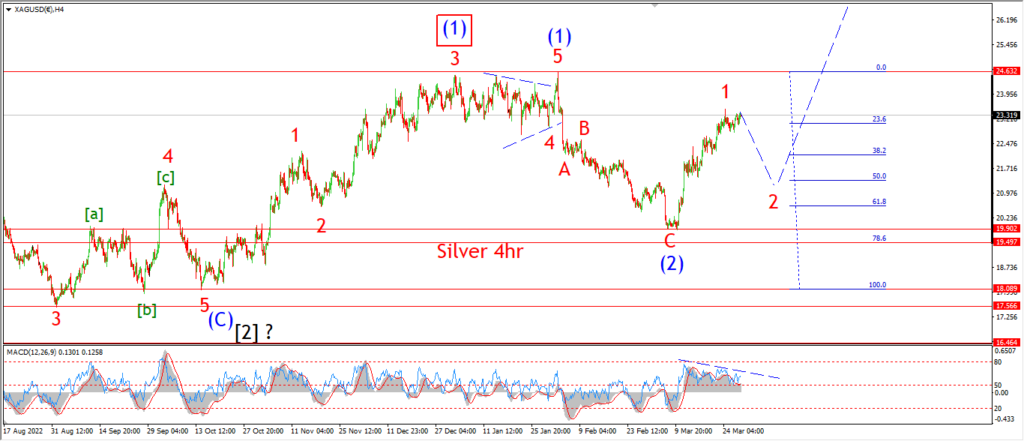
This rally in wave ‘1’ has gone on for far longer than I expected.
And I must admit,
I have been questioning every assumption that I have had lately.
The question now is this,
is todays drop large enough to trigger some doubt in the bullish outlook of the market.
It is possible that hit an exhaustion point today at the top of wave ‘1’.
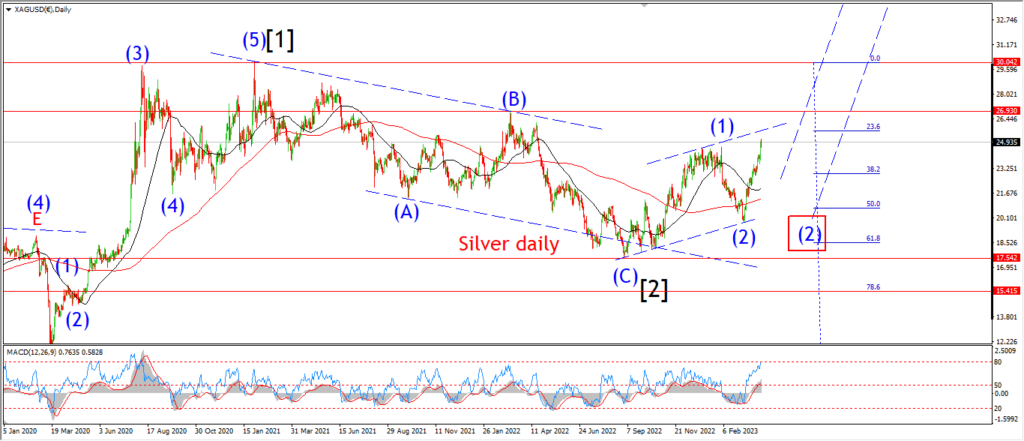
I know there is a correction coming,
but the question is how large will this correction be.
Monday;
Watch for wave ‘1’ to hold at the highs today.
Wave [a] of ‘2’ should fall below 24.50 to signal the top is in,
and wave ‘2’ has begun.
BITCOIN
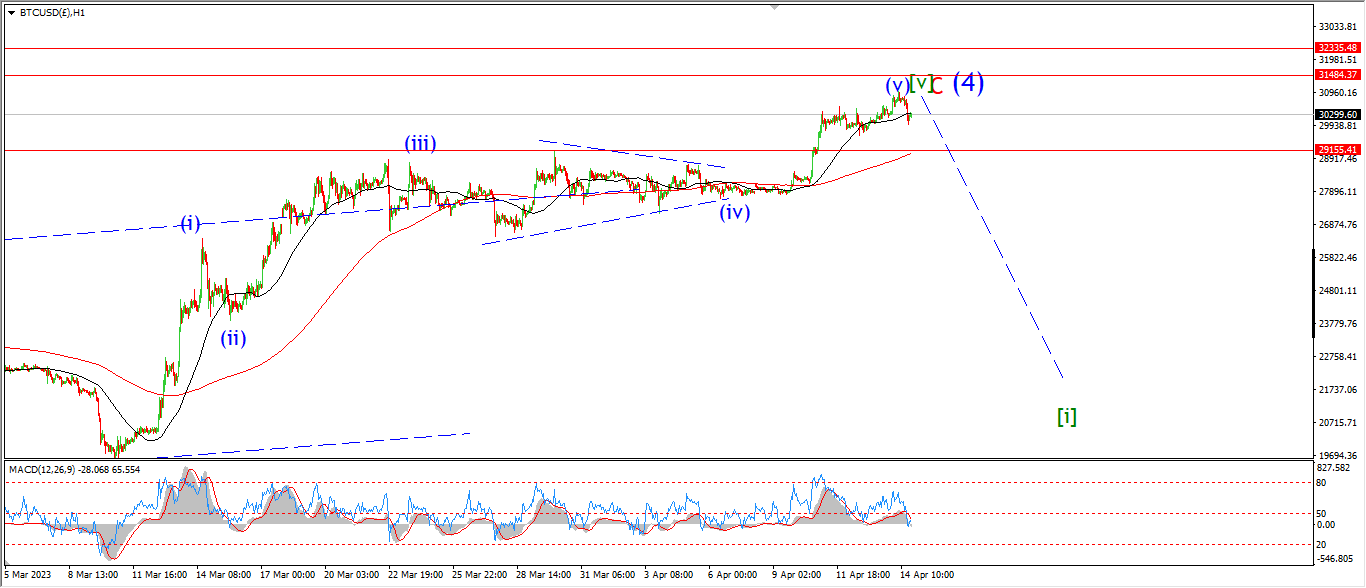
BITCOIN 1hr.

BITCOIN 4hr.
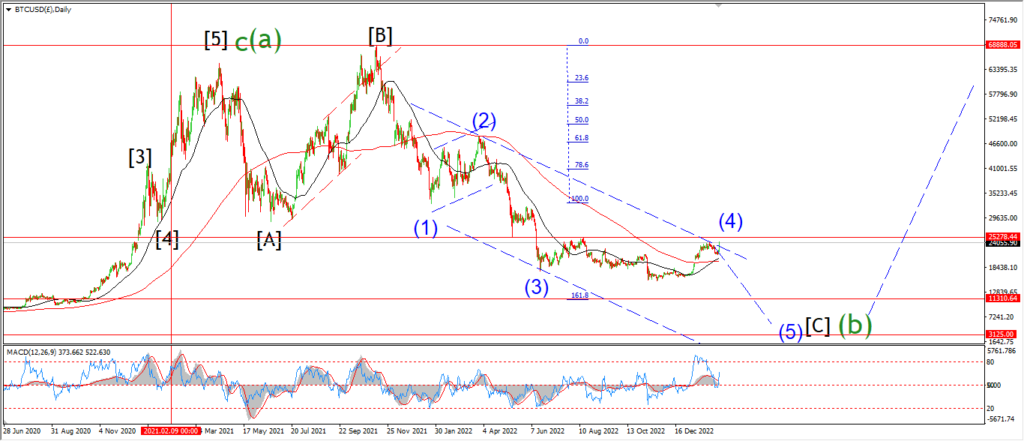
BITCOIN daily.
….
FTSE 100.
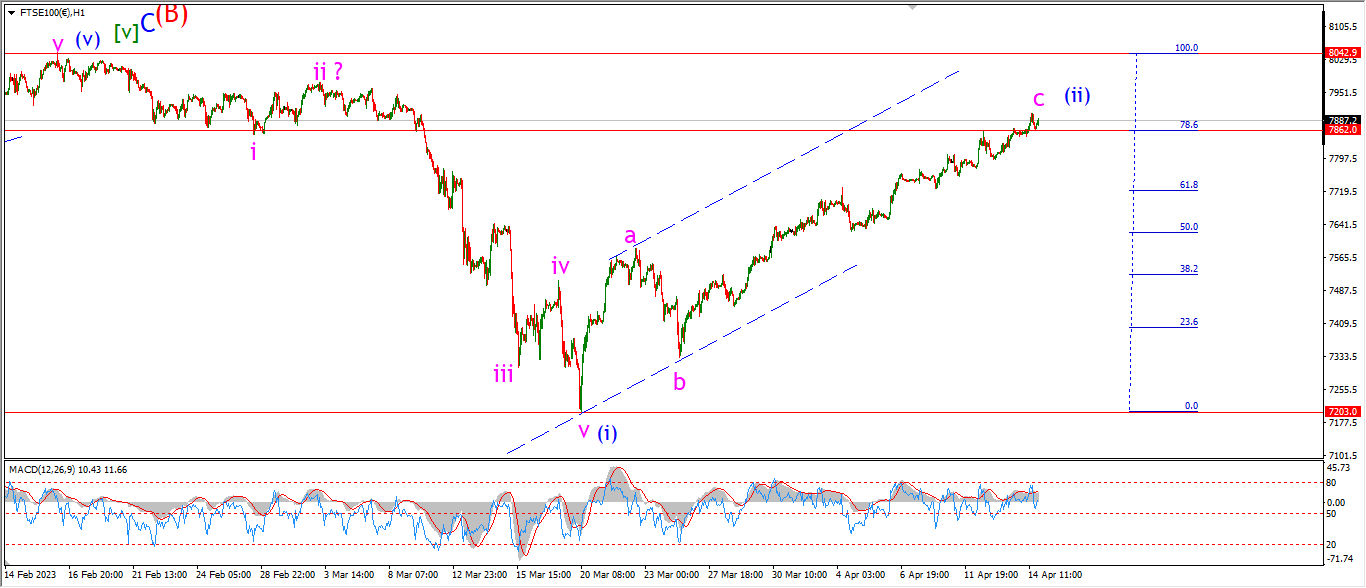
FTSE 100 1hr.
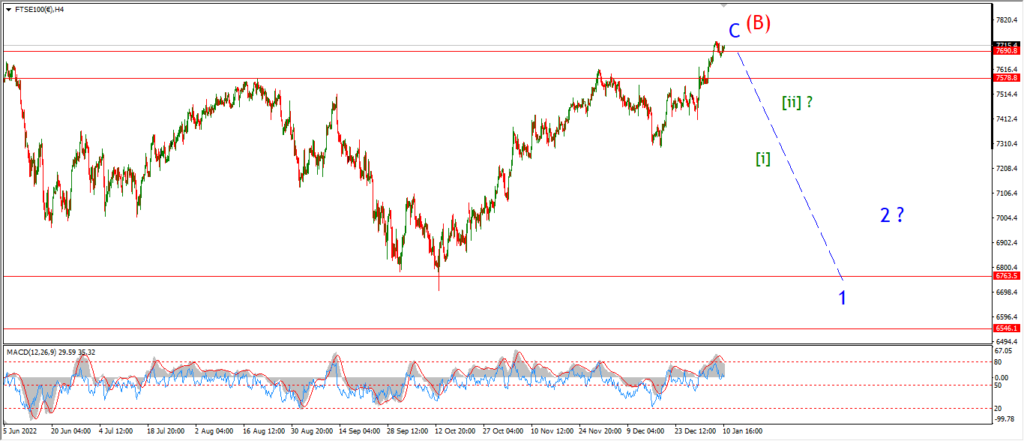
FTSE 100 4hr.

FTSE 100 daily.
….
DAX.
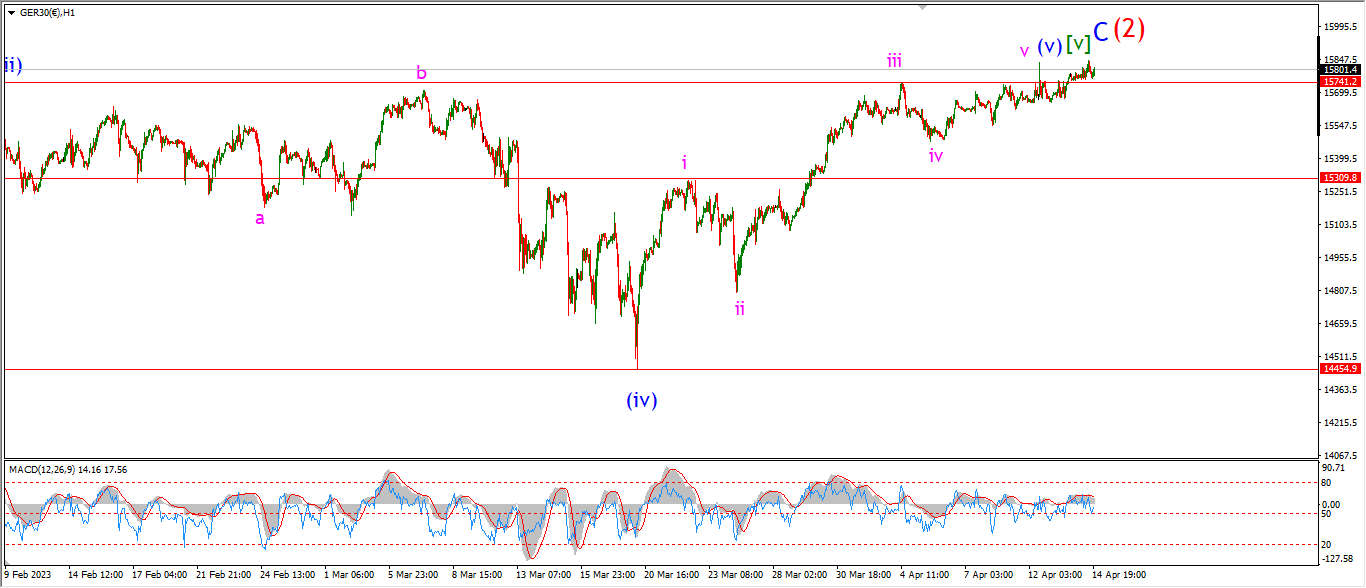
DAX 1hr
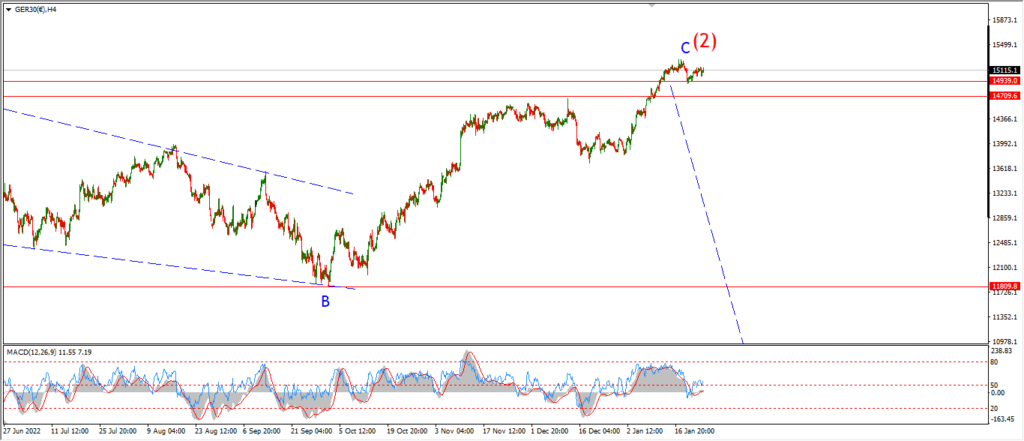
DAX 4hr

DAX daily.
….
NASDAQ 100.
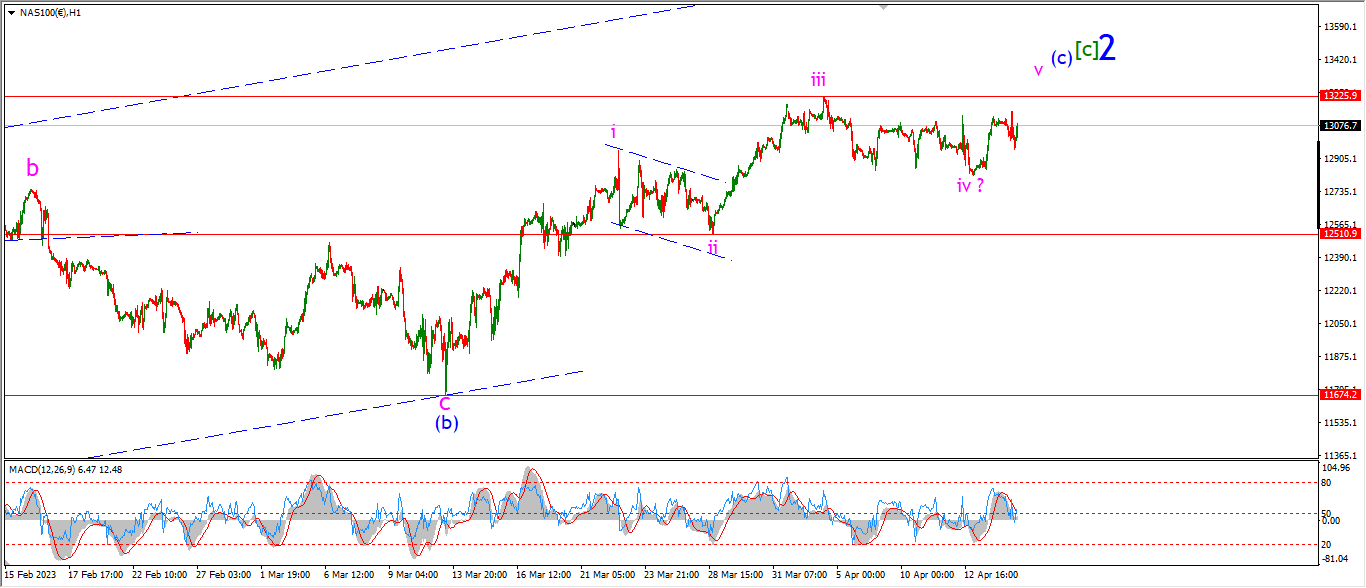
NASDAQ 1hr
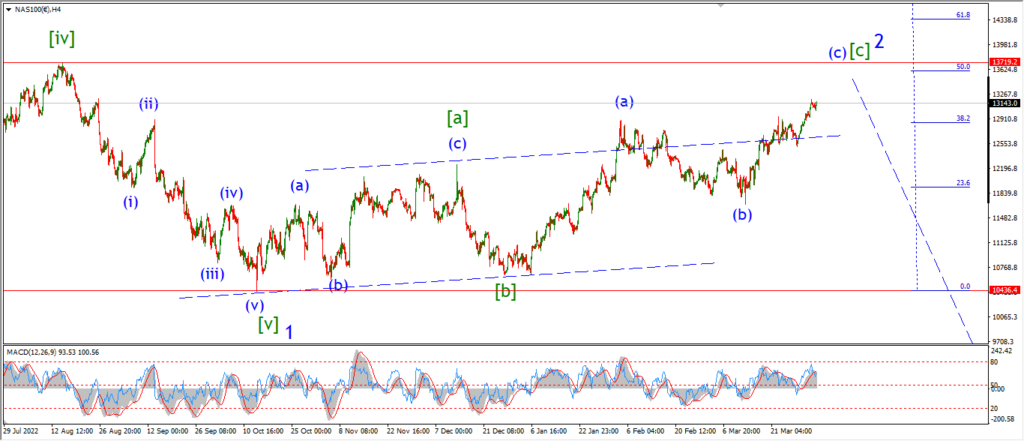
NASDAQ 4hr.

NASDAQ daily.
….