
Good evening to one and all.
The Lord’s Blessing’s to you all again tonight.
The end of another week is upon us and the word for this week is definitely ‘levitation’.
The main patterns remain valid for the most part.
Although waiting for a reversal is painful,
I can see complacency has rushed back to the fore and the answer I hear to all problems now seems to be ‘buy stocks and gold’.
Yes, both.
The USD is hated across the board,
I have seen more headlines this week about the loss of USD reserve status than the last 3yrs put together I think.
It was the word on the street everywhere!
Little do people realize that a massive 60USD billion repo loan was issued to mainland china from the Fed only a few weeks back!
Why does the big contender for reserve status need a 60billion bailout??
Also,
Chinese illegal immigration to the U.S is up 1500% over the last year.
And the Chinese government decided to stop all publication of economic data last month.
That suggests only one thing to me,
china’s economy is falling apart before our eyes.
There will no Chinese Yuan reserve currency.
But there will be a Chinese war soon!
Lets see what that does to the global economy eh!
Things are getting uglier by the day on dear old planet earth!
Time for that long awaited ‘come to Jesus’ moment I think.
Ok,
lets see what the market gave us today.


https://twitter.com/bullwavesreal
EURUSD.
EURUSD 1hr.
EURUSD 4hr.

EURUSD daily.
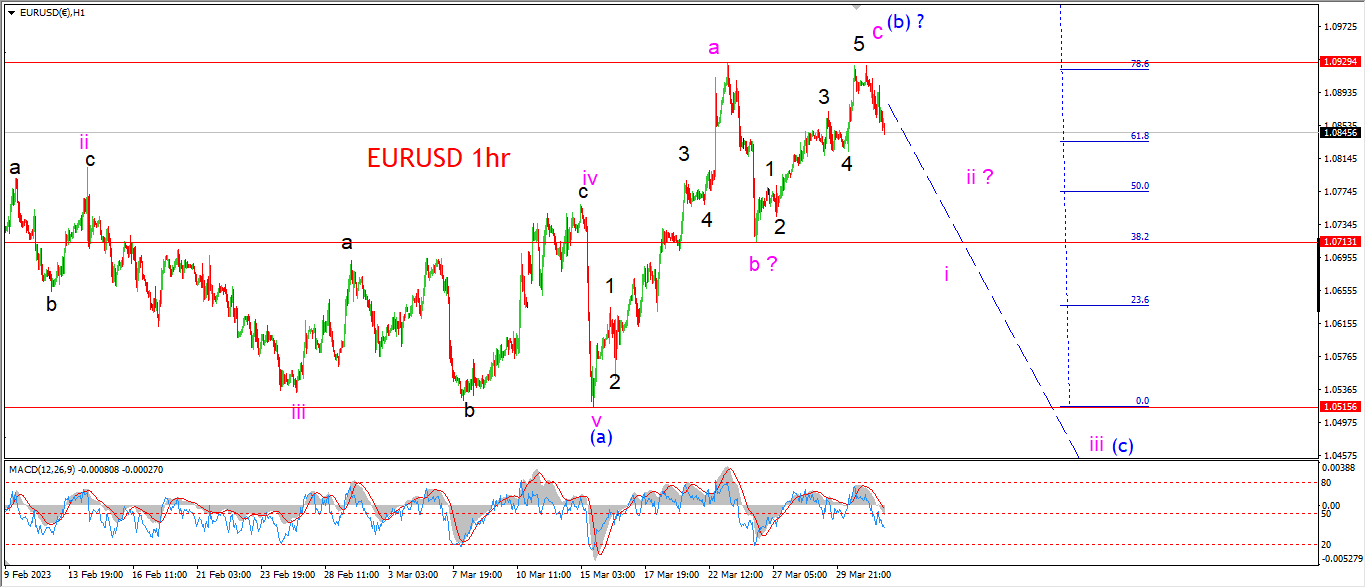
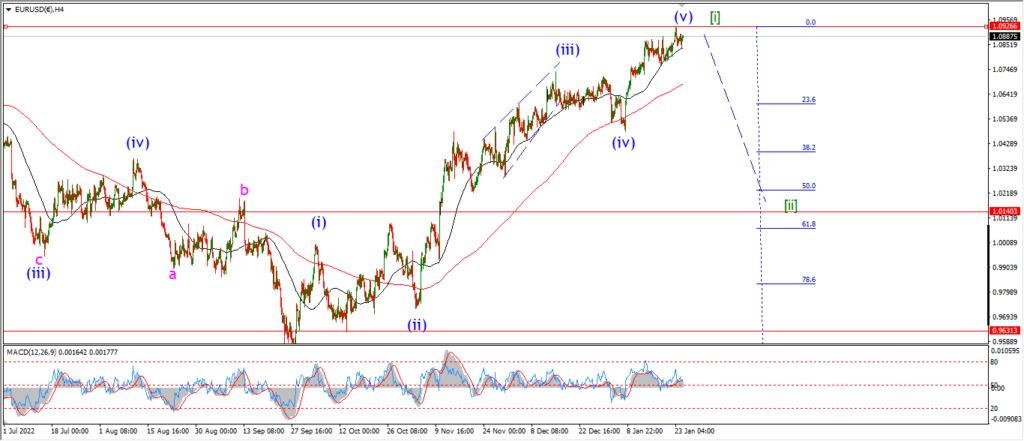
EURUSD has drifted back off the highs of wave (b) this evening without hitting a new high at all.
The 78.6% retracement level seems to be a resistance level to far.
the price must turn lower again to signal wave (c) is underway,
but once we see a break of that wave ‘b’ low at 1.0713 again I think we can then be sure wave (c) has begun.
Monday;
Watch for wave ‘c’ to top out and then wave ‘i’ of (c) will be ready for action early in the week.
GBPUSD
GBPUSD 1hr.
GBPUSD 4hr.

GBPUSD daily.
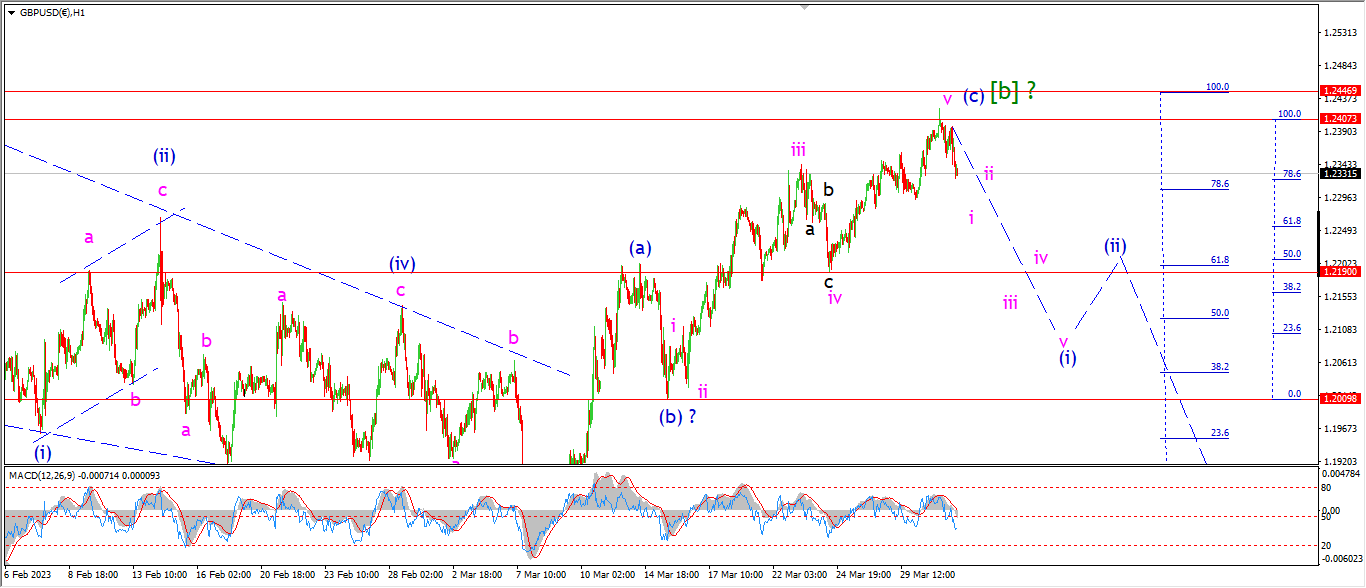
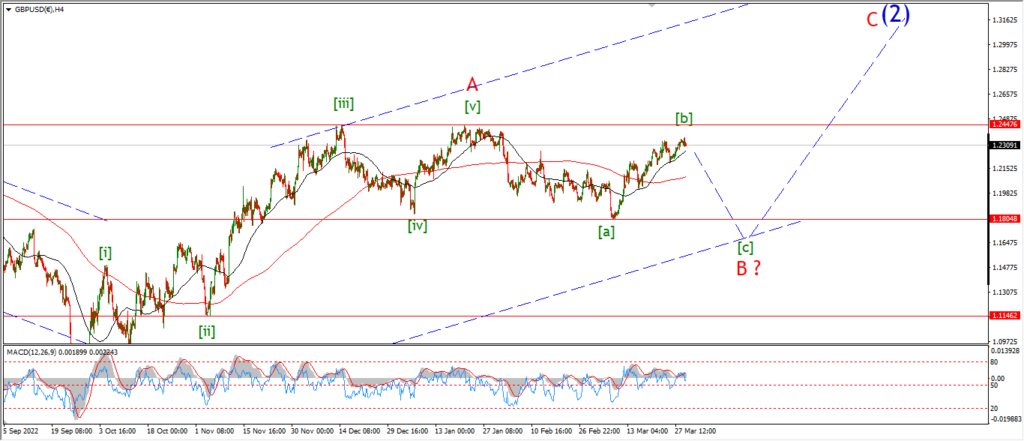
The top of wave [b] has held below the previous 1.2446 high again today.
If we see a failure again next week,
that will be the third failure at that high in the last 4 months.
the previous 2 occasions have led to 600 point declines each.
will this one be different??
I am suggesting not.
Monday;
Watch for wave [b] to hold at this weeks highs.
A break of 1.2190 again will signal wave (i) of [c] is underway.
USDJPY.
USDJPY 1hr.
USDJPY 4hr.

USDJPY daily.
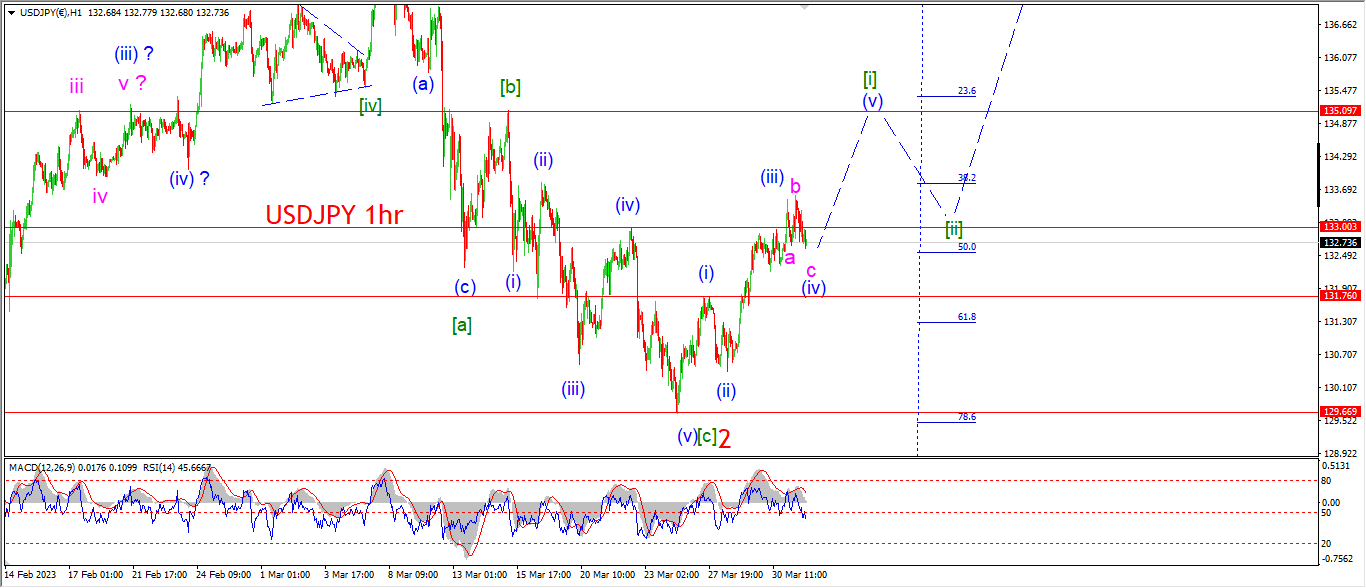
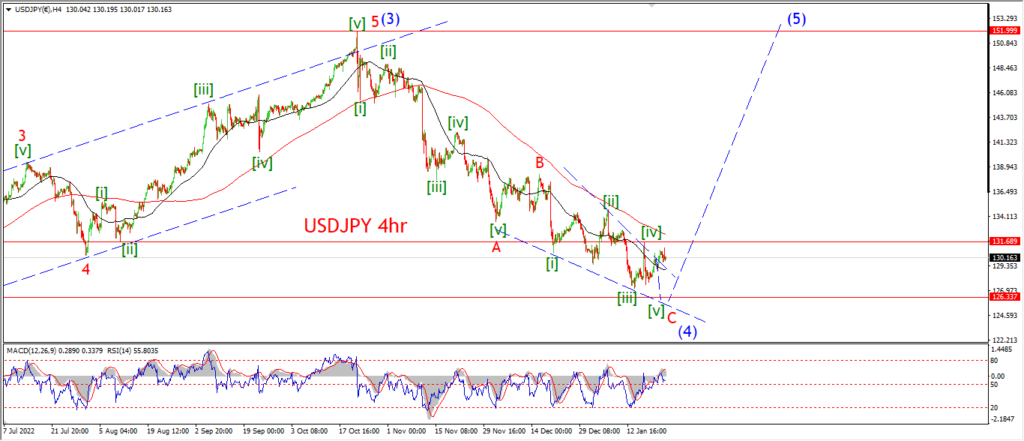
The rally in USDJPY has broken the initial target for a reversal at the previous fourth wave this week.
That wave (iv) high at 133.03 is now the point where wave (iii) and (iv) are correcting around.
this action is viewed as an expanded flat correction in wave (iv).
And if this pattern is correct,
the price should turn higher again into wave (v) again over the coming week.
That will complete five waves up in wave [i] of ‘3’ by the end of next week.
and at that point the bullish pattern will be confirmed.
Monday;
Watch for wave (iv) to hold above the wave (i) high at 131.76.
Wave (v) should push back towards 135.00 next week.
DOW JONES.
DOW 1hr.
DOW 4hr
DOW daily.
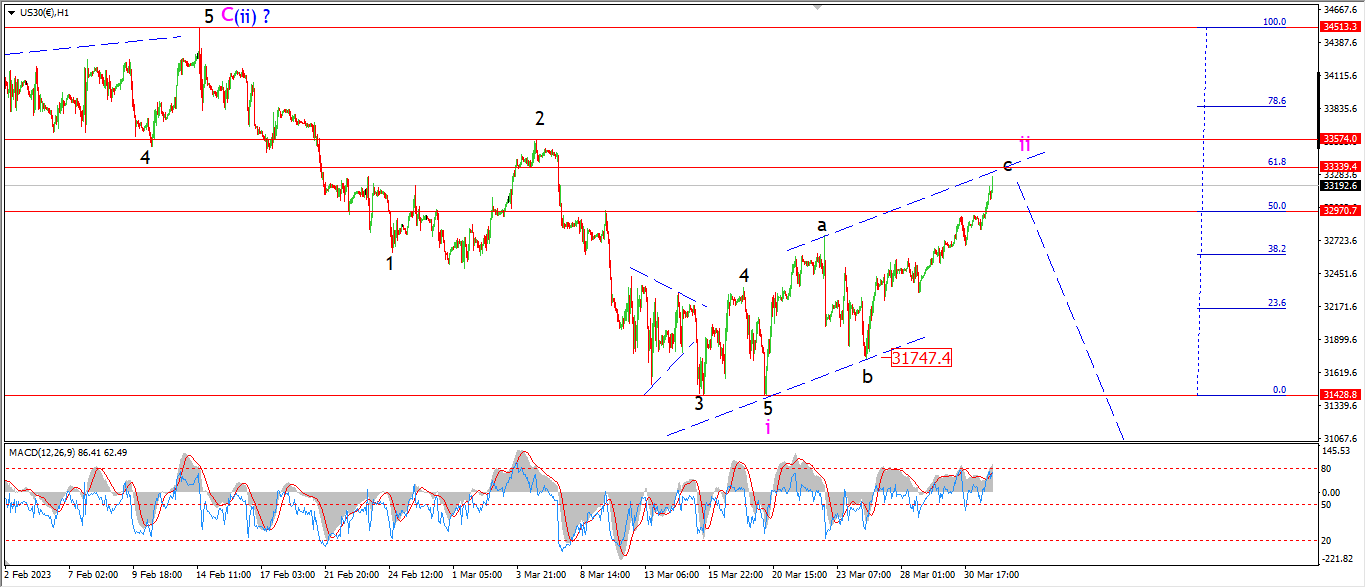
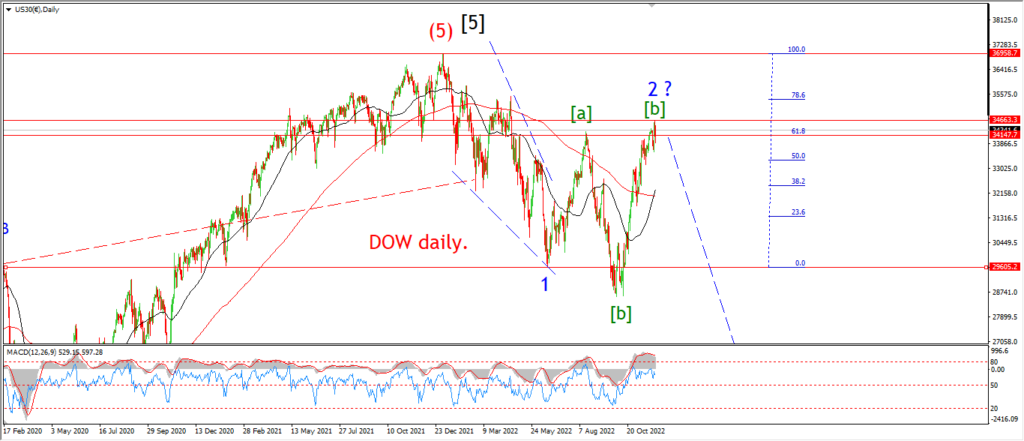
Wave ‘c’ of ‘ii’ has made it back above the 50% retracement level of wave ‘i’ this week.
The three wave corrective pattern is intact so far for wave ‘ii’.
And wave ‘c’ of ‘ii’ hs close to completing a five wave internal pattern also.
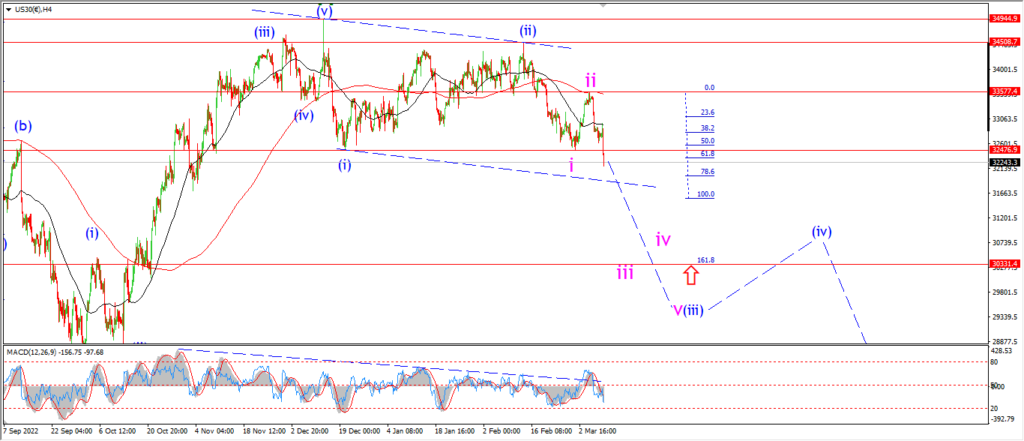
The situation at this lower high is exactly the same as at the mid February highs at wave (ii).
If you recall,
the the main conversation then was how the market was rebounding strongly and that the bear market was over.
How did that work out?
I’m afraid the same outcome is coming here also.
This second wave will fizzle out next week and we should get the initial drop into wave ‘iii’ by the end of the week also.
Monday;
The trend channel in wave ‘ii’ should fill out near that 62% retracement level at 33340.
There is a previous wave ‘2’ high just above that also,
I am looking for this rally to top out in that area.
And we should see a five wave decline into wave ‘i’ by the end of the week.
GOLD
GOLD 1hr.
GOLD 4hr.

GOLD daily.
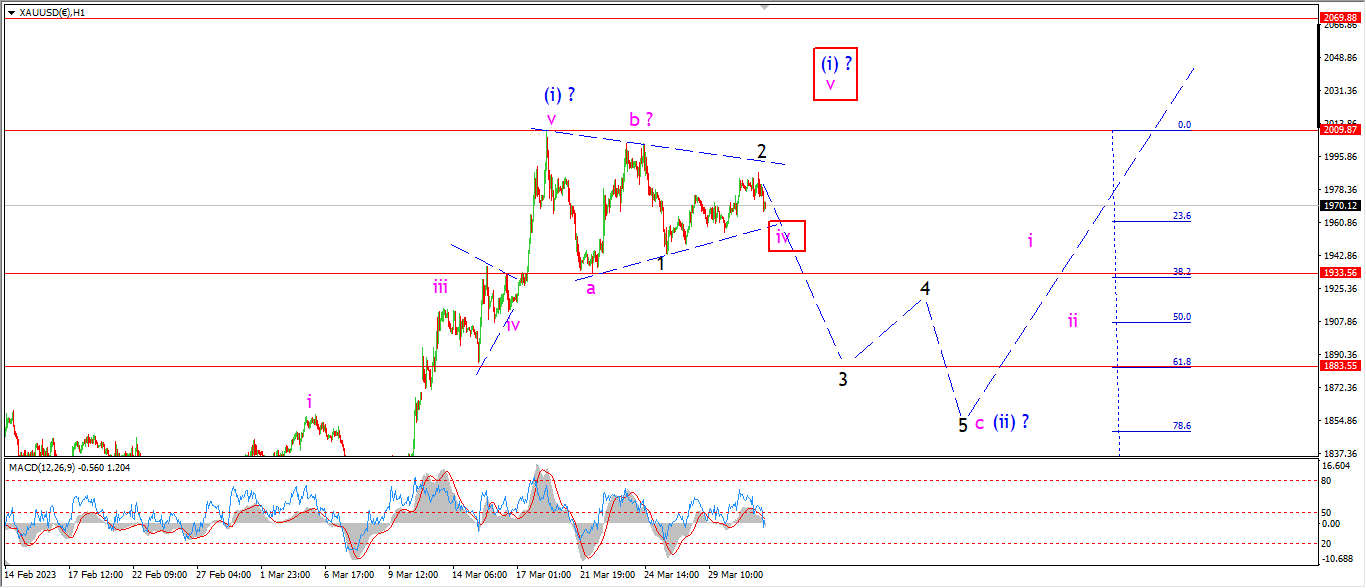
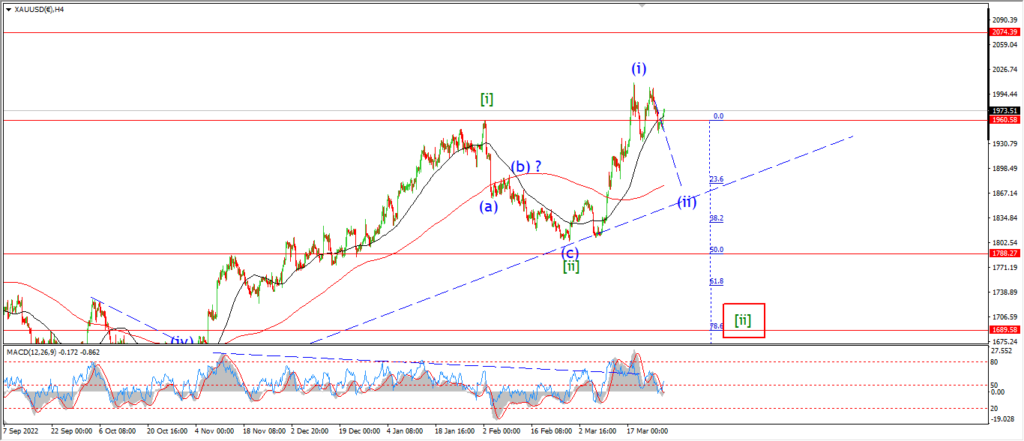
Todays action has not given us much to go on to decide between both counts here.
The main count for wave ‘iii’ down is still valid even today.
And with that small decline off another lower high in the pattern,
that actually fits the picture quite well.
So in this scenario,
I can expect wave ‘3’ of ‘c’ to take over early next week and fall into the 1880 level again.
The alternate count will be invalidated with a drop below 1933 again.
Monday;
Watch for wave ‘3’ of ‘c’ to continue lower in five waves as shown.
1933 is the key level is the short term.
CRUDE OIL.
CRUDE OIL 1hr.
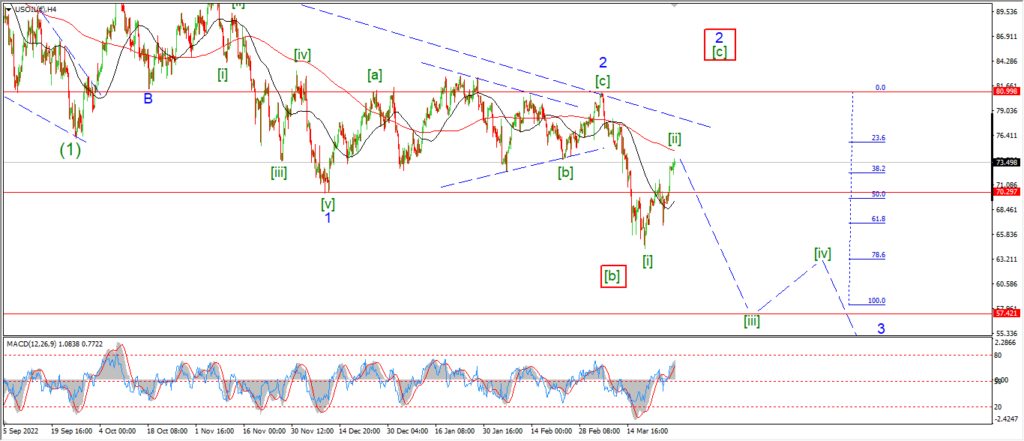
CRUDE OIL 4hr.
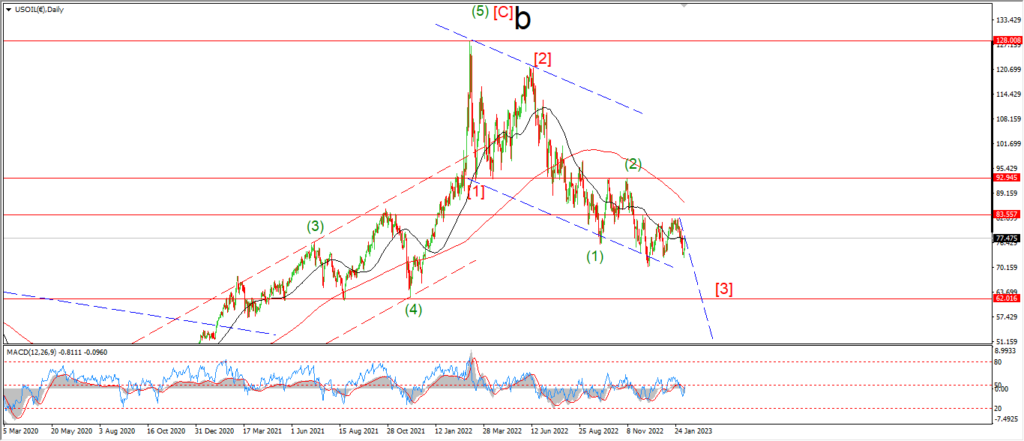
CRUDE OIL daily.
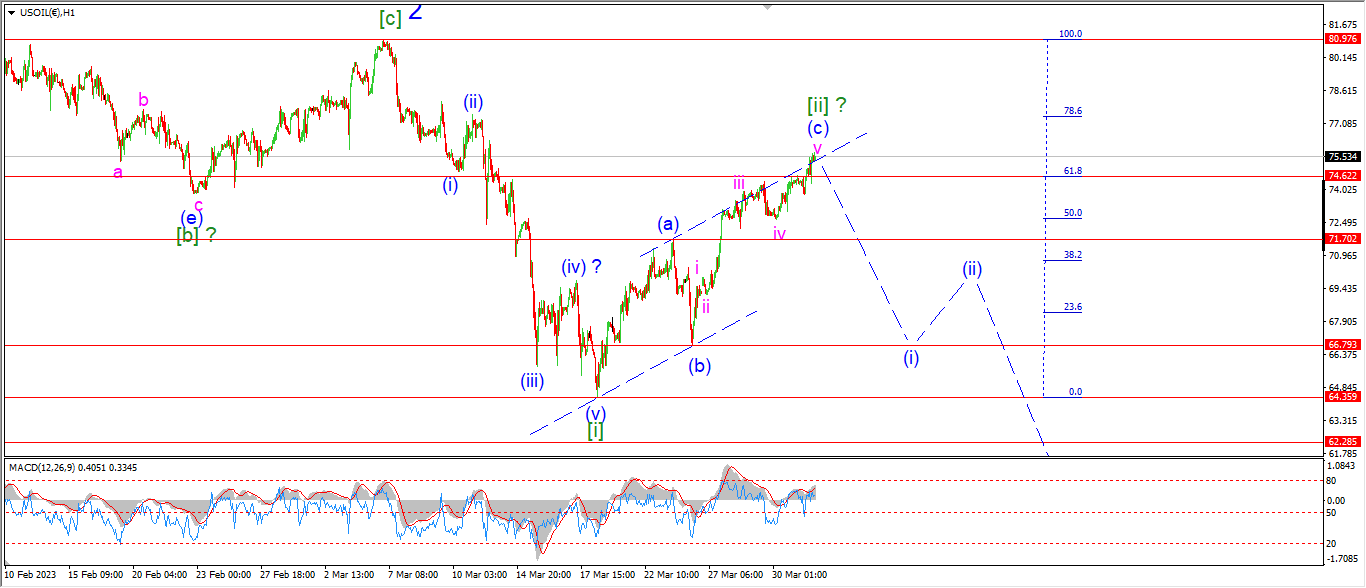
The levitation game is in full force in crude oil this week also.
Wave [ii] is completing now,
and wave [iii] down is going to be painfull for sure!
Wave (i) of [iii] is expected to retrace back to the wave (b) lows at 66.80 again.
And I am just going to have to wait until next week for that to happen.
Monday;
The first level to watch here is at the wave (a) high at 71.70.
A break of that level should signal wave ‘i’ of (i) of [iii] is underway.
S&P 500.
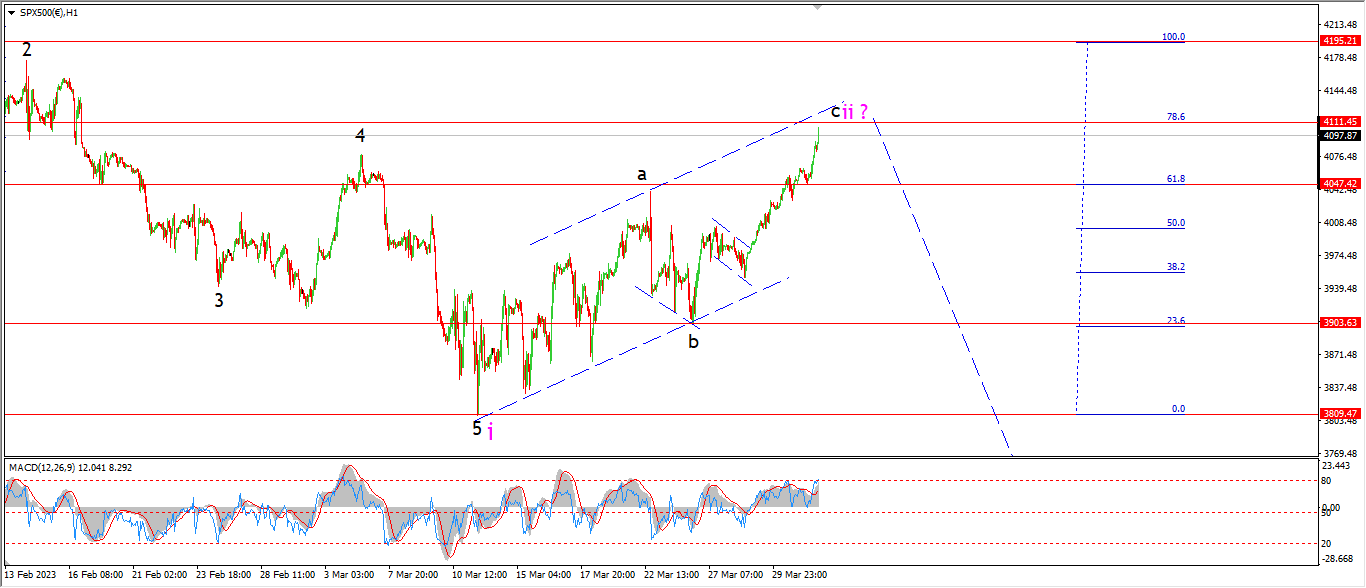
S&P 500 1hr
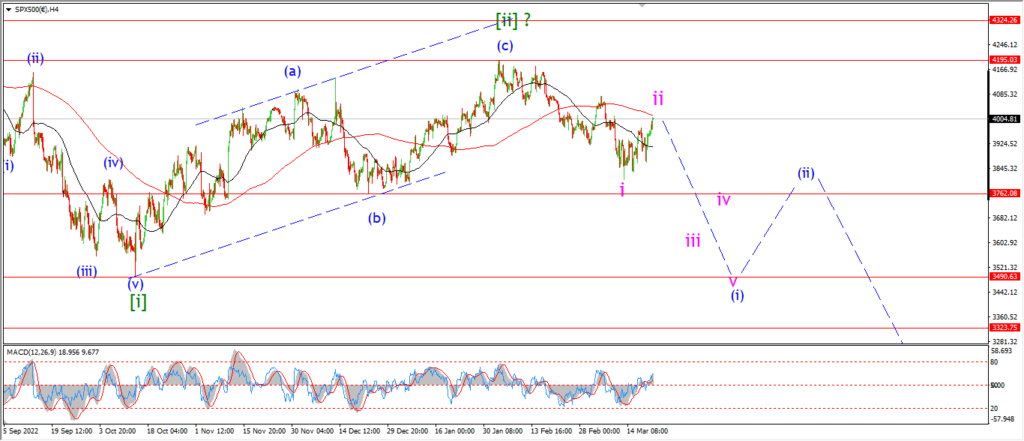
S&P 500 4hr
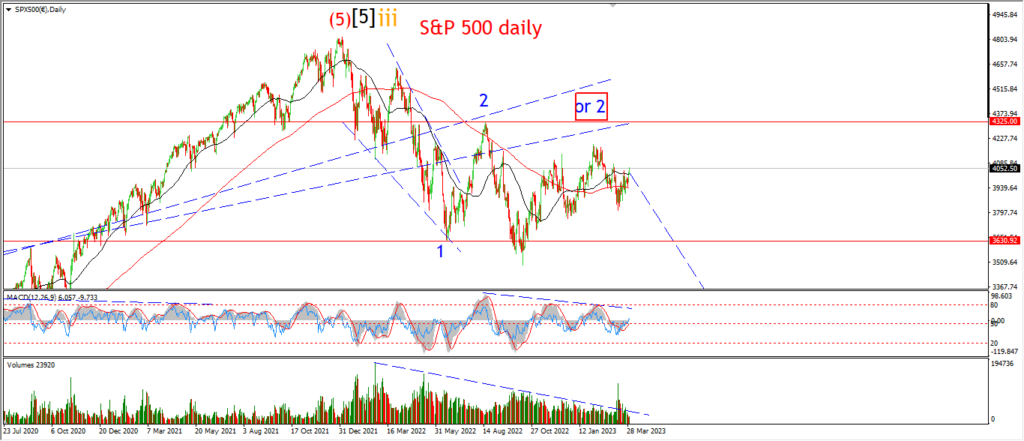
S&P 500 daily.
The first thing I am suggesting tonight is to take a look at the 4hr chart.
We now have a perfect bearish head and shoulders pattern in place around that wave [ii] top formed in early February.
This evenings top is actually mirroring the previous wave (a) top at 4100 from last November.
And this pattern should produce another large leg down as suggested by the Elliott pattern also.
At the high this evening wave ‘ii’ has reached the 78.6% retracement level of wave ‘i’.
More than I expected for sure,
but the previous wave [ii] rally which topped out on Februaruy 2nd reached the very same level before turning down again.
If the H&S pattern holds,
then this rally will not reach much higher than it all ready has.
Monday;
Watch for wave ‘c’ of ‘ii’ to top out early next week.
the high at wave [ii] must hold.
and wave ‘iii’ of (i) should fall back into the 3900 level again.
SILVER.
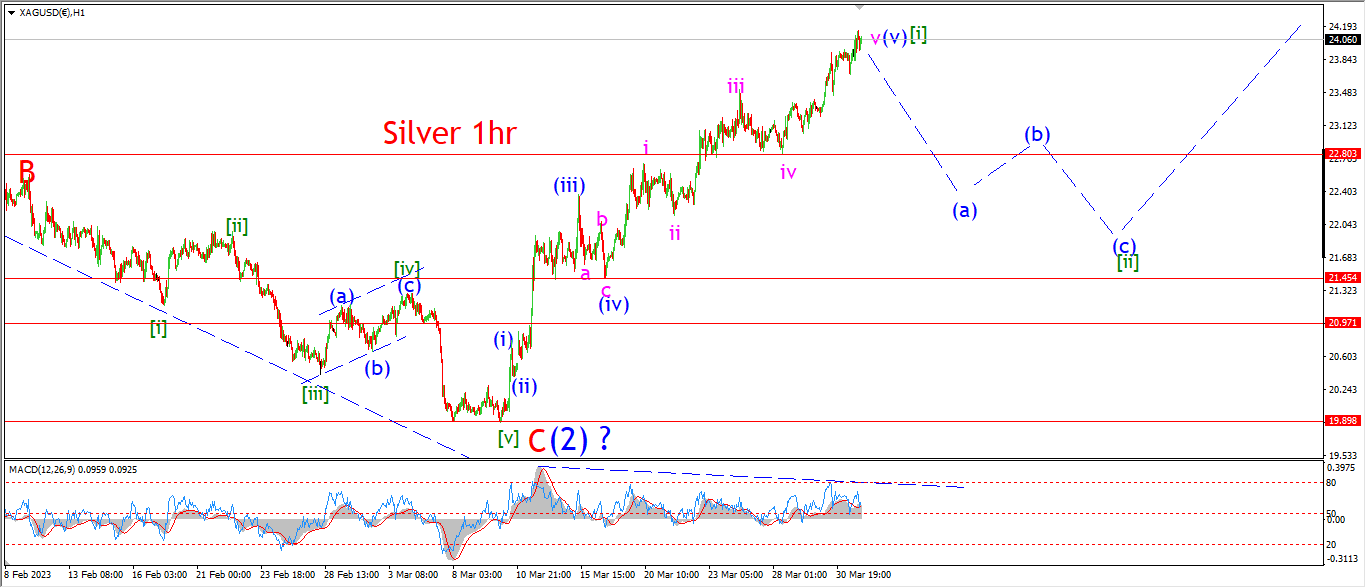
SILVER 1hr
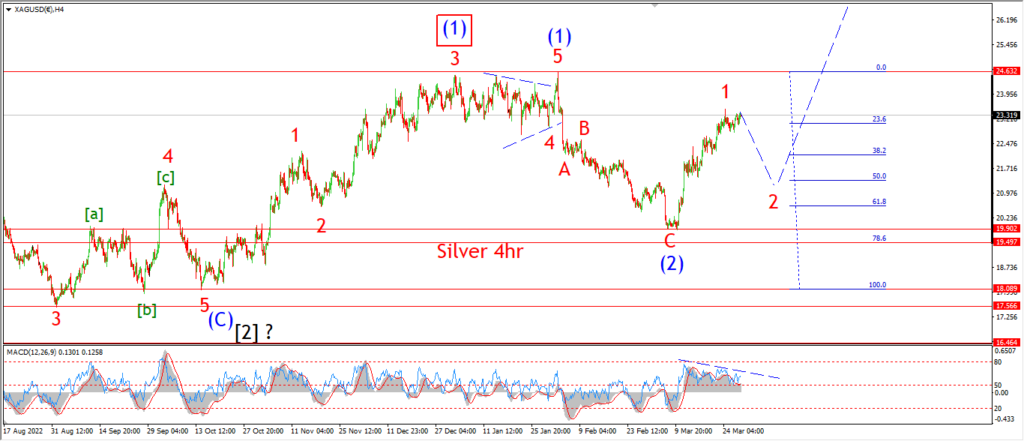
SILVER 4hr.
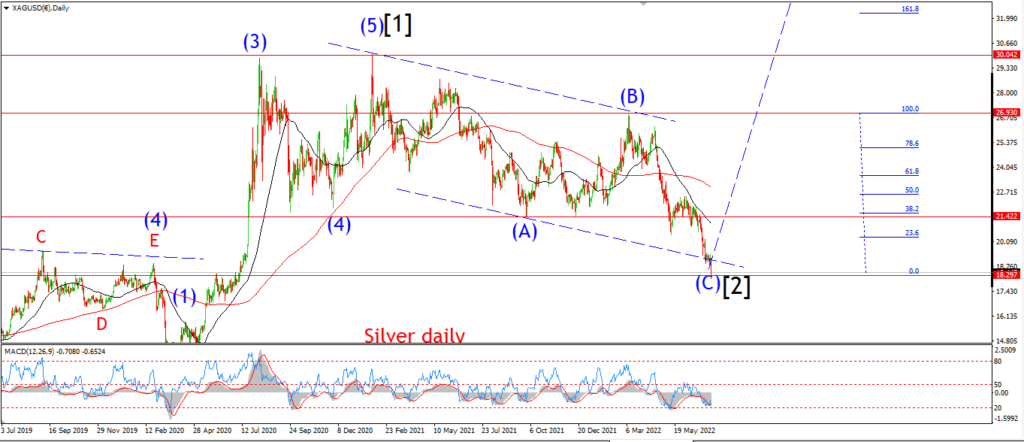
SILVER daily.
The ongoing bearish momentum divergence on the hourly chart shows how over extended this rally is now in wave [i].
I fear the reckoning that silver gets here will hurt many people.
But it will offer a very interesting opportunity at the wave [ii] lows back near that 21.00 level again.
There is not a whole lot to add regarding the wave (v) pattern.
This rally will end soon and the initial wave (a) of [ii] will fall back below 22.50.
Monday;
Watch for wave (a) of [ii] to take over and break 22.80 at a minimum to signal wave [ii] has begun.
BITCOIN
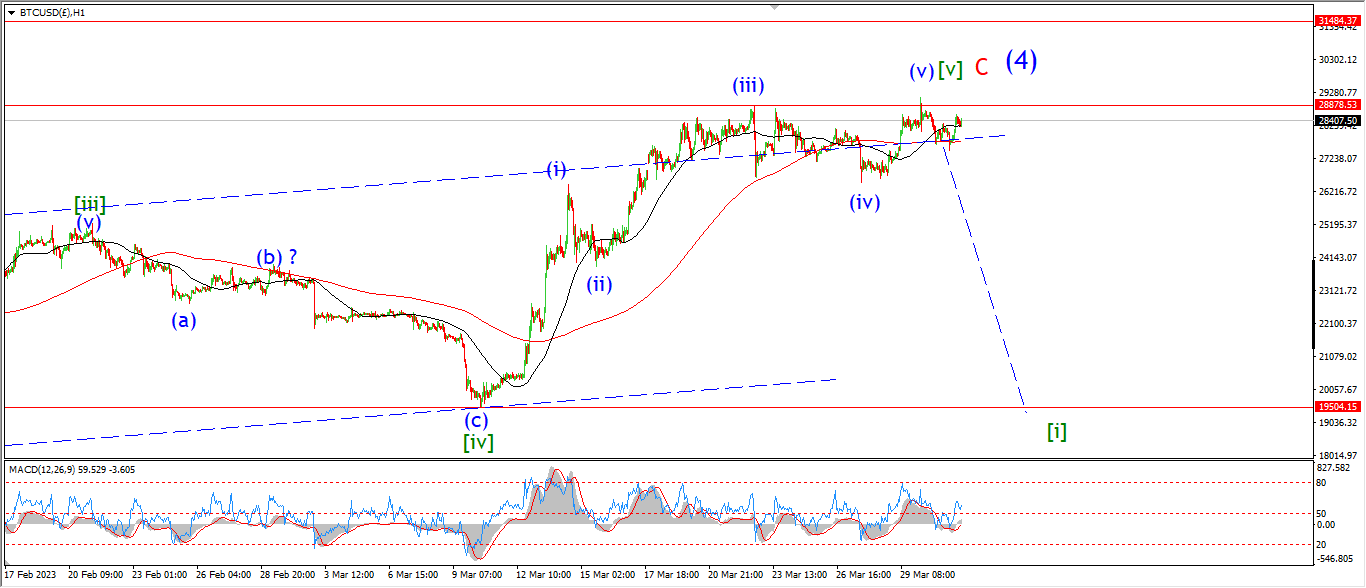
BITCOIN 1hr.

BITCOIN 4hr.
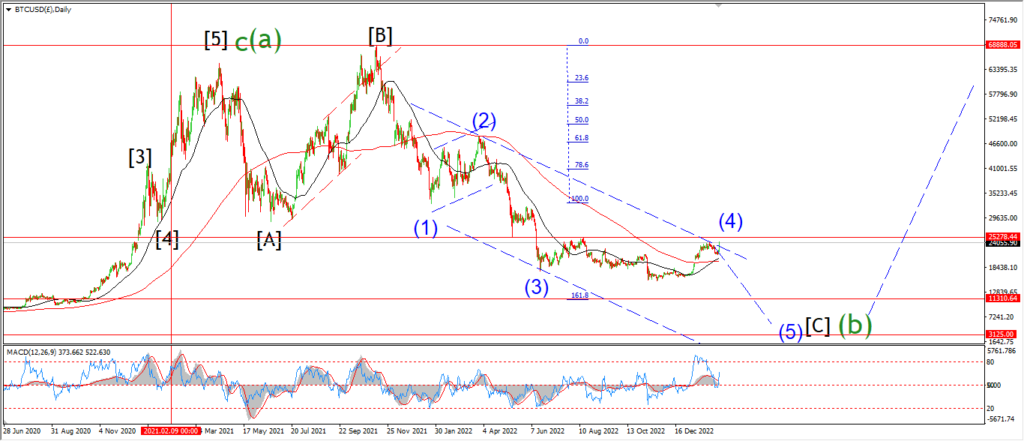
BITCOIN daily.
….
FTSE 100.
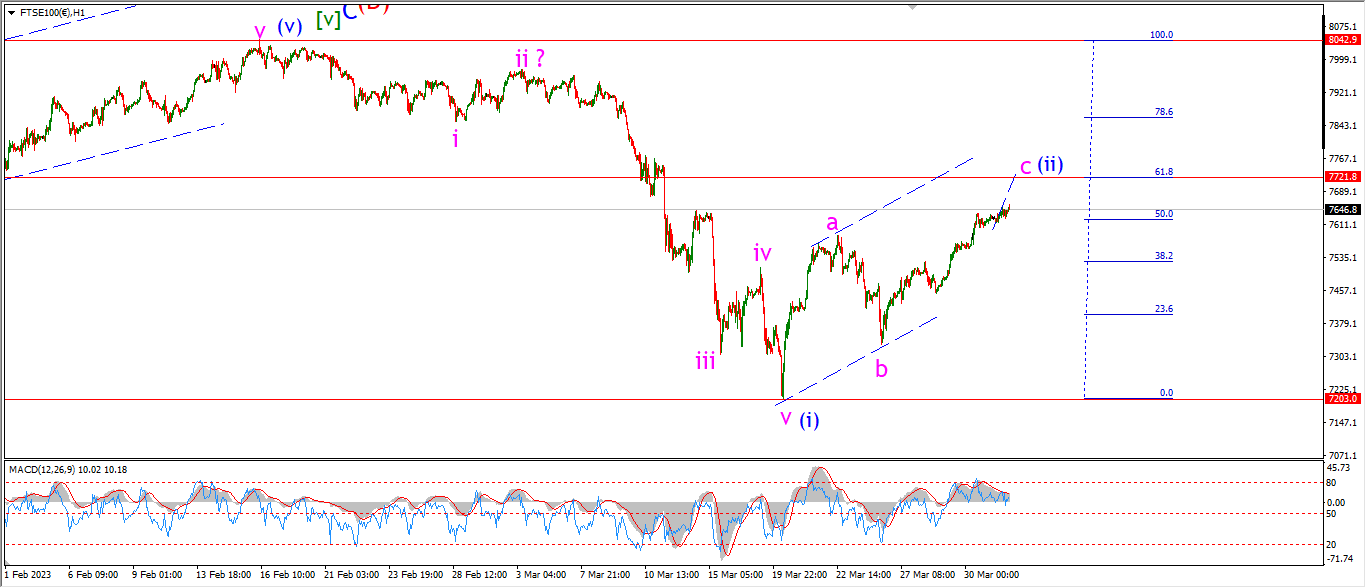
FTSE 100 1hr.
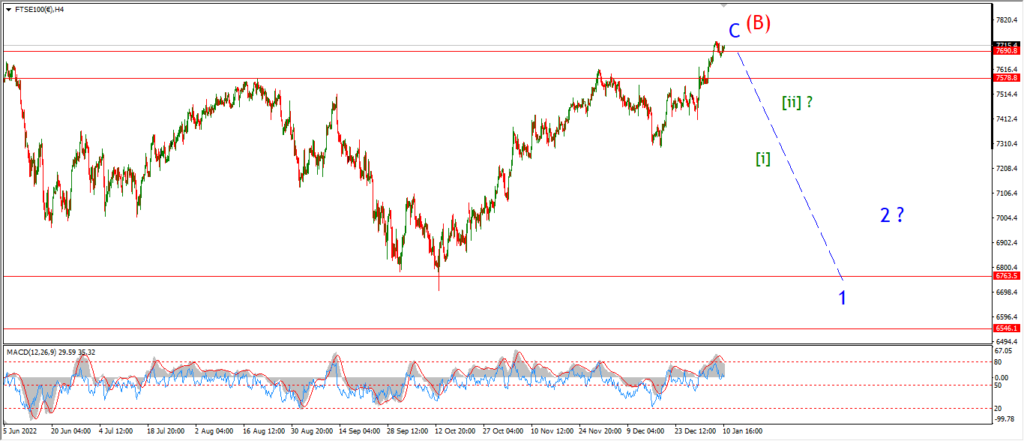
FTSE 100 4hr.

FTSE 100 daily.
….
DAX.
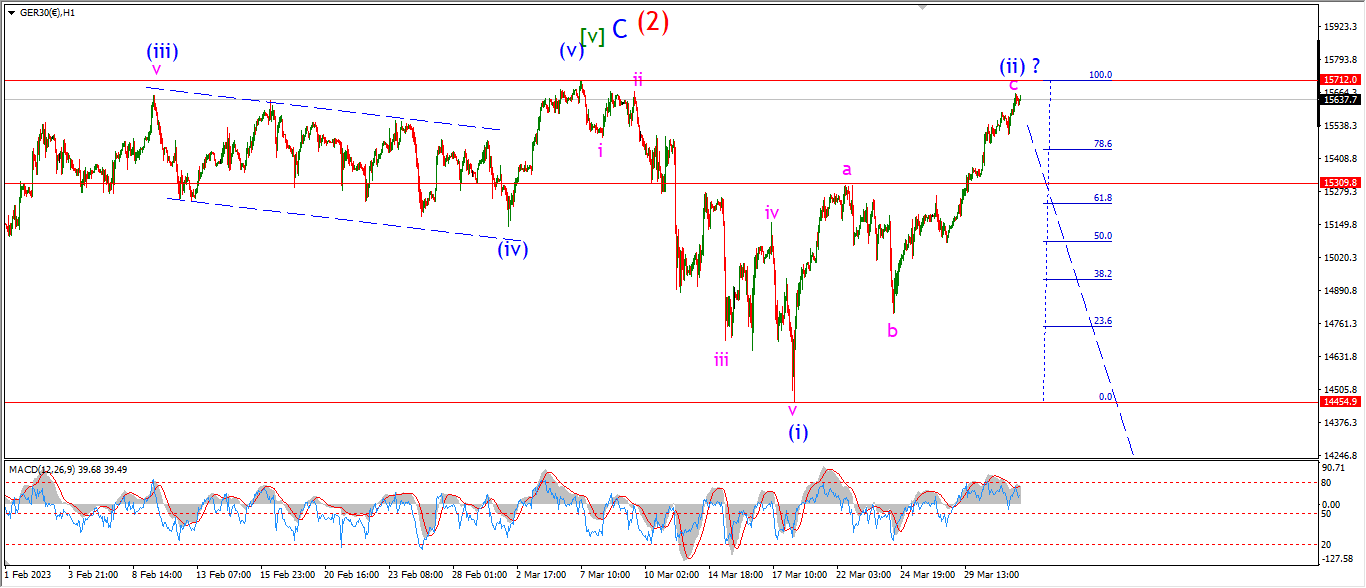
DAX 1hr
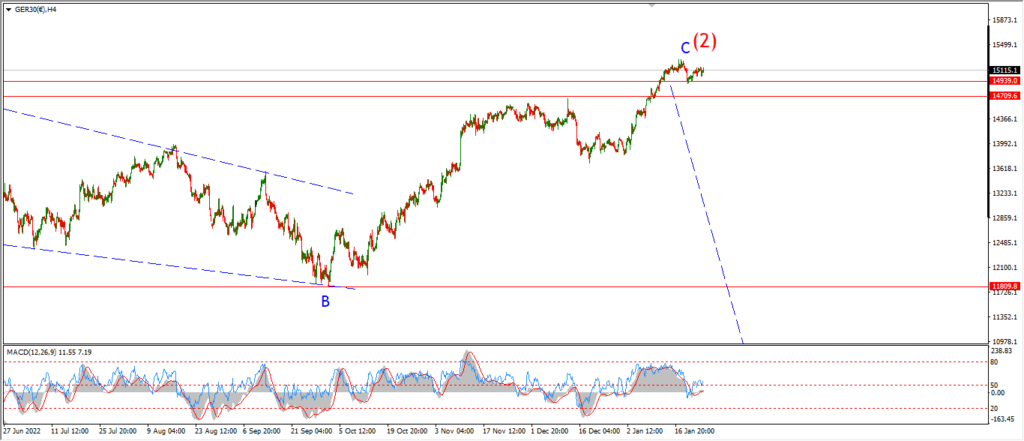
DAX 4hr

DAX daily.
….
NASDAQ 100.
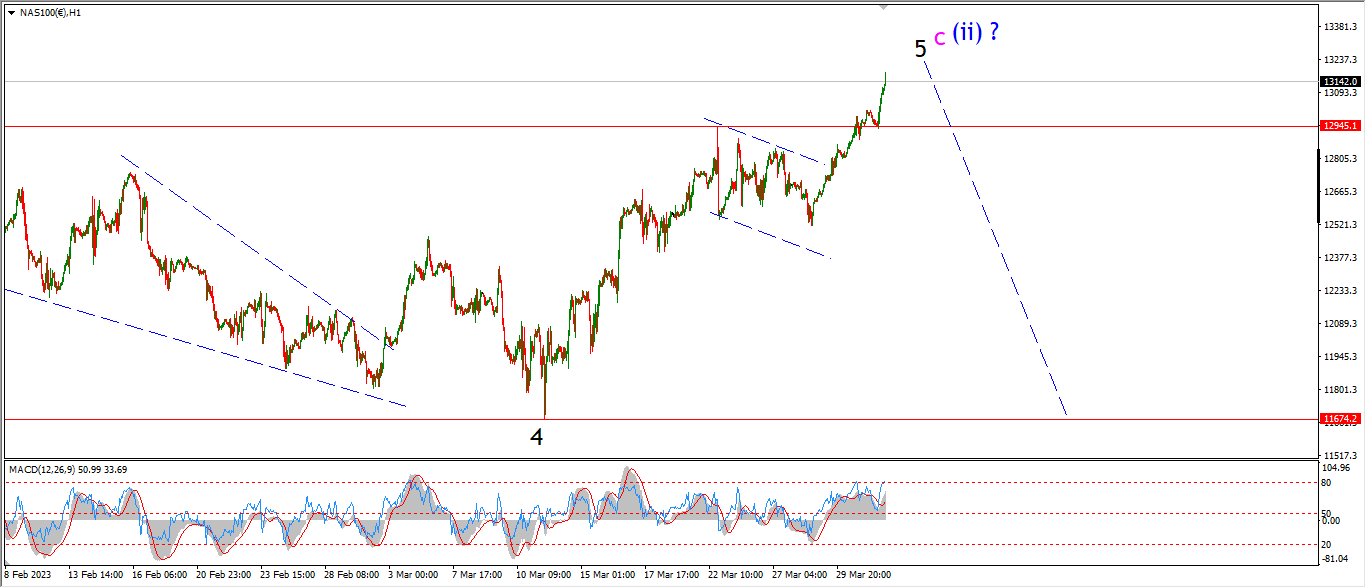
NASDAQ 1hr
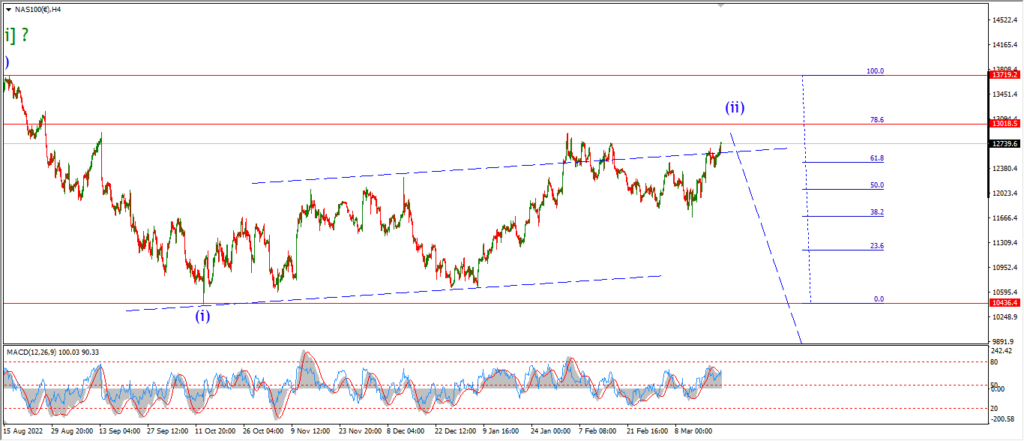
NASDAQ 4hr.

NASDAQ daily.
….