
Good evening to one and all.
The Lord’s Blessing’s to you all again tonight.
https://twitter.com/bullwavesreal
EURUSD.
EURUSD 1hr.
EURUSD 4hr.

EURUSD daily.
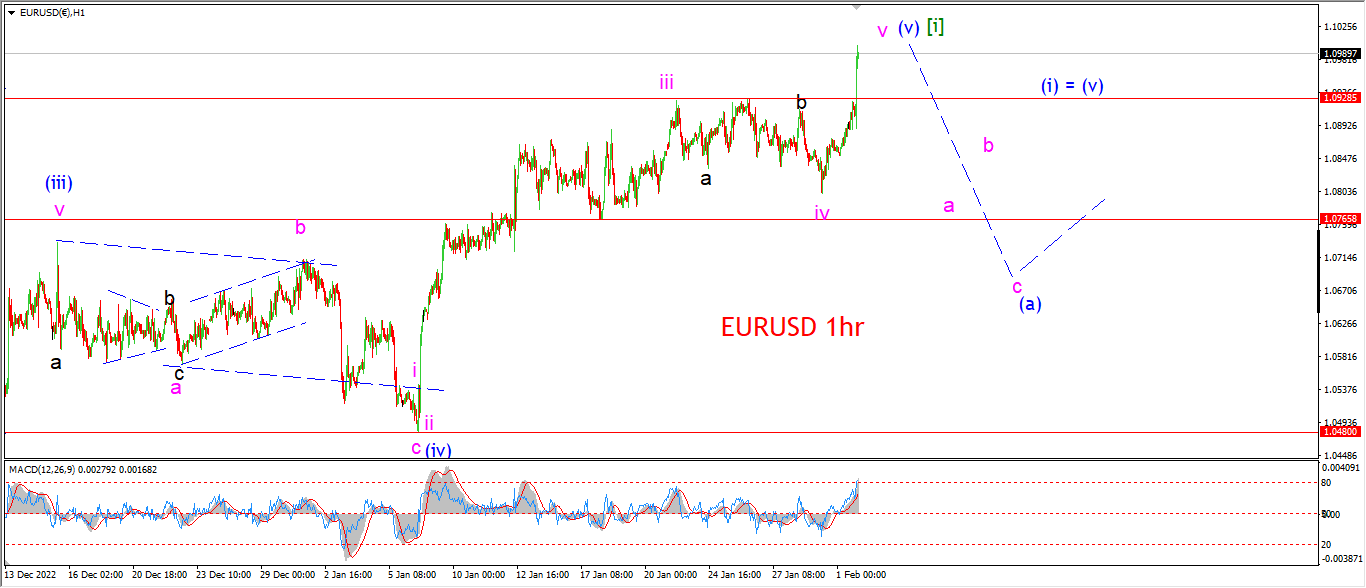
An evening whipsaw has invalidate last nights wave count.
The recent high at 1.0928 broke this eveing and now wave’s ‘iv’ and ‘v’ must shift to show a largercorrective pattern in wave (v).
The main problem I have here with that larger wave ‘iv’ pattern is the relative size to wave ‘ii’ earlier in the pattern.
I dont think this bounce ruins the overall stance here,
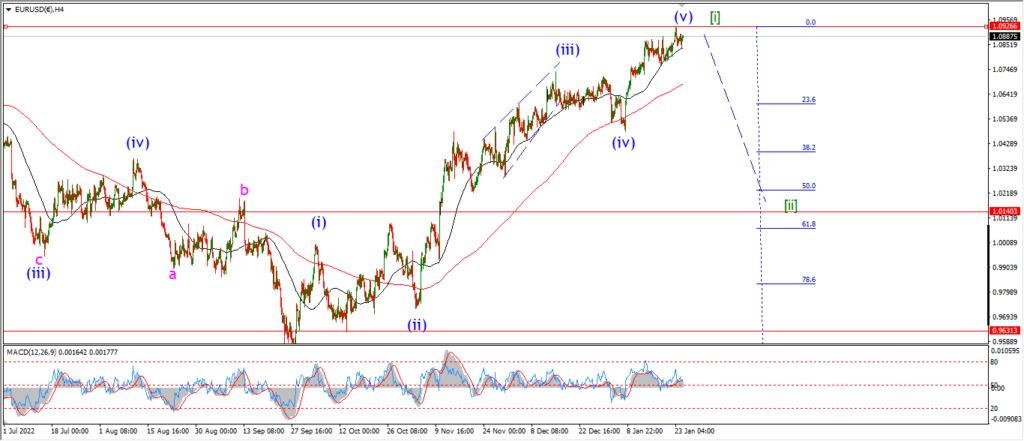
EURUSD is due for a shock drop in wave [ii],
and we are closer to that point now after todays reshuffle.
Tomorrow;
Watch for wave ‘v’ to complete its final high.
the initial support remains at 1.0765.
And when that level breaks that will confirm wave [ii] has begun.
GBPUSD
GBPUSD 1hr.
GBPUSD 4hr.

GBPUSD daily.
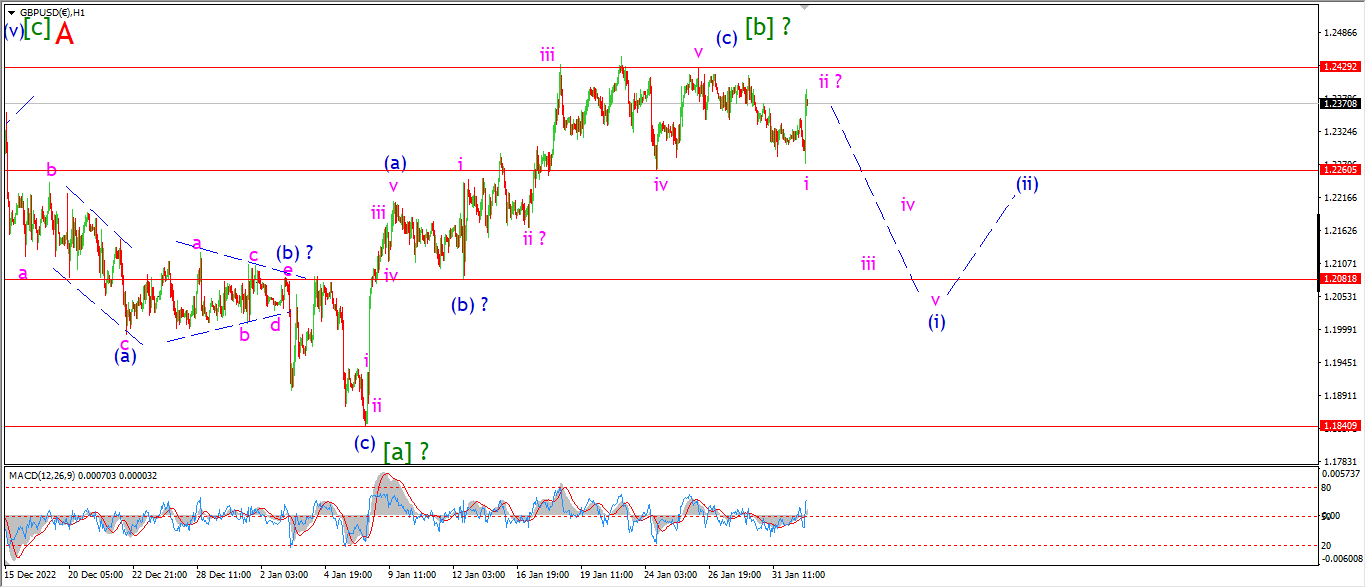
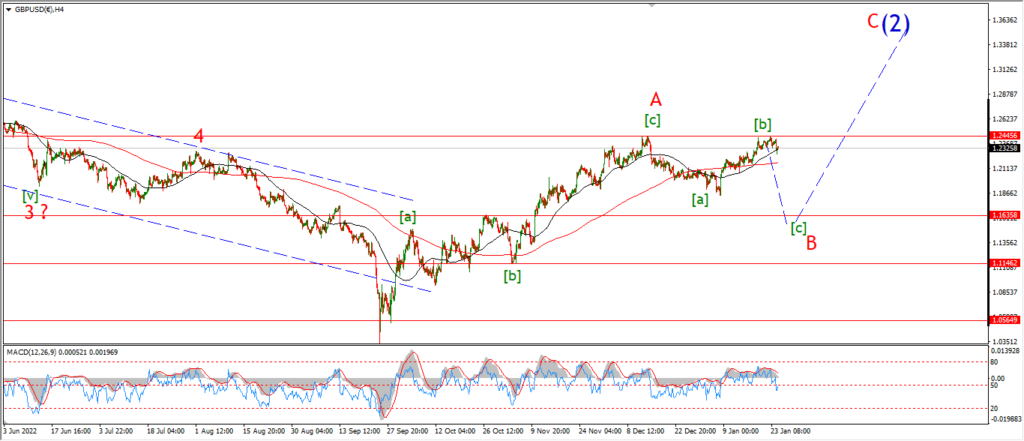
A possible five waves down is now in place in wave ‘i’ of (i) this evening.
The price has not crossed below the wave ‘iv’ low at 1.2260 yet,
but that level does not need to break for this count to be valid.
Wave ‘ii’ should now be in play after the bounce this evening.
The rally has halted below the previous high so far.
and that 1.2260 level should be broken as wave ‘iii’ takes over later in the pattern.
Tomorrow;
Wave ‘ii’ must hold below 1.2429.
Watch for wave ‘iii’ of (i) to begin tomorrow with a break of 1.2260.
USDJPY.
USDJPY 1hr.
USDJPY 4hr.

USDJPY daily.
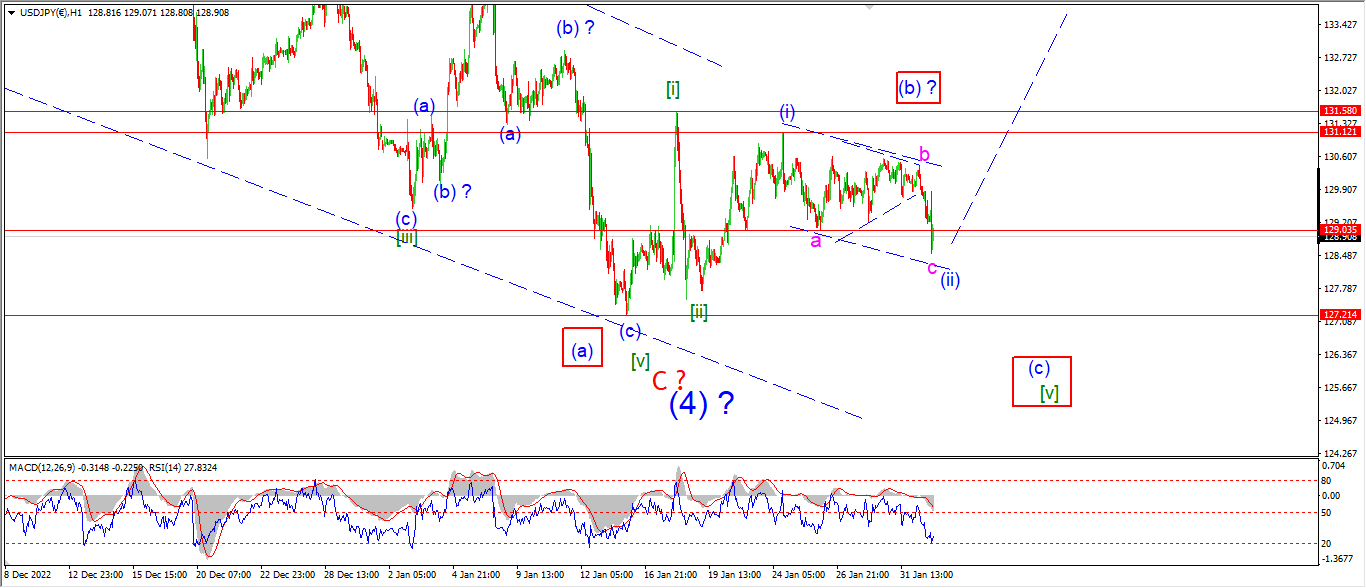
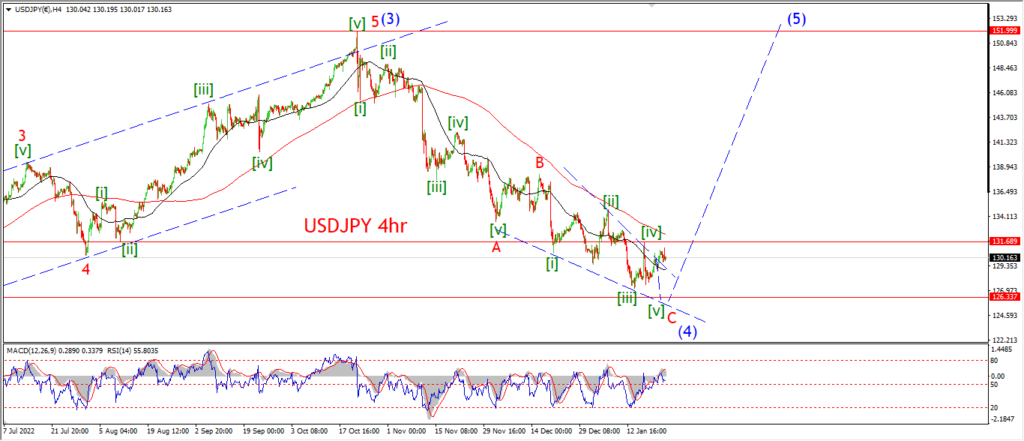
I am looking at a new idea for wave (ii) tonight and I think this idea has promise.
The whole sideways move over the last week can be viewed as wave (ii) blue.
This count involves a triangle wave ‘b’,
and that explains the dead trade over the last few days.
Wave ‘c’ of (ii) should fall again and break 129.00 to complete wave (ii).
And then wave (iii) up can begin to build momentum next week off that corrective higher low.
Tomorrow;
Watch for wave ‘c’ of (ii) to complete this correction below 129.00.
A break above 131.12 will signal wave (iii) has begun.
I have not forgotten about the alternate count for wave [v] green.
For the moment this count is not favored.
A break of 127.21 again will signal this count is correct.
DOW JONES.
DOW 1hr.
DOW 4hr
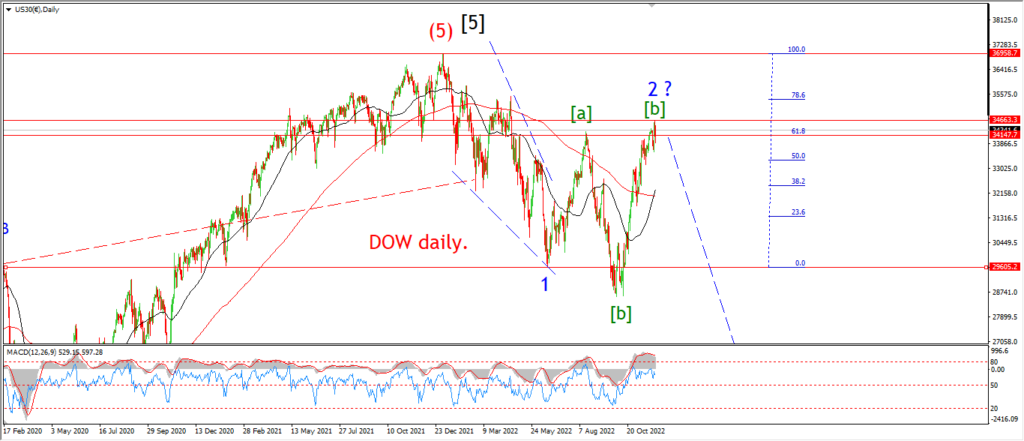
DOW daily.
Well the fed did exactly what the market asked of them today,
and the market spiked higher as a hat tip and thanks to the overlords on the FOMC!
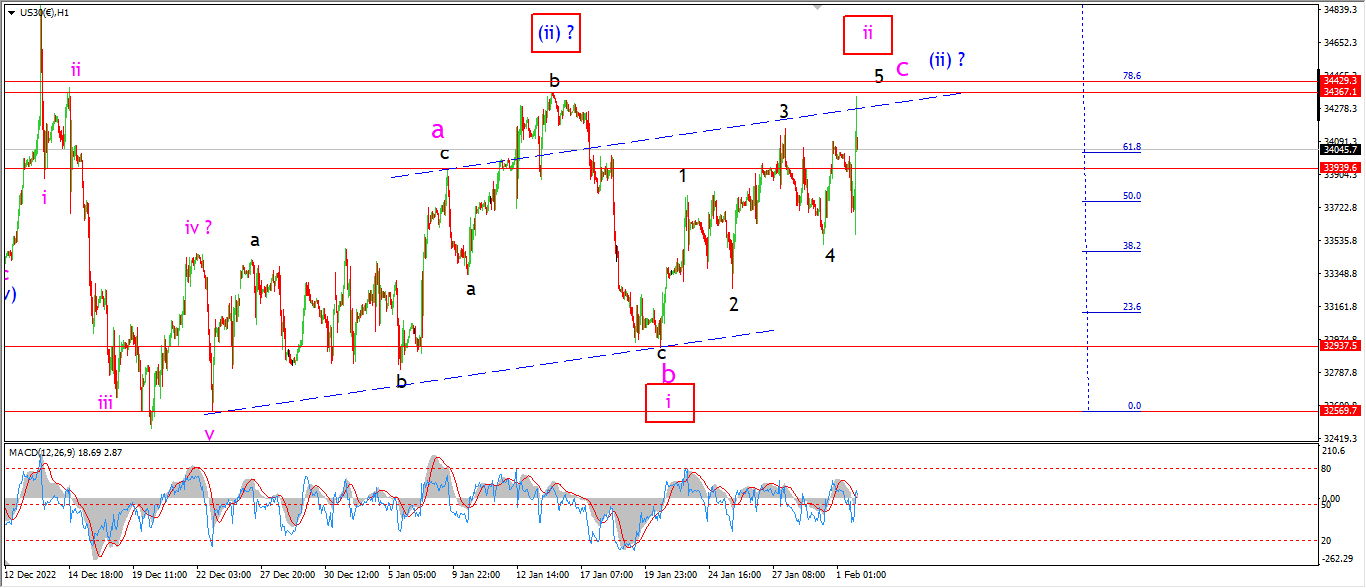
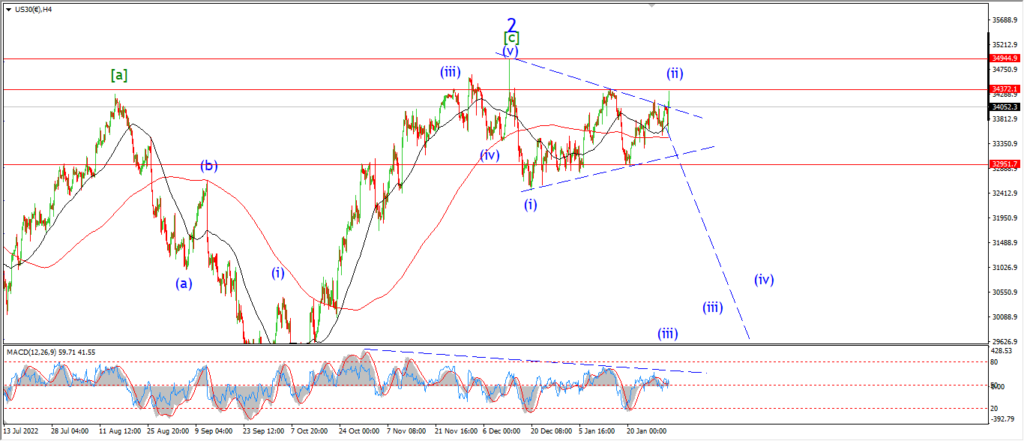
Because of that rip higher this evening I have changed the short term count to show a new possibility for wave (ii).
The rally has not invalidated the previous count yet as we are still holding a lower high below 34360.
But I do think this new count has merit here,
and there are some interesting takeaways from it.
You can see that wave ‘a’ and ‘b’ of (ii) are labelled differently this evening,
with wave ‘b’ labelled as an expanded flat correction.
That expanded flat correction takes care of the recent five wave decline as part of that 3,3,5 wave ‘b’.
This evening you can see that wave ‘c’ is labelled as an ending diagonal pattern.
And that takes care of the repeated overlap in the rally over the last week.
If we plot a trend channel over the wave (ii) correction now,
we can see that wave ‘c’ has broken above the wave ‘a’ top already,
and the channel is full at this evening highs.
The previous rally topped out below the 78.6% retracement level,
and now we have another test of that level this evening.
If we fail again at the 78.6% retracement of wave (i),
then we can start looking for wave ‘i’ of (iii) again tomorrow.
Tomorrow;
the knee jerk reaction should dissipate pretty soon,
and if we see a reversal in prices tomorrow that wipes out todays gains,
that should be the end to that wave (ii) corrective rally.
Its been a frustrating few weeks in wave (ii).
but as with everything else on this planet, this too shall pass.
The real shock will be how quickly wave (iii) can wipe out the rally of late!
GOLD
GOLD 1hr.
GOLD 4hr.

GOLD daily.
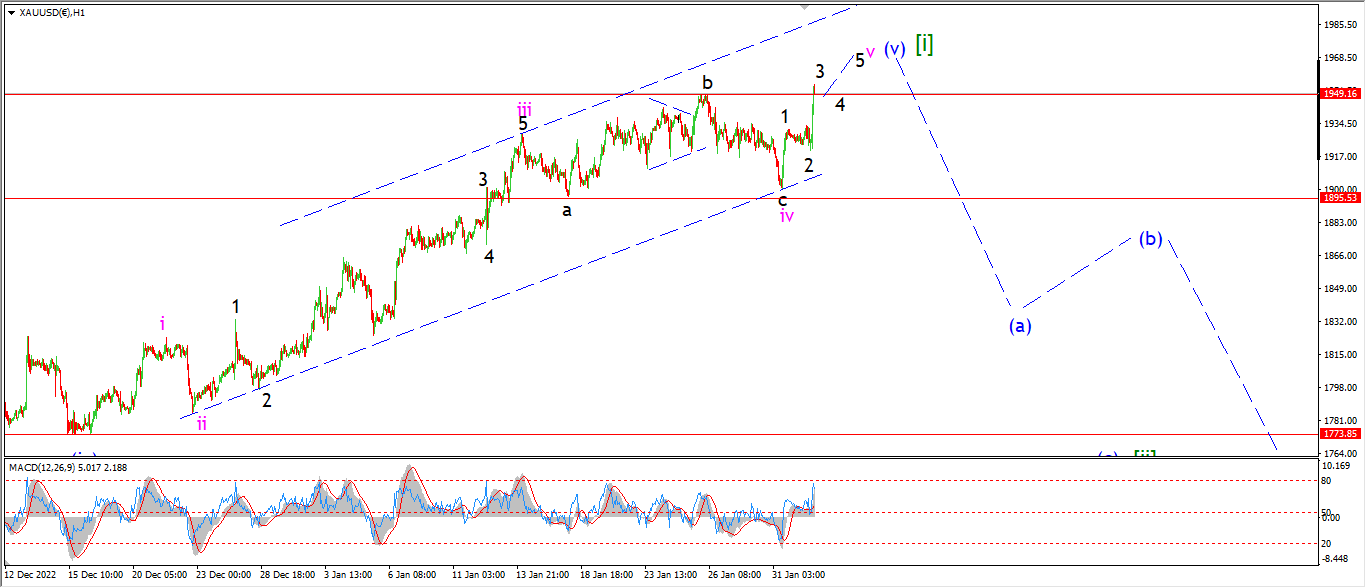
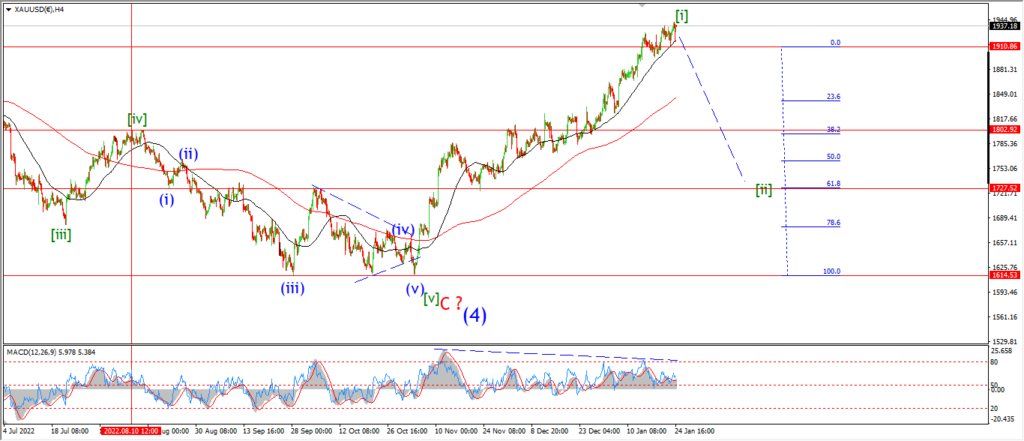
As with most of the markets this evening, gold has managed to put in a new high also.
this has invalidated the ending diagonal pattern for wave (v) blue.
and after tonight’s rally we can revert to a simple five wave pattern in wave (v) of [i].
The action over the last two weeks has been frustrating for sure,
but I do think that the pattern is revealing itself now.
The overall stance has not changed for wave [i],
but the internal pattern in wave (v) is allowing for one last new high to complete the overall pattern.
Tomorrow;
We have a three wave rise in place now for wave ‘v’ of (v) of [i].
When wave ‘v’ completes a five wave internal pattern that will signal the top is in place.
1895 is still the signal level to indicate wave (a) has begun.
CRUDE OIL.
CRUDE OIL 1hr.
CRUDE OIL 4hr.
CRUDE OIL daily.
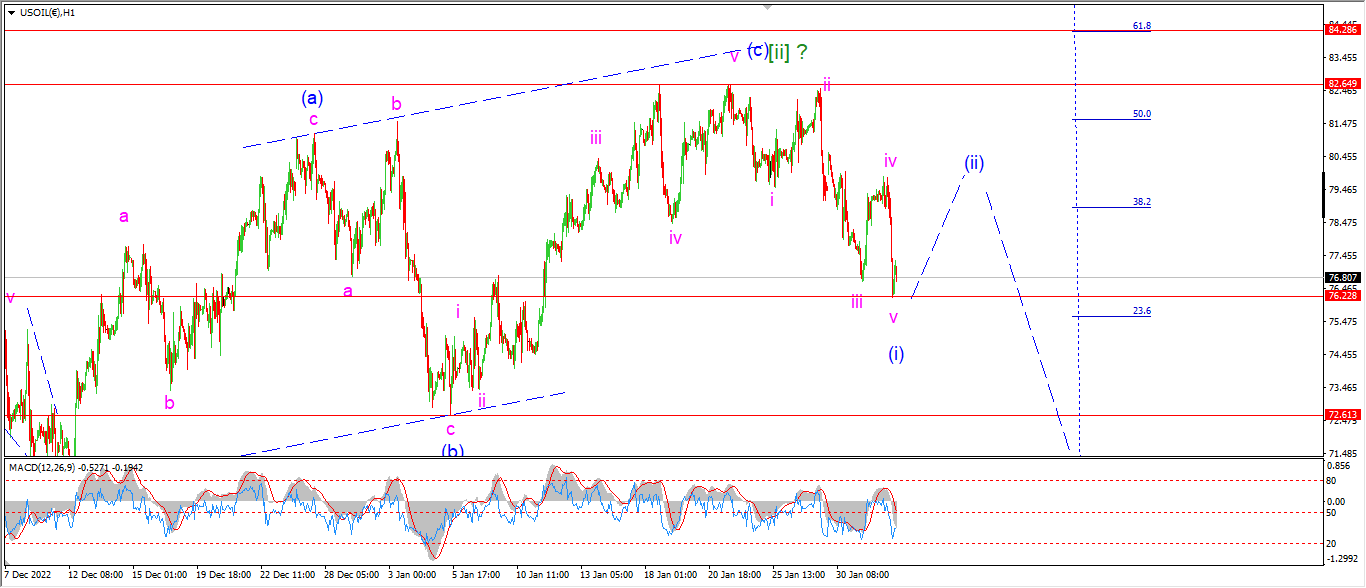
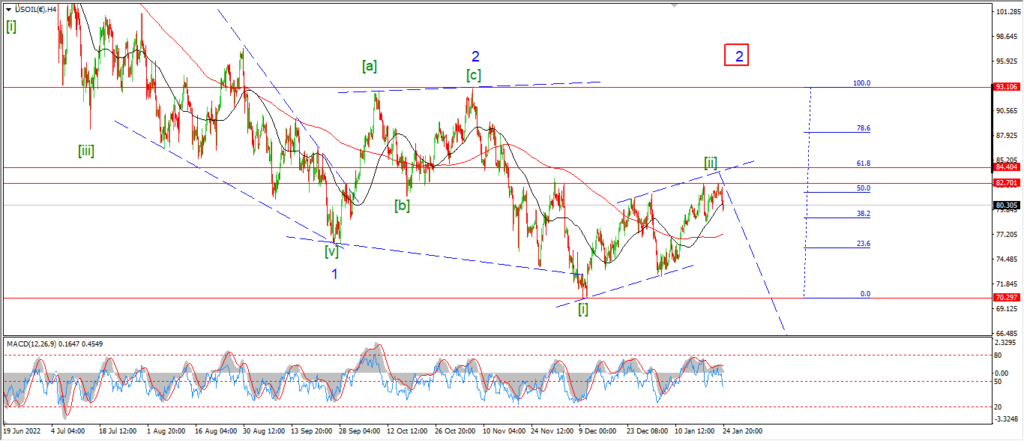
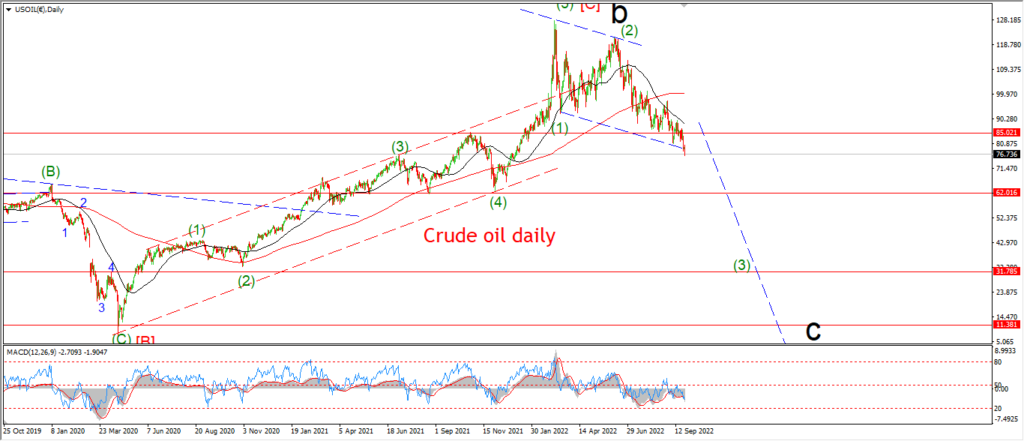
Crude took a solid hit today with prices down 3.50 off yesterdays highs at wave ‘iv’.
this decline is viewed as wave ‘v’ of (i) so I expect there will be a low forming here over the next day or so.
And when that low is in for wave (i),
then wave (ii) should correct back towards the previous wave ‘ii’ high at about 80.00 again.
Tomorrow;
The decline in wave (i) of [iii] is not as large as I hoped for,
but we have a possible five wave decline in place now so I will work with it for now.
Watch for wave (i) down to complete as suggested.
If the price holds above the lows of wave (i) tomorrow that will signal wave (ii) has already begun.
S&P 500.
S&P 500 1hr
S&P 500 4hr
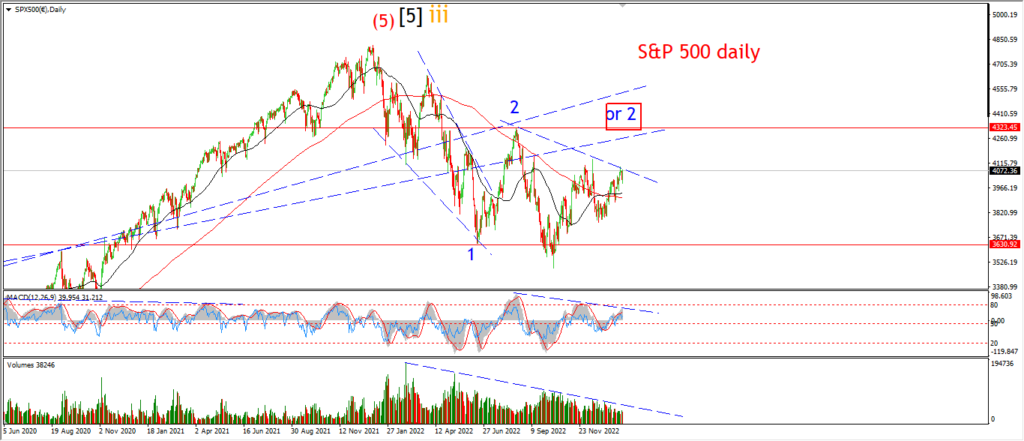
S&P 500 daily.
I am most disappointed by the action in the S&P today but lets go through the charts and see what is the next best pattern here for this rally.
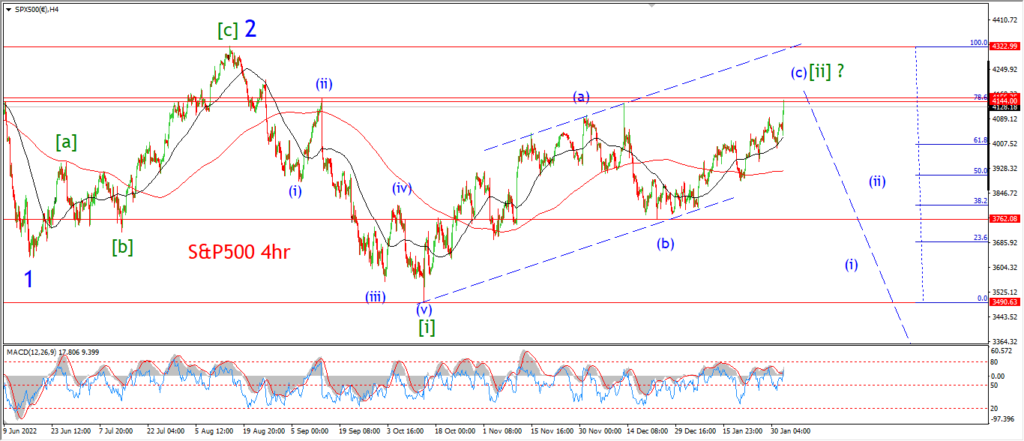
Lets start on the 4hr chart;
The market broke to a new high today and that suggests that wave [ii] is still in force here.
The rally off the wave [i] low is still viewed as a three wave pattern.
the general grind higher is classic of a corrective rally.
The internal pattern for wave [ii] is labelled as a complex flat correction.
With wave (c) of [ii] completing an ending diagonal.
Wave [c] has already broken the wave (a) high after todays rally.
and that rally has failed below the 78.6% retracement of wave [i] again.
there are some positive points to take from todays bloody mess!
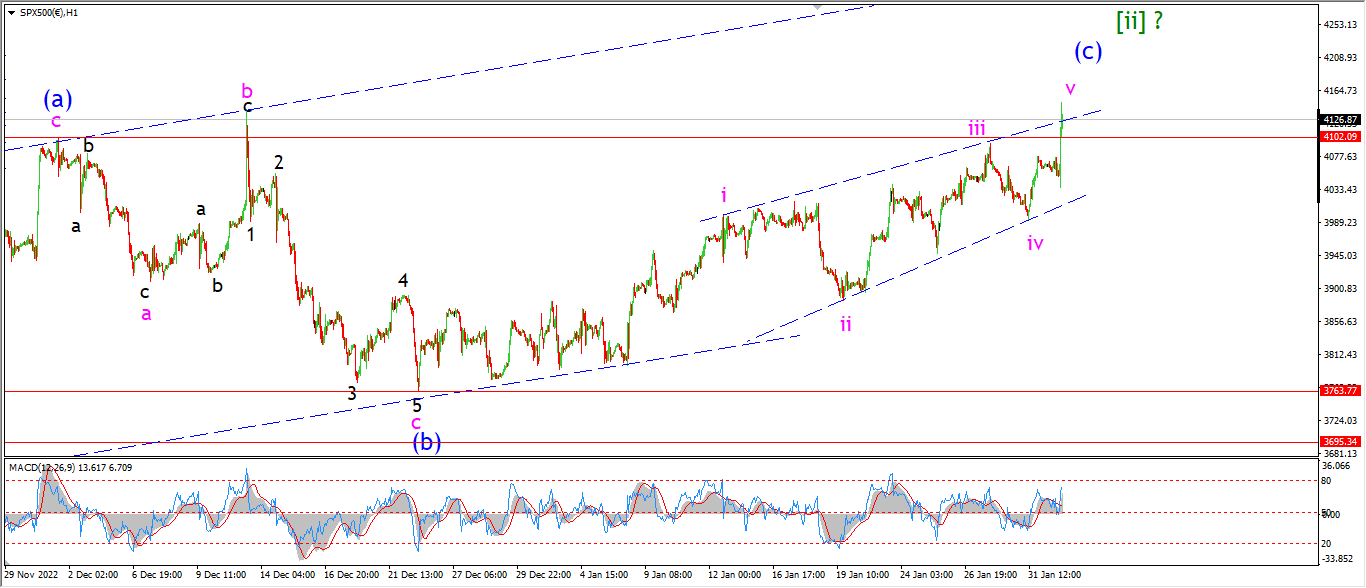
The 1 hr chart;
You can see both wave (b) and (c) clearly here.
Wave (b) has a solid 3,3,5 internal pattern suggesting an expanded flat correction.
And off that wave (b) low we can track an ending diagonal rally in wave (c).
The high of wave (c) broke above the wave (a) top at 4100 today.
and the wedge is close to complete the ending diagonal pattern.
Tomorrow;
I have been patiently waiting for a third wave decline to overtake this market and shake things up.
so far that idea has been thwarted by this juvenile delinquent that we call a market.
I will have to revert to my previous stance here again.
That is watch for the initial five wave decline to signal a turning process is beginning again.
So now I must go and eat a large slice of humble pie.
SILVER.
SILVER 1hr
SILVER 4hr.
SILVER daily.
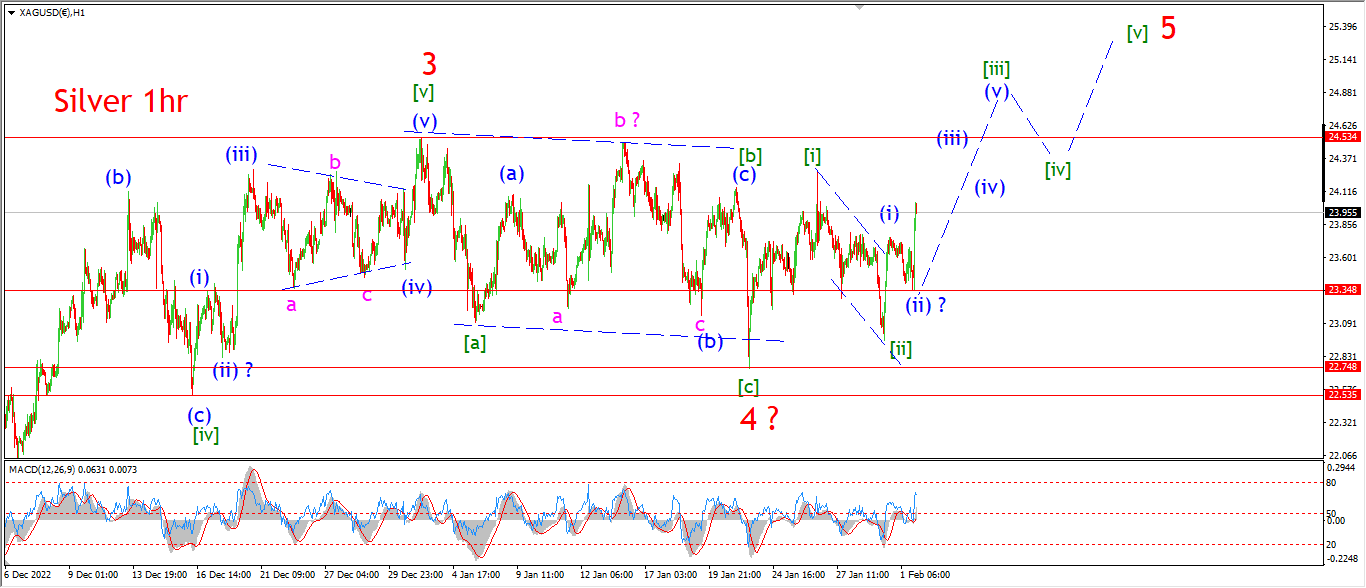
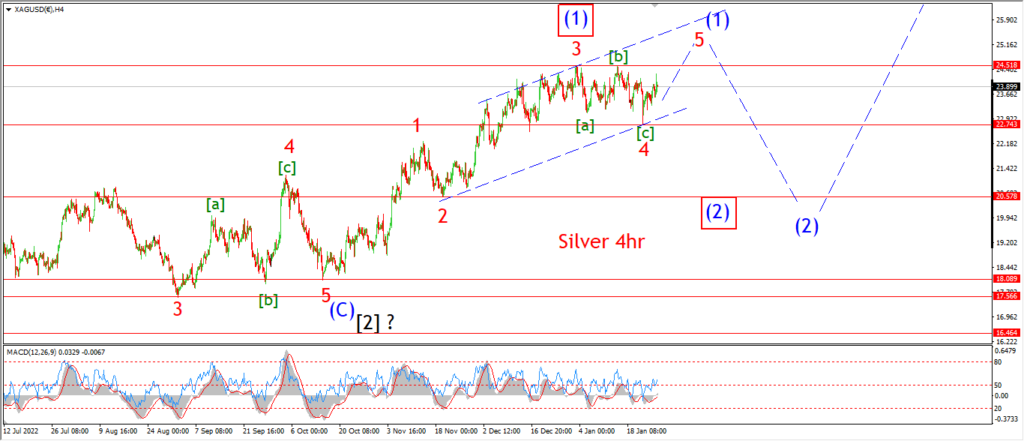
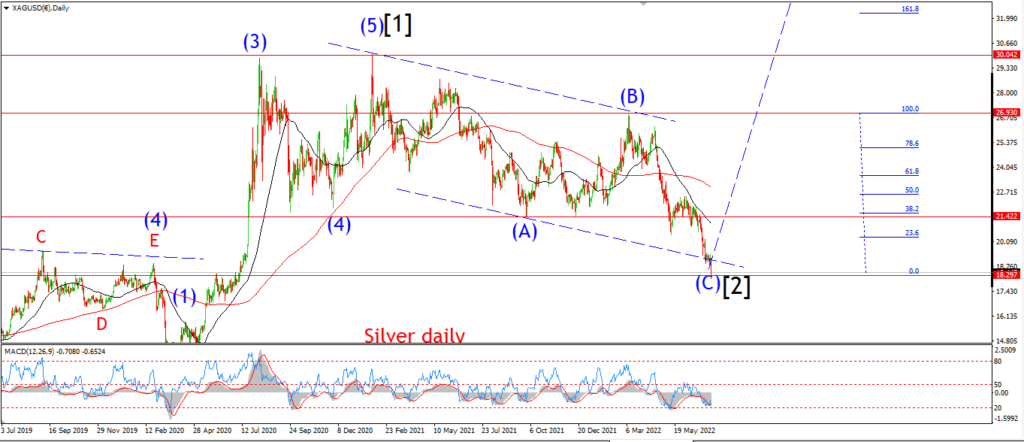
A spike rally in silver today suggests wave (iii) of [v] is now underway.
the rally off wave [ii] has only traced out three waves up so far so there is further proof needed to confirm this pattern,
but so far so good for the new count.
This market is so crazy these days that I just cannot trust any single move as a confirmation of my thesis,
so I am almost prepared for this new count to be invalidated with some type of rapid reversal again.
So I remain cautious here.
Tomorrow;
Watch for wave (iii) to continue higher towards that 24.50 high to confirm the short term count.
A break of 23.30 again will invalidate this new count.
BITCOIN
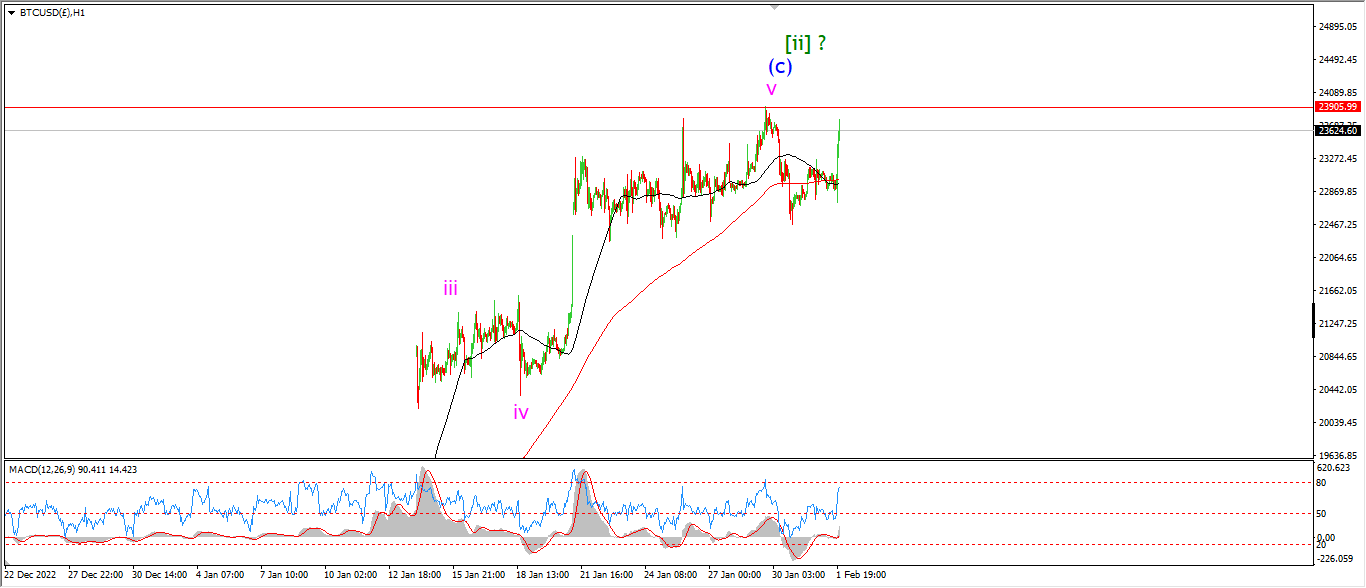
BITCOIN 1hr.
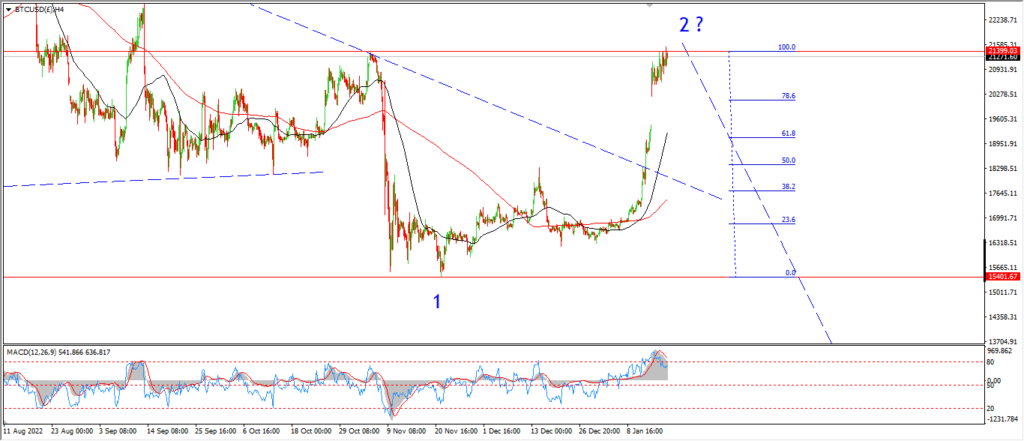
BITCOIN 4hr.

BITCOIN daily.
….
FTSE 100.
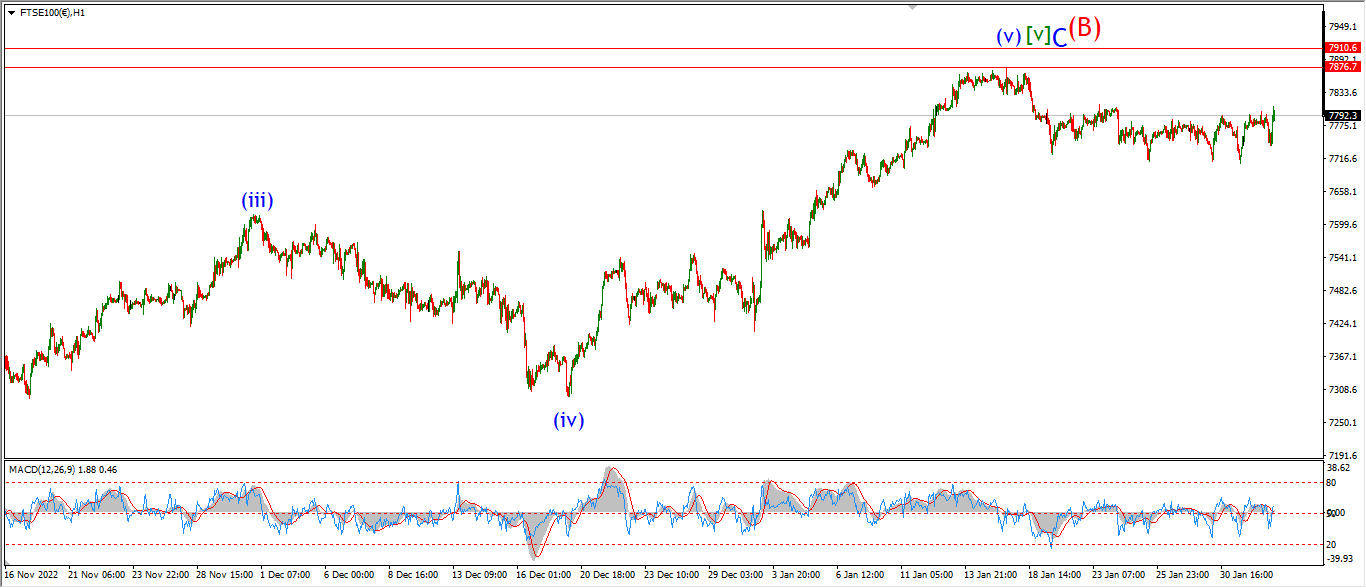
FTSE 100 1hr.
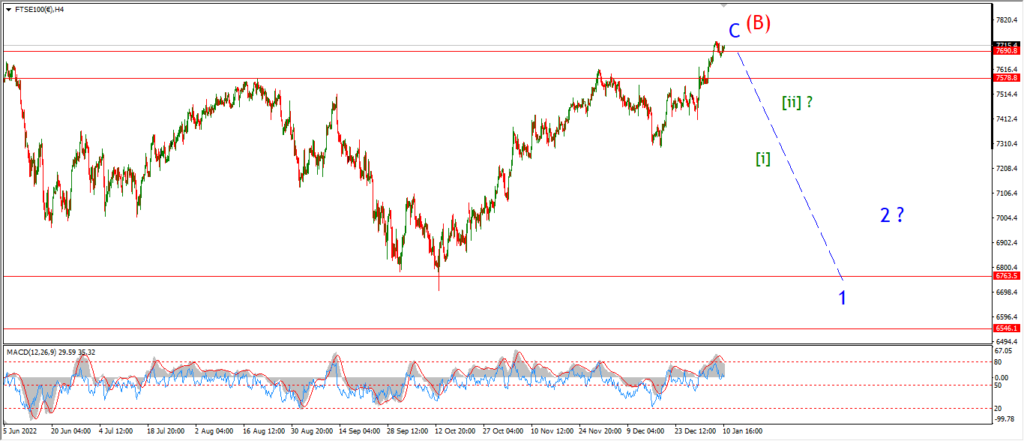
FTSE 100 4hr.

FTSE 100 daily.
….
DAX.
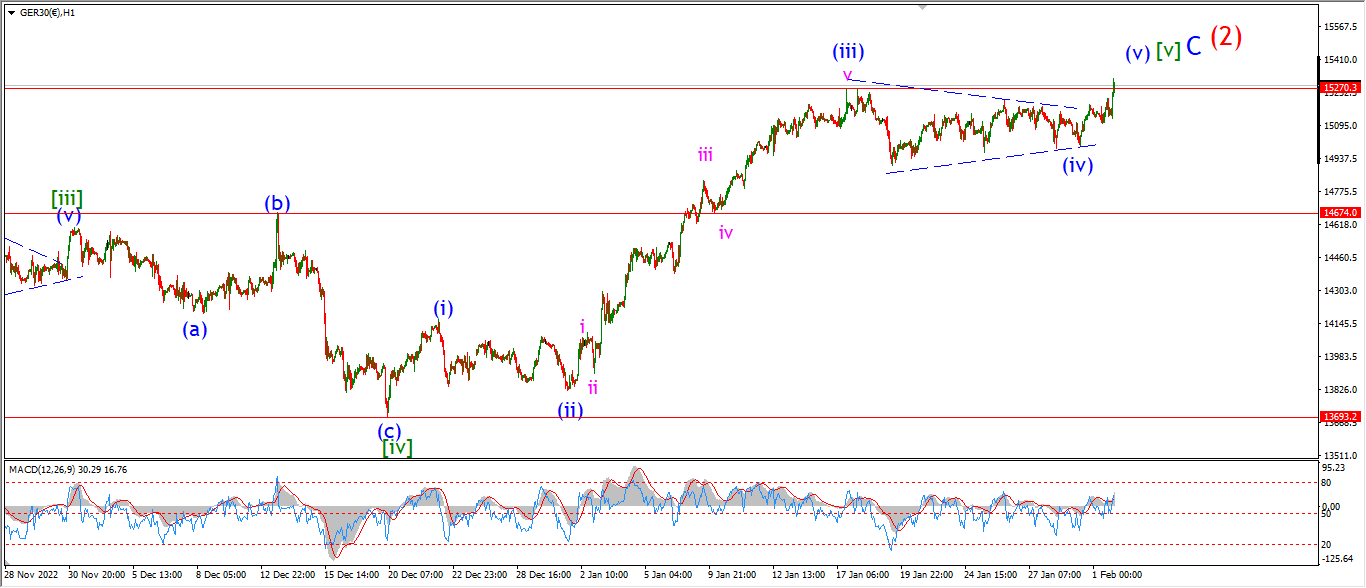
DAX 1hr
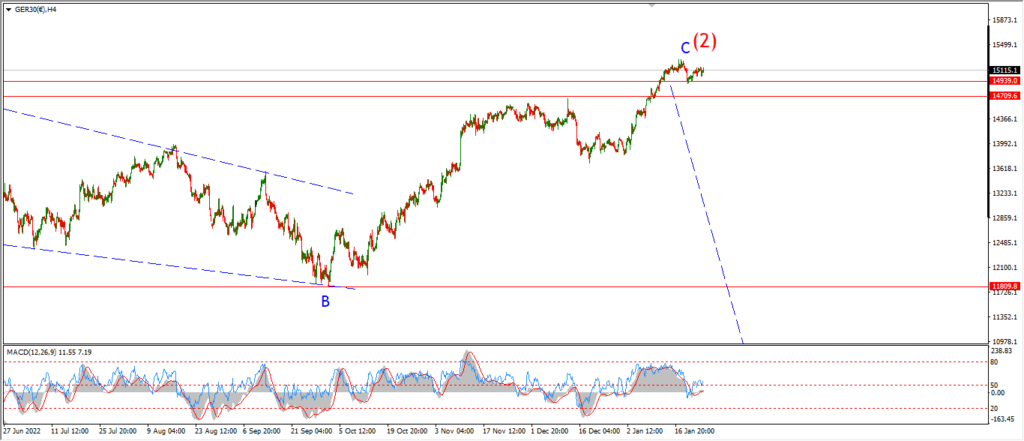
DAX 4hr

DAX daily.
….
NASDAQ 100.
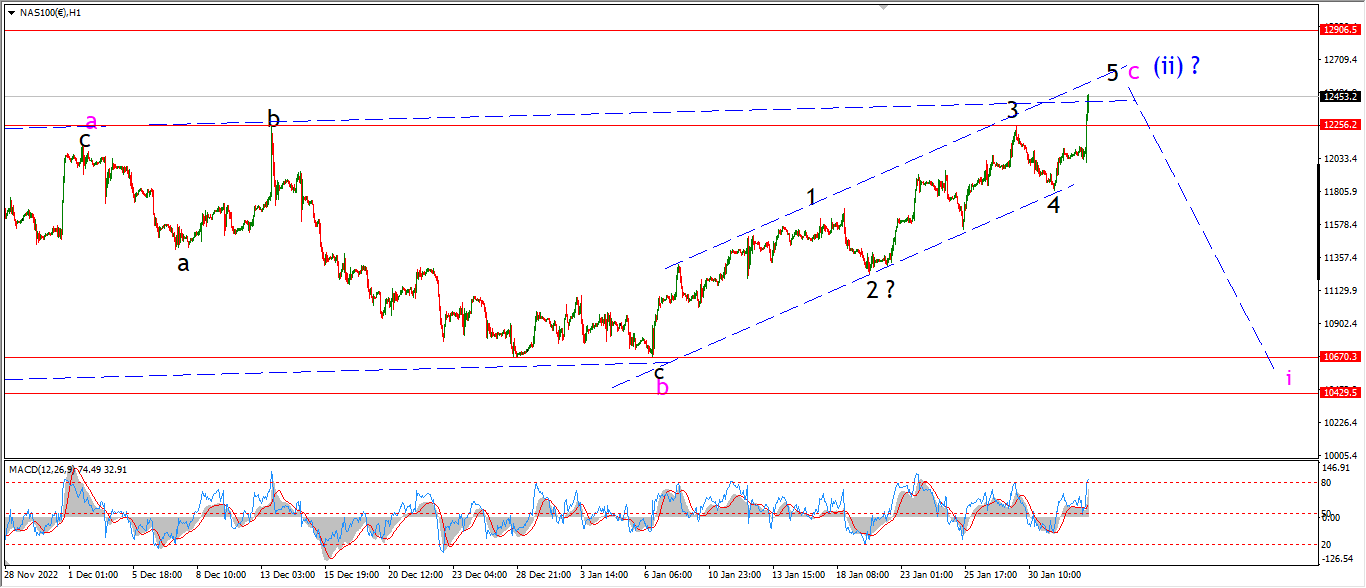
NASDAQ 1hr
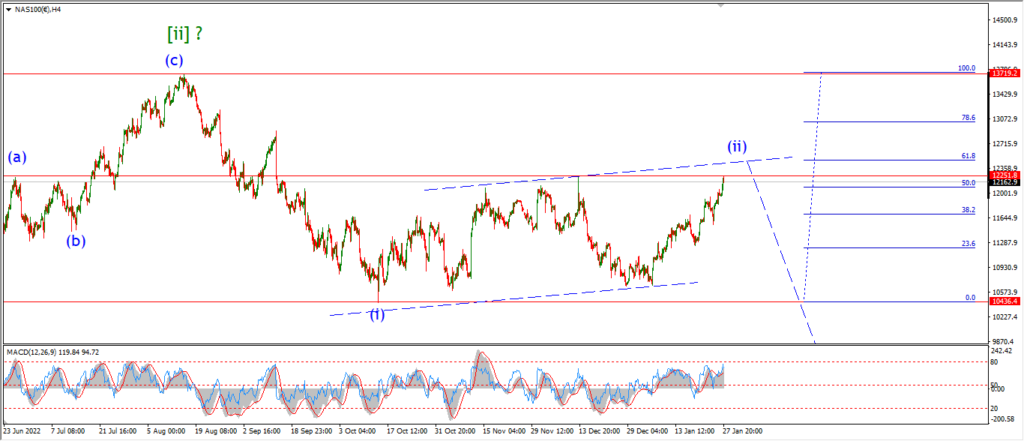
NASDAQ 4hr.

NASDAQ daily.
….