
Good evening to one and all.
The Lord’s Blessings to you all.
https://twitter.com/bullwavesreal
EURUSD.
EURUSD 1hr.
EURUSD 4hr.

EURUSD daily.
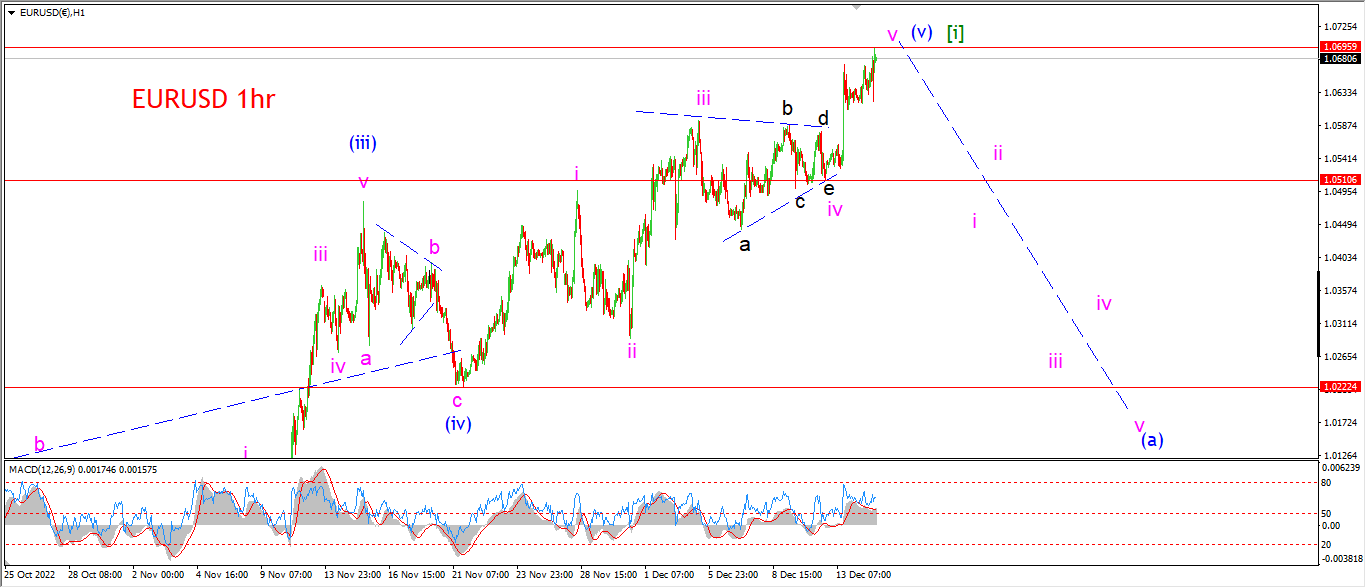
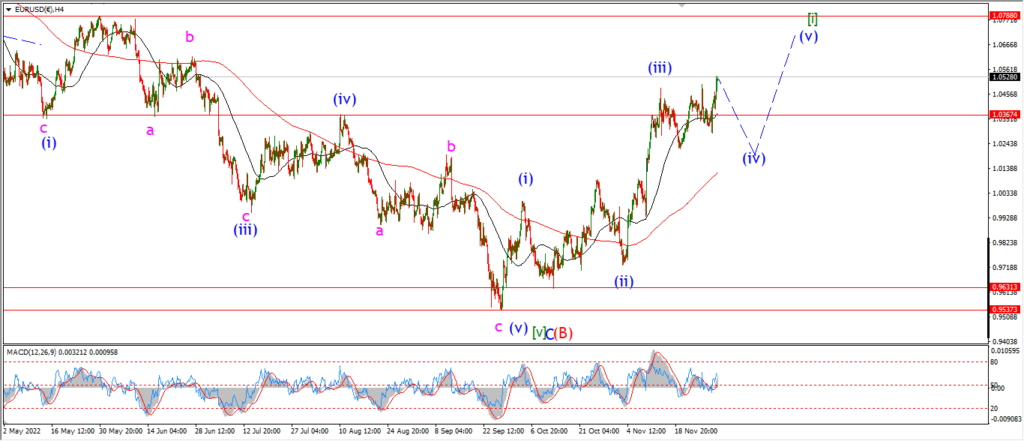
Another day is over and we have another possibility for a topping pattern in wave (v) of [i].
If we take the view that wave ‘iv’ pink was a triangle rather than a straight three wave decline.
Then we can construct a clear five wave pattern in wave (v) blue into todays top.
Wave ‘v’ pink even has an internal five wave pattern now in place also.
And again this points to a compelted rally in wave [i] now.
tomorrow;
WAtch for wave ‘v’ pink to close out and reverse by the end of this week.
It seems the larger wave (v) now has a valid five wave internal pattern in place,
and this suggests a top is imminent.
GBPUSD
GBPUSD 1hr.
GBPUSD 4hr.

GBPUSD daily.
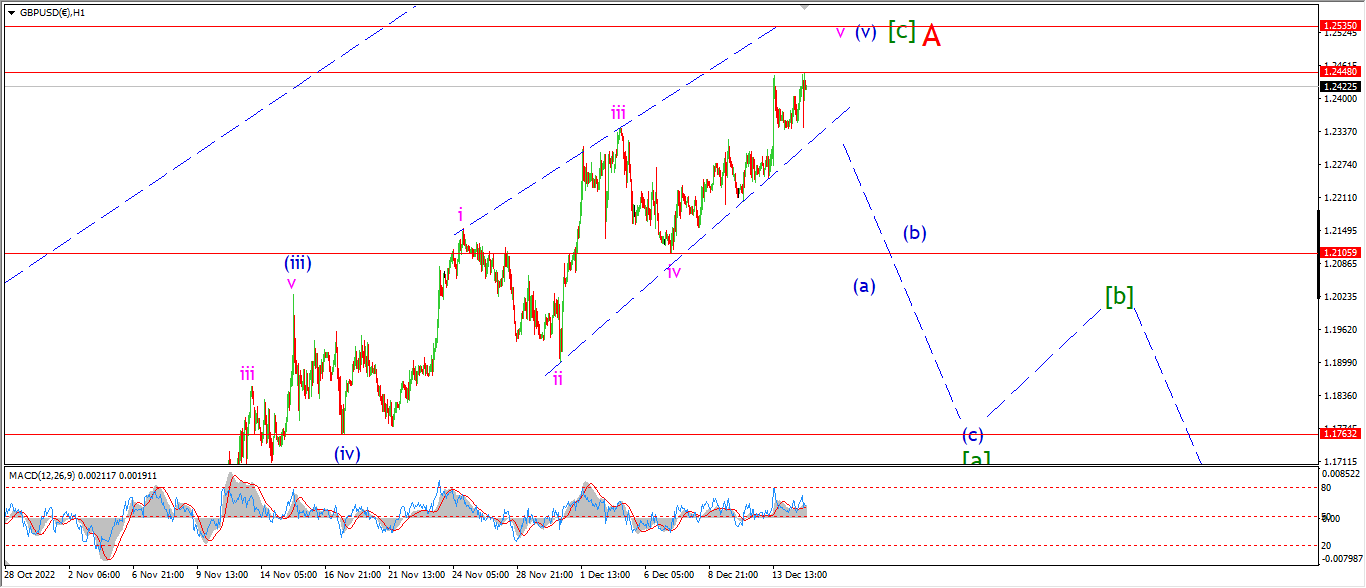
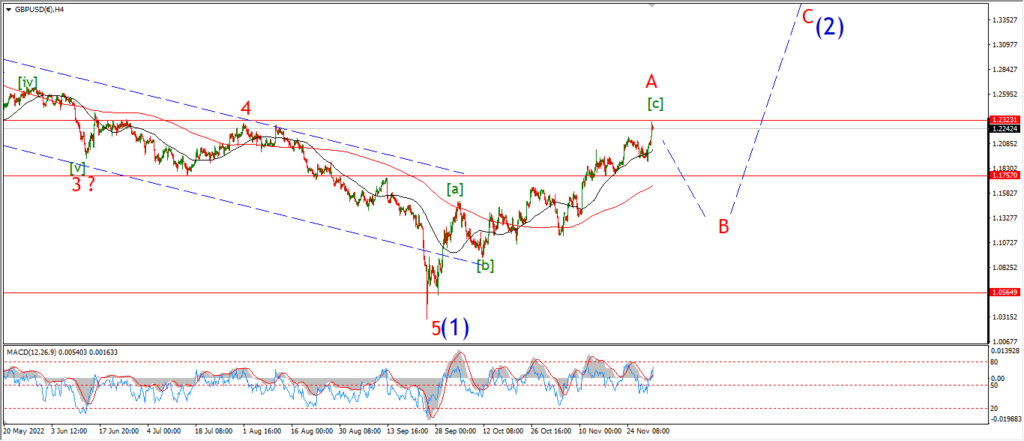
The pattern in cable is not quite as tidy as the EURUSD pattern I’m afraid.
The main issue here is the internal pattern of wave ‘v’ pink.
The action is not as clearly defined as an impulse wave yet.
Todays action was quite choppy and has been retraced this evening.
So I am allowing for another high to form to compelte wave ‘v’ as a five wave rally out of the wave ‘iv’ low at 1.2106.
When we do have an internal pattern complete in wave ‘v’ pink,
then I will look lower into wave [a] again.
Tomorrow;
Wave ‘v’ pink will reach a top this week I suspect,
and this will require another step higher to compelte a valid pattern within wave ‘v’.
Lets see how tomorrows trade adds to the picture and we can judge then where we stand.
USDJPY.
USDJPY 1hr.
USDJPY 4hr.

USDJPY daily.
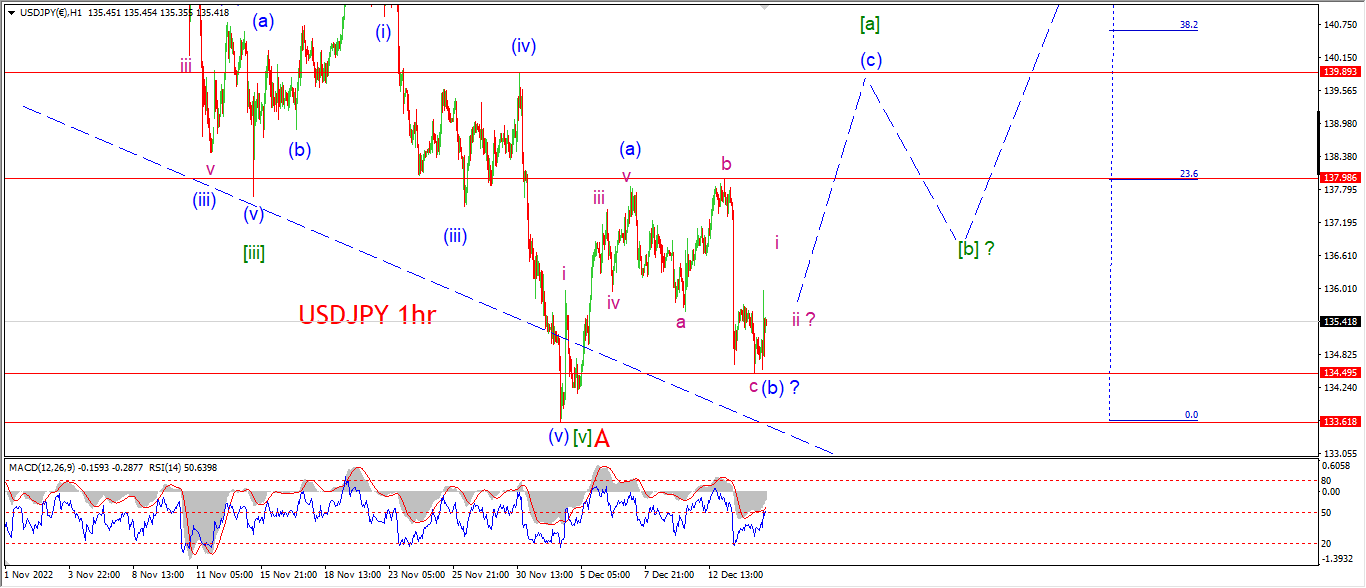
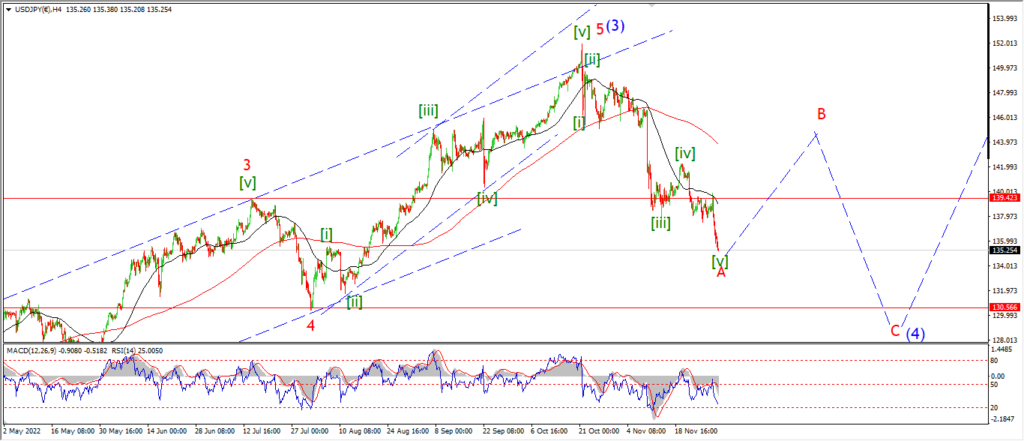
USDJPY is still holding above the wave ‘A’ lows again today,
and as such the bullish higher low is still valid at wave (b).
The action this evening was quite choppy but the price is holding above the lows of the session so far.
The price has failed to rally into wave (c) yet as I have been suggesting this week and this is concerning for sure.
But at this time the main count is still valid.
And the momtentum picture on the 4hr chart is improving also.
I am waiting for confirmation of the larger pattern with a break of 138.00 again in wave (c).
Tomorrow;
Watch for wave (b) to hold the higher lows again tomorrow.
And if the price holds above the wave (b) low at 134.50 again that will add further weight to this pattern.
Wave ‘i’ of (c) should break 136.00 to complete.
DOW JONES.
DOW 1hr.
DOW 4hr
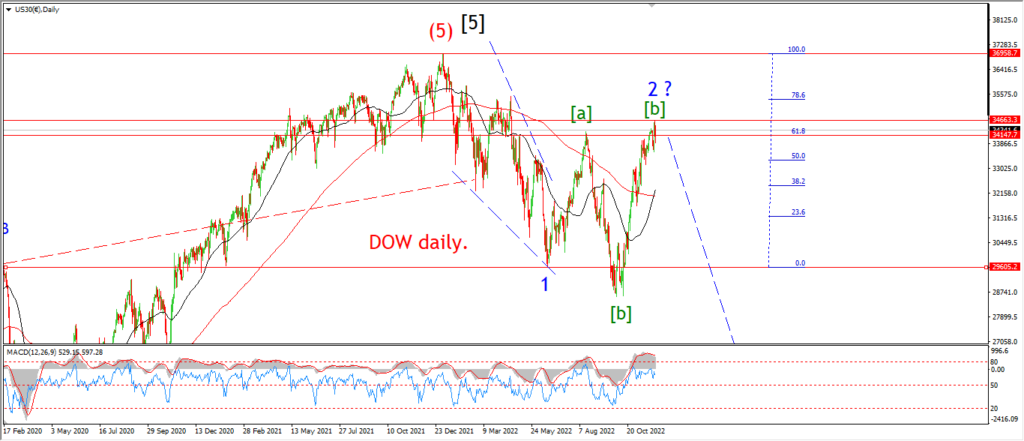
DOW daily.
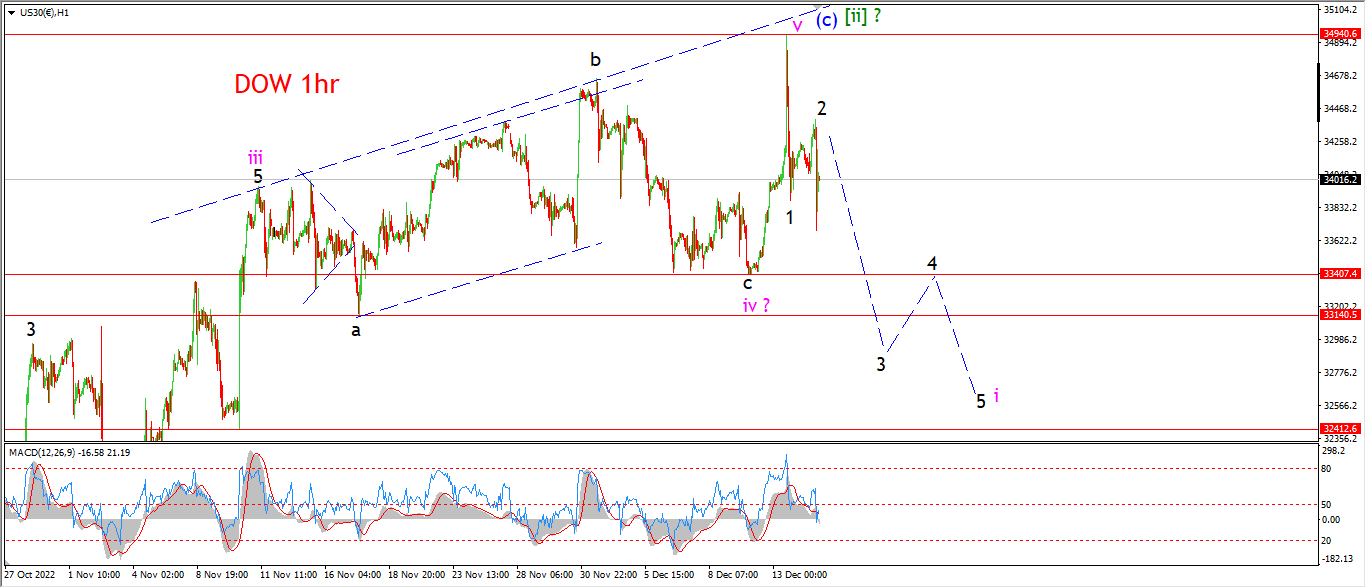
The action today was in the right direction at least,
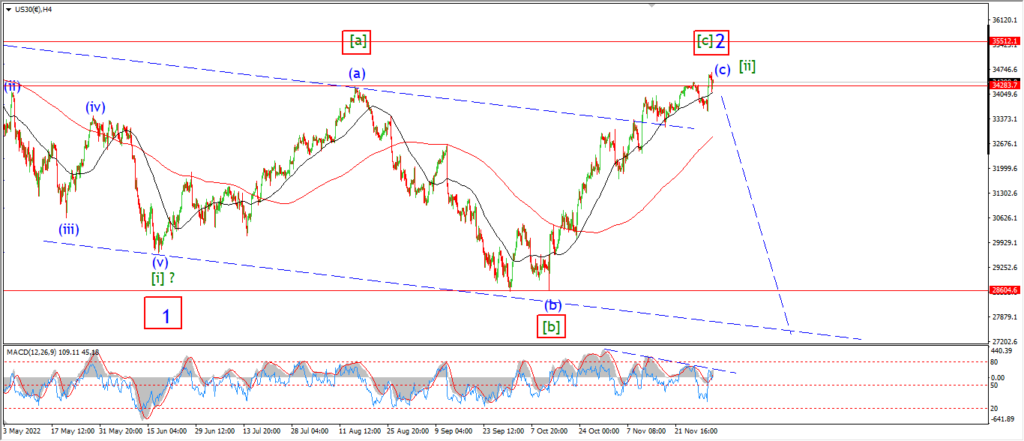
but I can’t say that we have confirmation of a top in place for wave [ii] just yet.
The decline off wave [ii] really must take out a series of support levels within the previous rally in order to get serious again to the downside.
I think the key level in the short term lies at 33000,
if we hit 33000 again that will break two previous supports and open the way for a five wave decline off the high.
The next lower support lies at 32410,
and below that at 31700.
So there is much to do for wave ‘i’ down here.
Even though todays decline is welcome for sure,
I do need a much larger impulse move off wave [ii] in order to condsider wave (i) of [iii] as underway.
Tomorrow;
A positive to take away from todays trade is the face that we have another impulsive decline followed by a three wave correction to a lower high lavelled wave ‘2’.
It remains to be seen if wave ‘3’ of ‘i’ can take over now.
Wave ‘3’ must fall into 33000 in order to confirm wave ‘i’ is underway.
GOLD
GOLD 1hr.
GOLD 4hr.

GOLD daily.
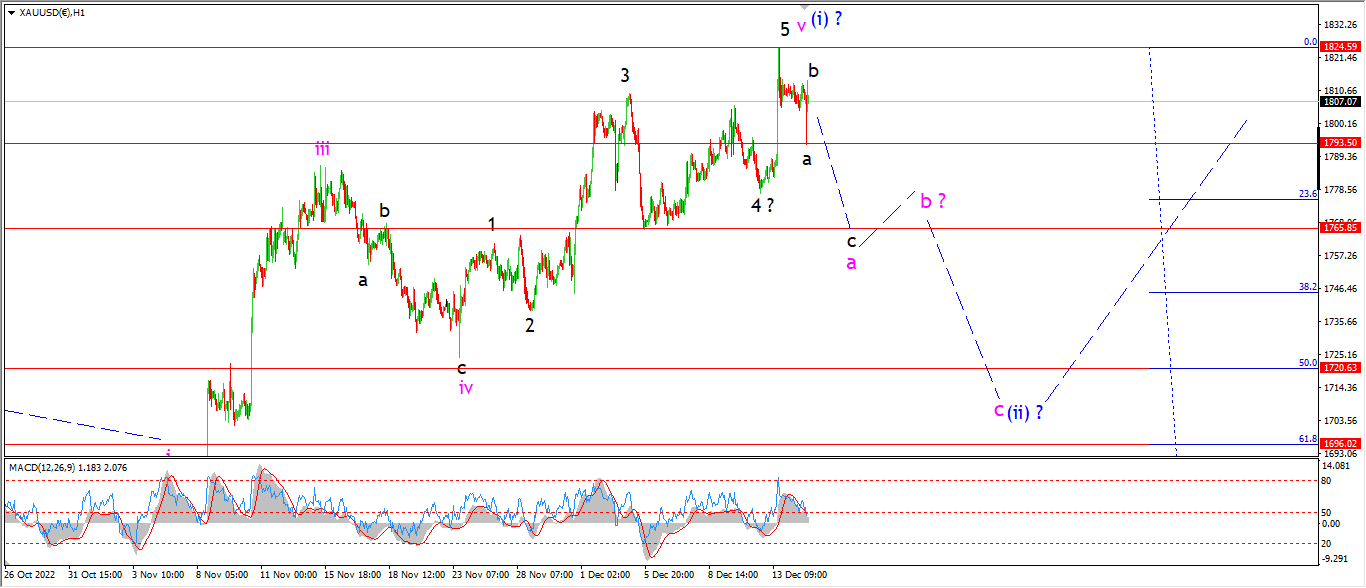
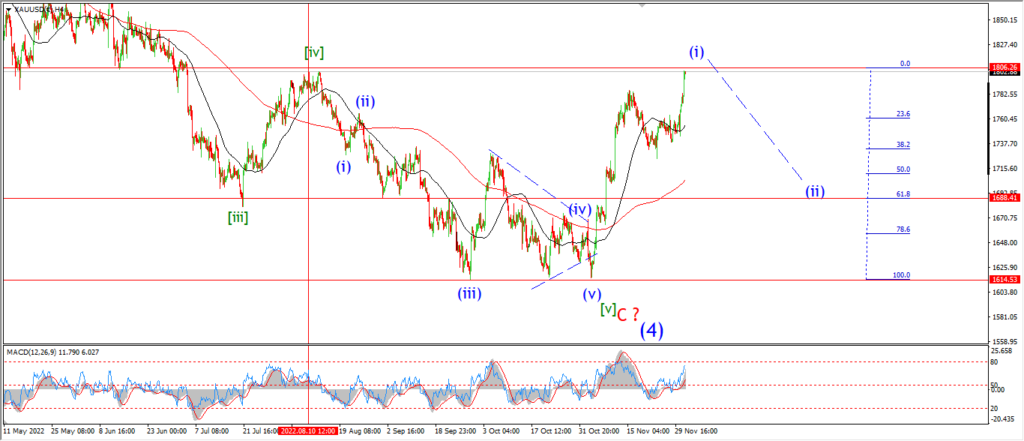
Gold has managed a three wave decline off this weeks high at wave (i) so far.
this three wave drop is labelled wave ‘a’ of ‘a’ now.
And a small lower high this evening can be viewed as wave ‘b’.
I am looking for wave ‘c’ of ‘a’ to complete this week,
and I still think wave the 1760 area is a good target area for wave ‘a’ to complete.
Tomorrow;
Watch for the high at wave (i) to hold and wave ‘a’ of (ii) to complete three waves down before the end of the week.
If price breaks 1790 again that should signal wave ‘c’ is underway.
CRUDE OIL.
CRUDE OIL 1hr.
CRUDE OIL 4hr.
CRUDE OIL daily.
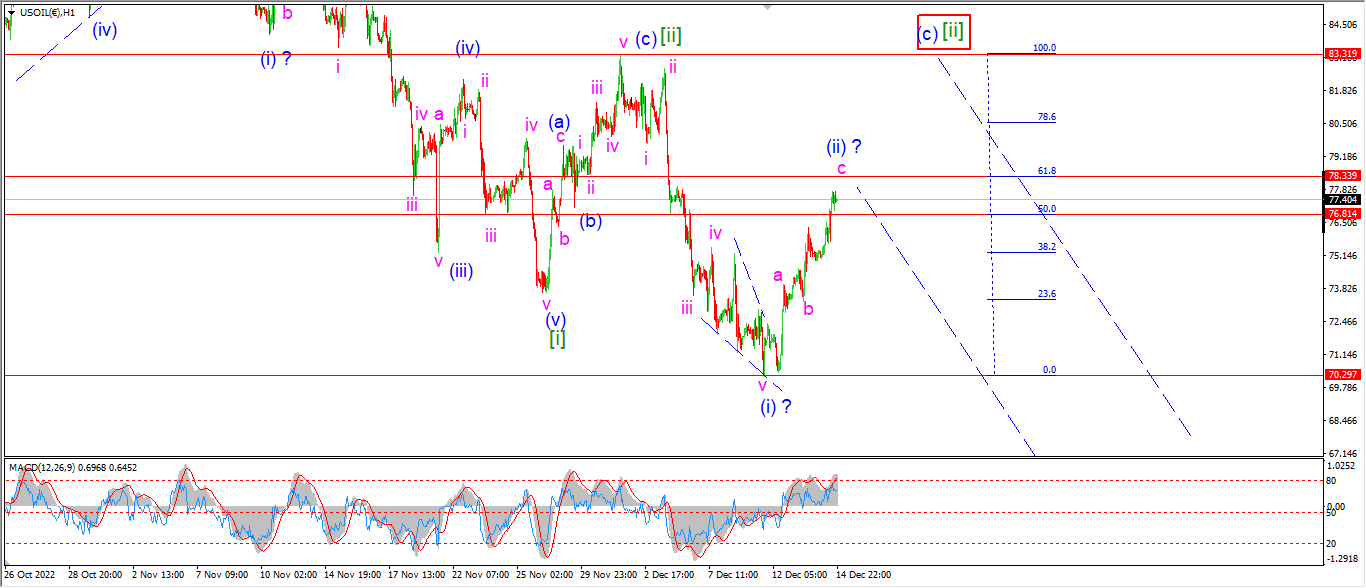
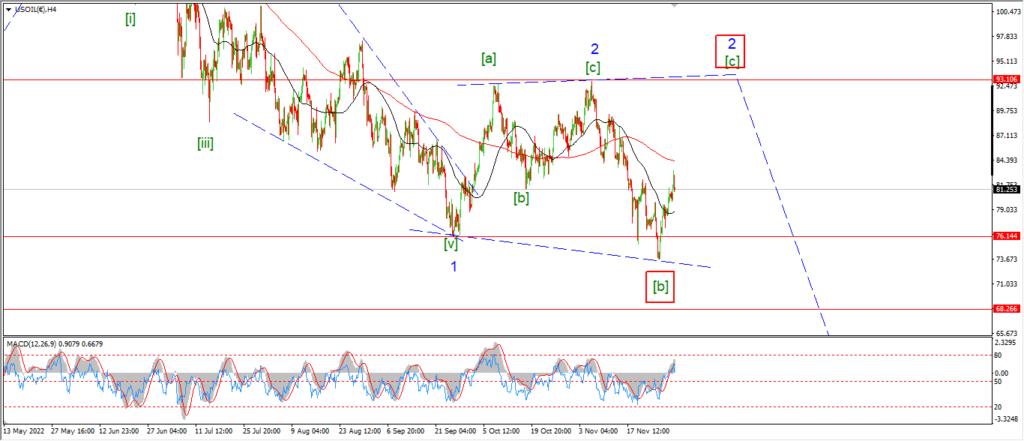
Crude has reached the target area for thie correction in wave (ii) quicker than I suspected.
the top this evening is resting directly between the 50% and 62% retracement levels now.
Going by the fact that the target has been reached,
I think it is reasonable to consider the idea that wave (ii) is close to complete now.
Adn if this is correct,
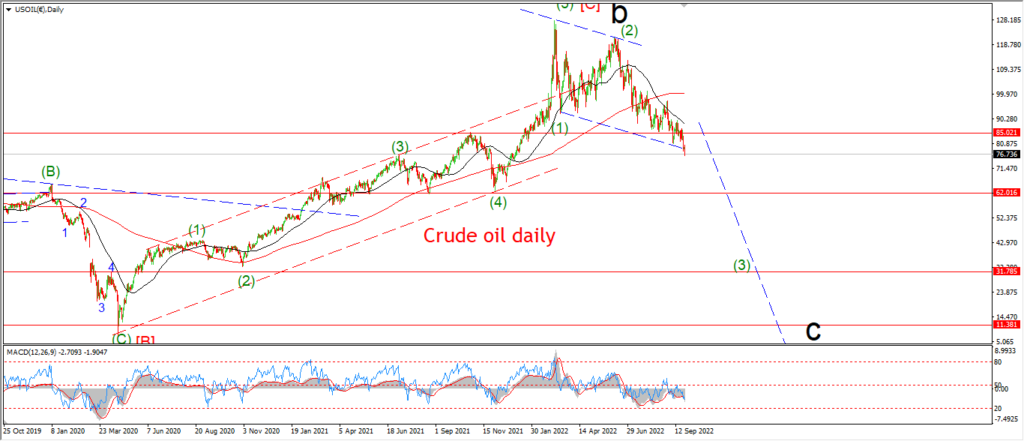
then we should see a decline begin again into wave (iii) over the coming days.
The alternate count can also explain the recent rally quite well as wave (c) of [ii].
In this scenario,
wave (c) will continue towards the 83.00 handle again in a five wave pattern overall.
If the price continues higher again tomorrow then I will favor this alternate idea for wave [ii].
Tomorrow;
Watch for wave (ii) to show sings of a top beginning tomorrow.
If the price fails at this target area and falls impulsively again,
that action will favor the idea that wave ‘i’ of (iii) is underway.
S&P 500.
S&P 500 1hr
S&P 500 4hr
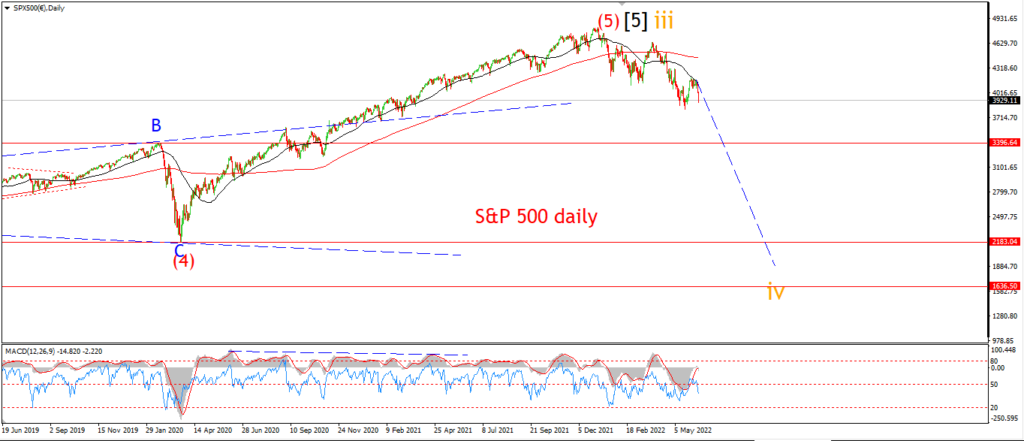
S&P 500 daily.
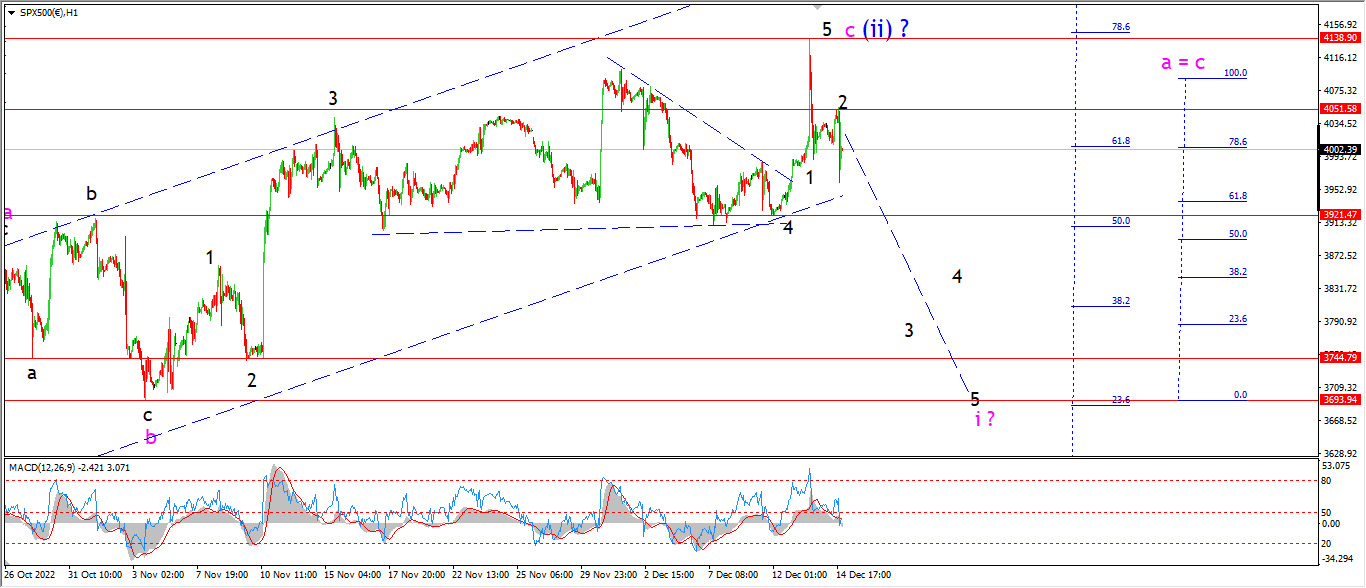
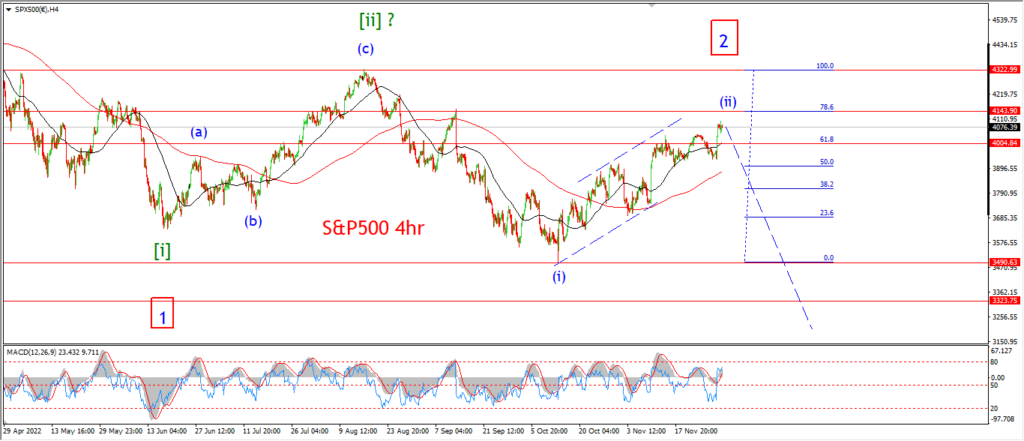
Much like the Dow we have a three wave decline in place off the top of wave (ii) after todays trade.
The main count calls for a continued decline in wave ‘3’ of ‘i’ into the end of this week.
So I am looking for more follow through to the downside again tomorrow to reinforce the idea that wave (ii) has indeed topped out now.
I want to see wave ‘3’ of ‘i’ fall back below 3800 again.
And the main targe for wave ‘i’ pink lies at the wave ‘b’ low at 3690.
So there is more work to do here before I can get confident that wave ‘i’ is underway.
Tomorrow;
Watch for wave ‘2’ to hold at today highs.
Wave ‘i’ must make more progress this week,
so I am looking for wave ‘3’ of ‘i’ to continue lower towards that 3800 level tomorrow.
If the price turns higher again tomorrow I will have to abandon my count for wave ‘i’ down.
SILVER.
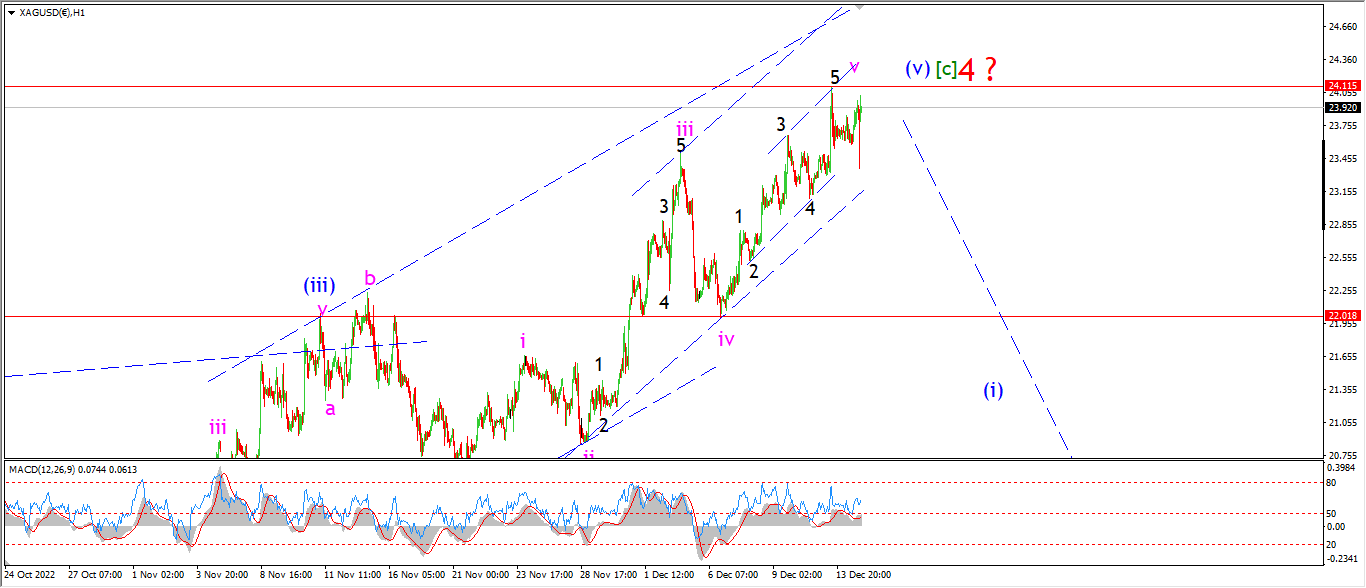
SILVER 1hr
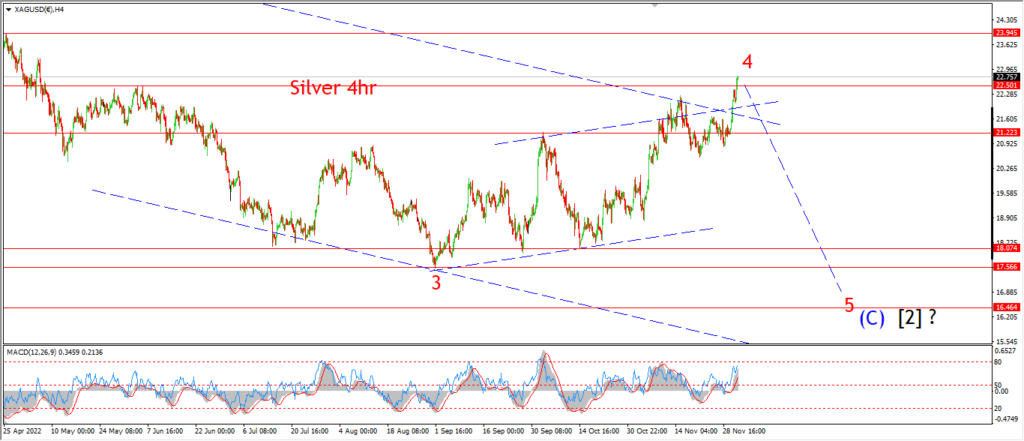
SILVER 4hr.
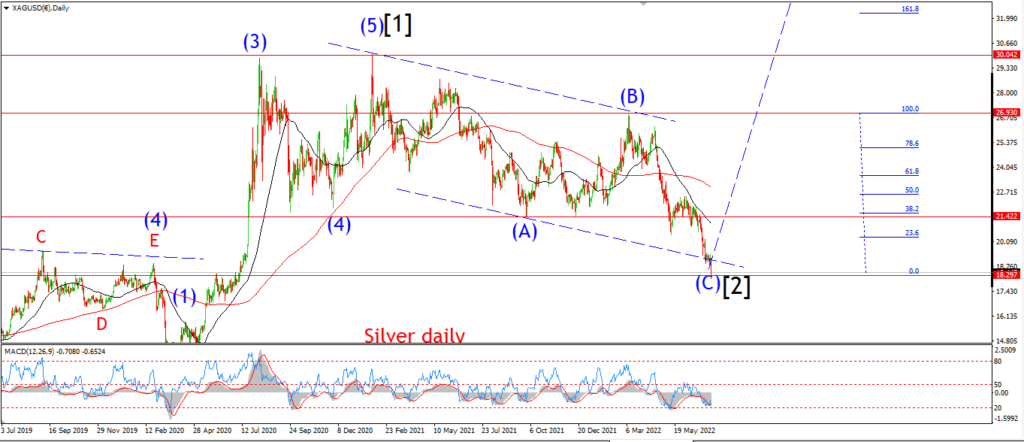
SILVER daily.
The action today is inconclusive to be honest.
a three wave decline has been mostly retraced this evening,
and this action does suggest there is another high waiting for silver before completing wave [c] of ‘4’.
But the main pattern has not been invalidated just yet.
So at the moment I am forced to sit and be patient to let the pattern reveal itself.
I have shown a series of trend channels marking the rise into wave (v) of [c].
The action is getting boxed into a corner here as the lower degree subwaves all complete their patterns.
Momentum is slowing and the action is getting tighter.
So I am looking for the day when the price breaks down out of these channels and signals an end to this rally.
Tomorrow;
Lets see if the high at wave ‘5’ will hold.
Watch for a break out below the lower channel line at bout 23.00 to signal wave ‘v’ pink is complete.
BITCOIN
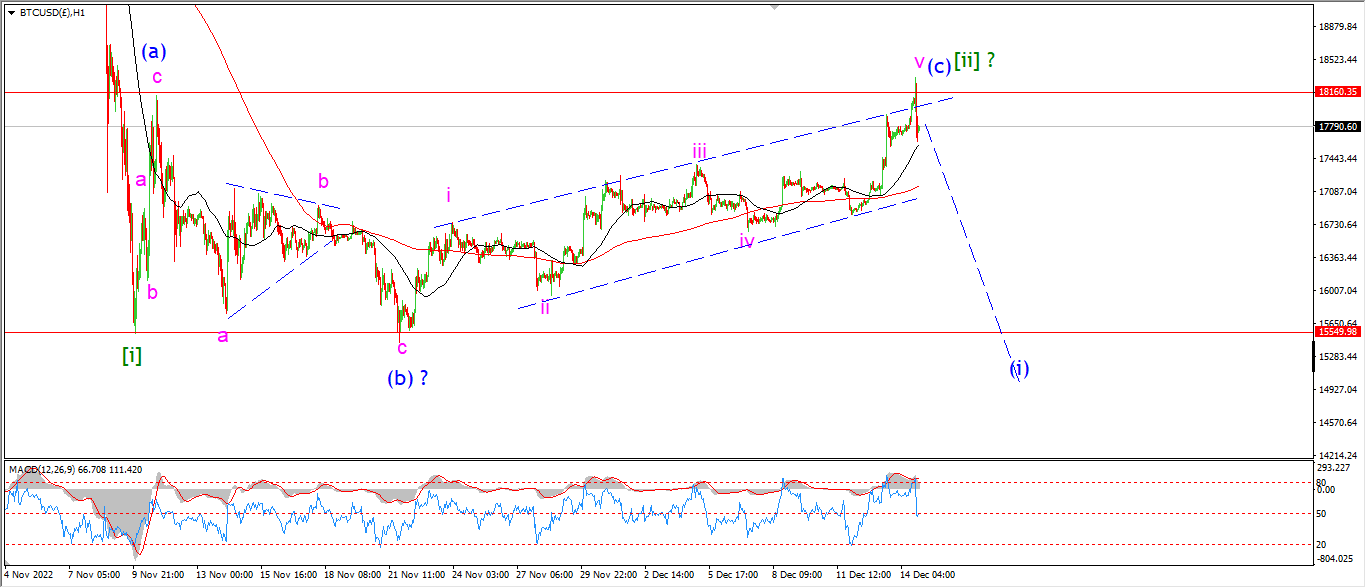
BITCOIN 1hr.
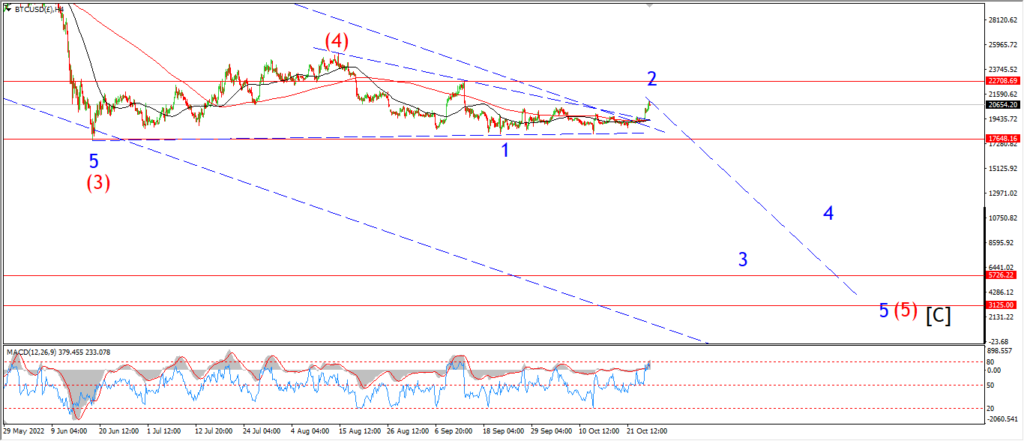
BITCOIN 4hr.

BITCOIN daily.
….
FTSE 100.
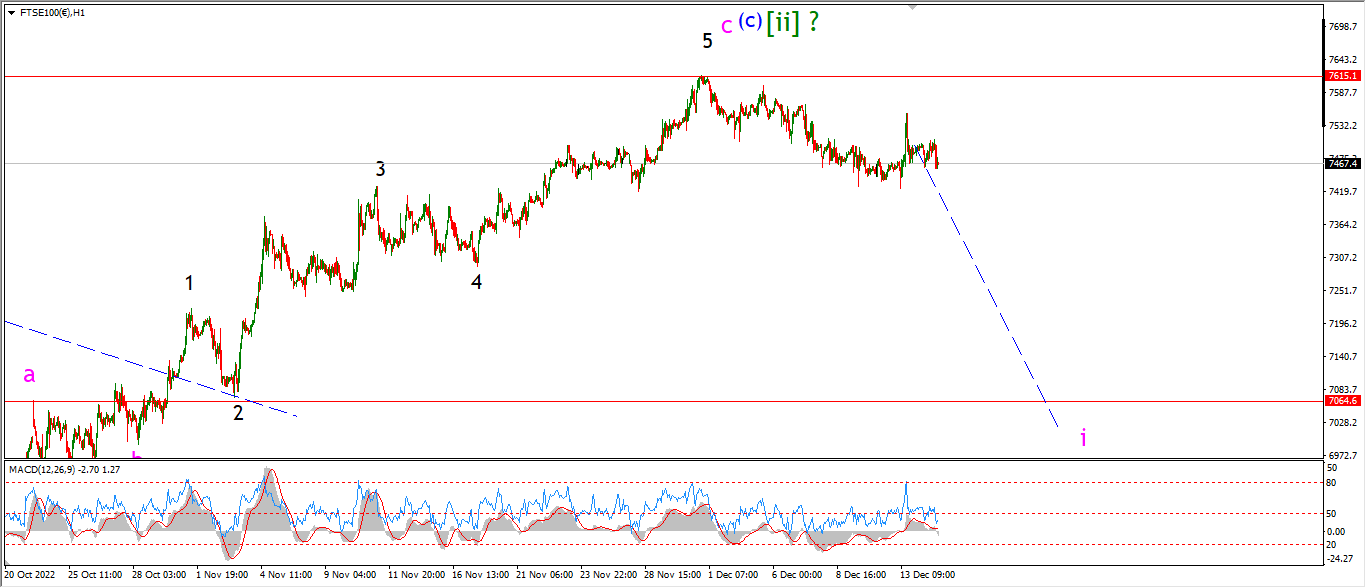
FTSE 100 1hr.
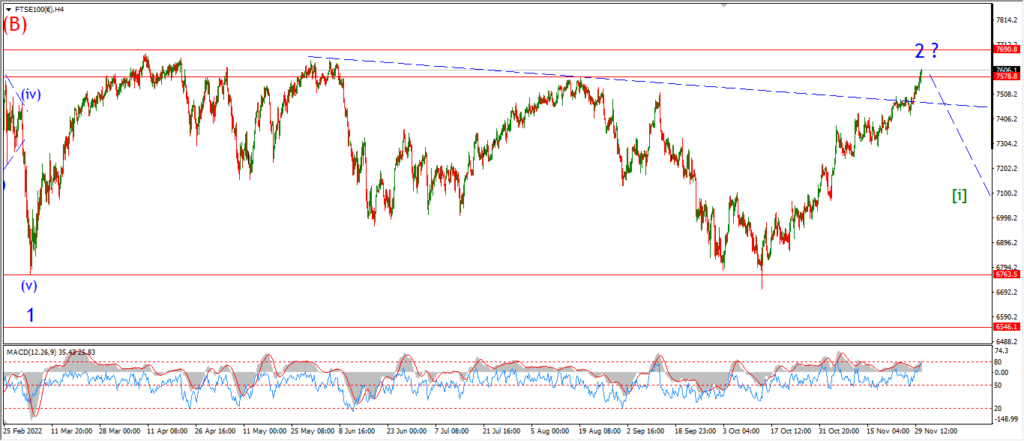
FTSE 100 4hr.

FTSE 100 daily.
….
DAX.
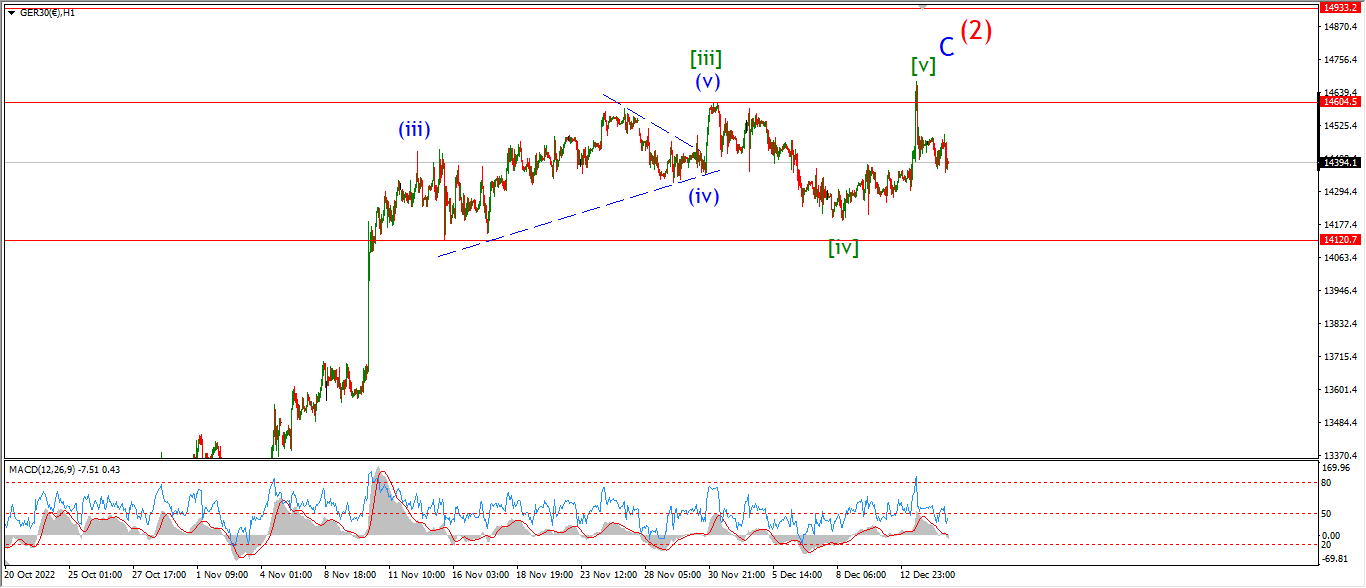
DAX 1hr
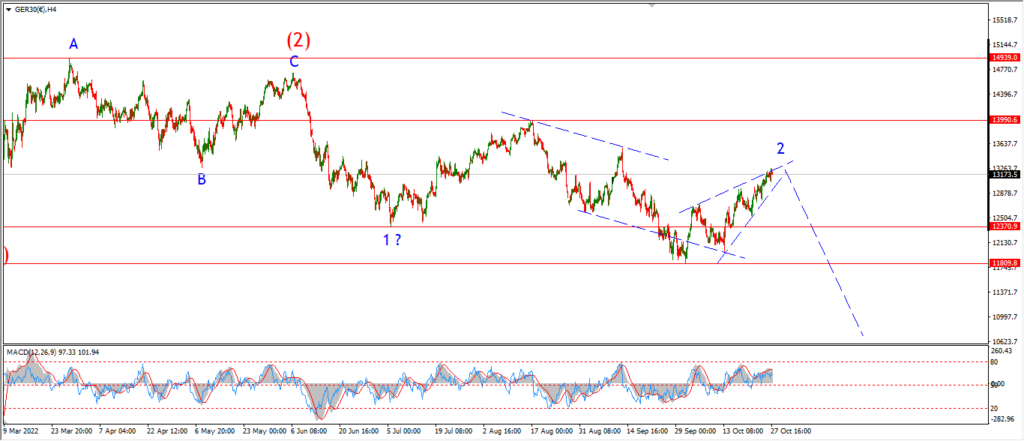
DAX 4hr

DAX daily.
….
NASDAQ 100.
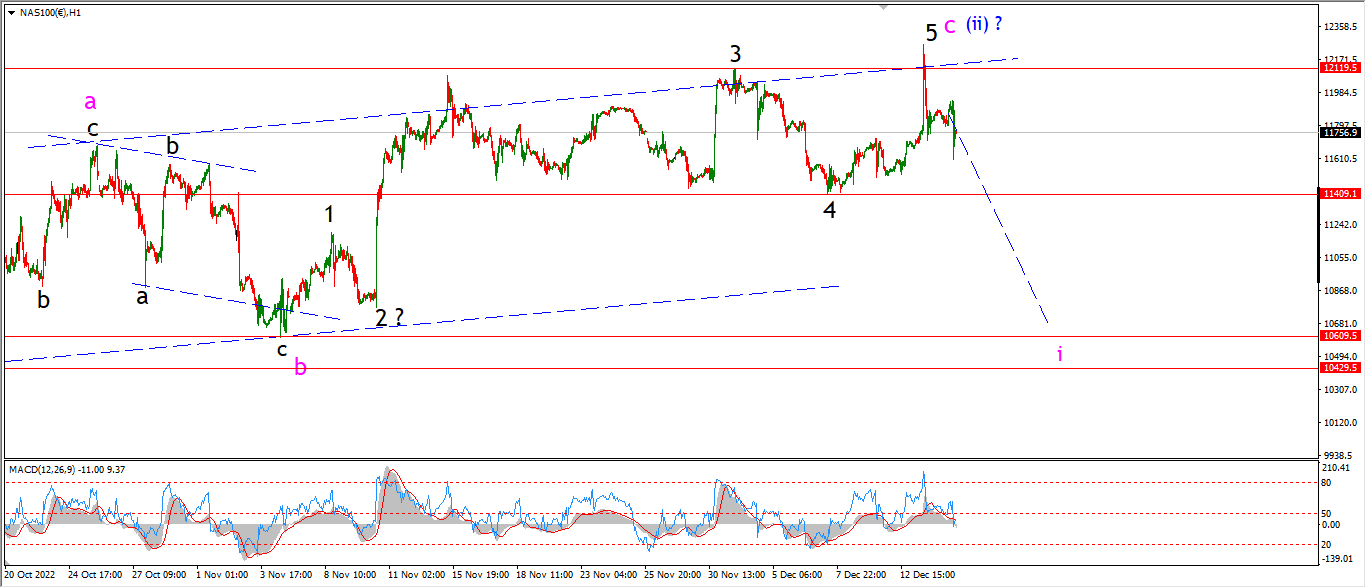
NASDAQ 1hr
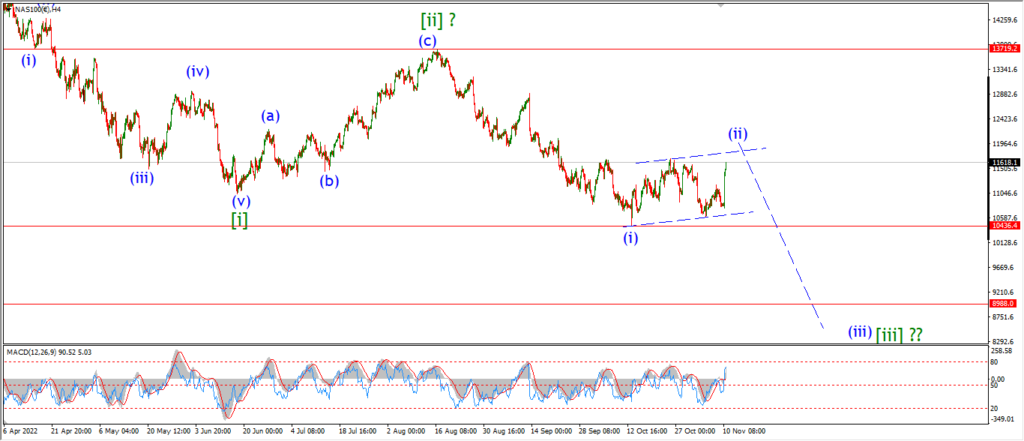
NASDAQ 4hr.

NASDAQ daily.
….