
Good evening to one and all.
The Lord’s Blessings to you all.
https://twitter.com/bullwavesreal
EURUSD.
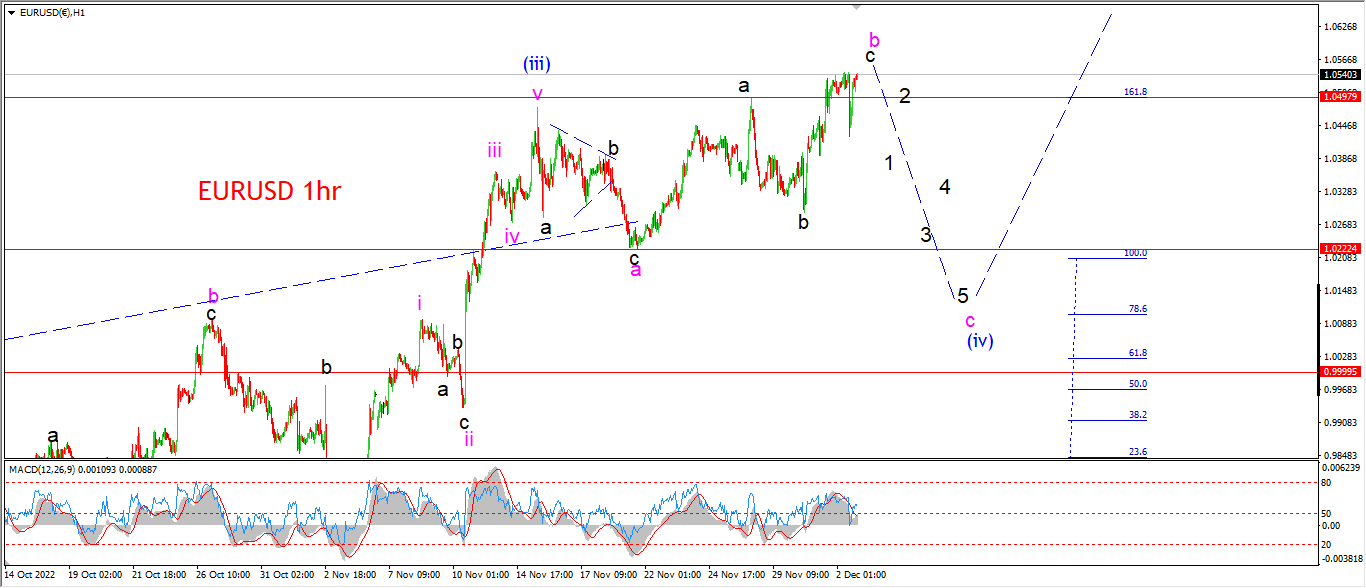
EURUSD 1hr.
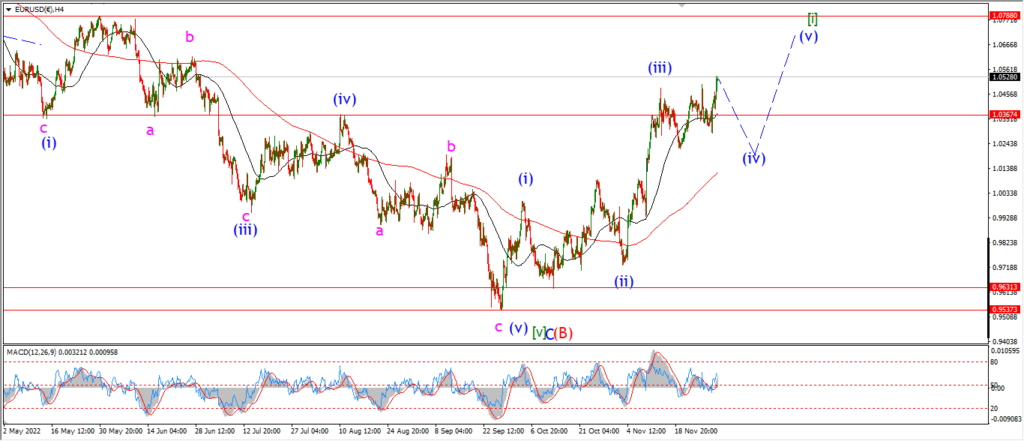
EURUSD 4hr.

EURUSD daily.
EURUSD has made an attempt at reversing off the highs today.
the price dipped with a sharp spike lower this mrning,
but that decline has been mostly recovered this evening.
I am not certain about the idea that wave ‘c’ is underway now,
but there is a lower high in place this evening,
so there is a possibility at least that wave ‘b’ is complete at Thursdays highs.
And now we needd to see a five wave decline into wave ‘c’ down over the coming week to confirm this pattern.
Monday;
Watch for a top to be confirmed in wave ‘b’ of (iv).
And then wave ‘c’ to fall back below 1.0222 again to complete.
GBPUSD
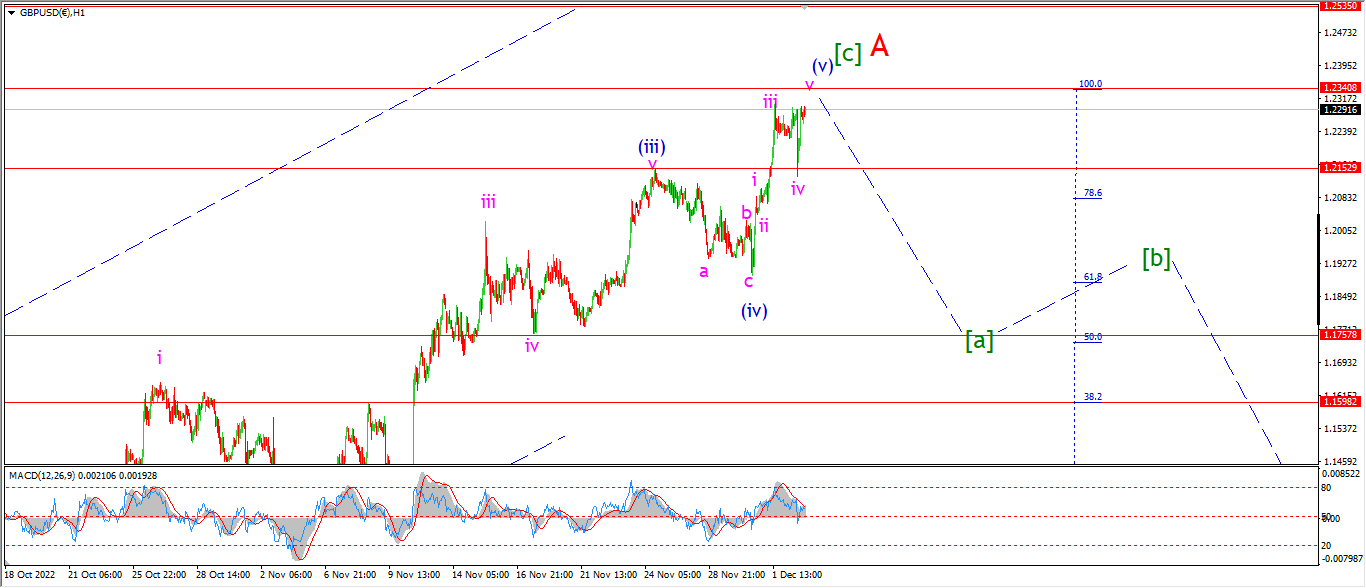
GBPUSD 1hr.
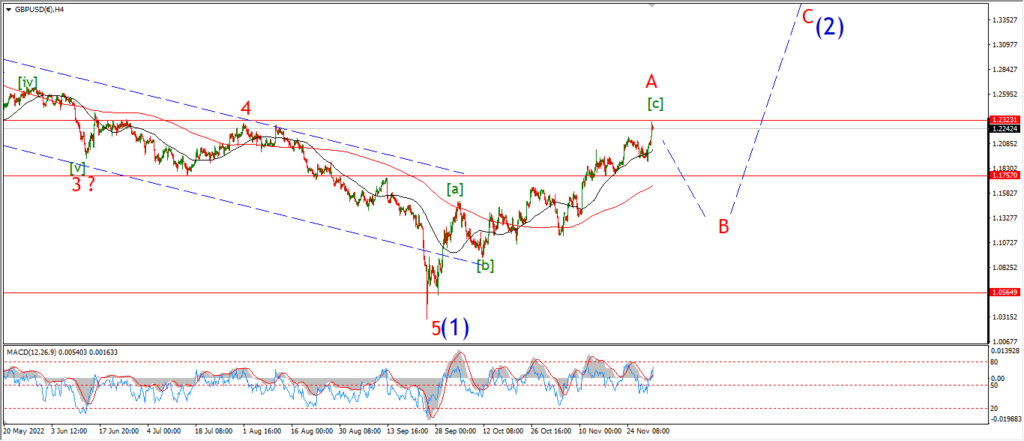
GBPUSD 4hr.

GBPUSD daily.
I am calling todays drop in cable a three wave correction in wave ‘iv’ of (v).
Wave ‘v’ of (v) should push to a new high above 1.2310.
And then wave [c] will be complete.
Once the pattern tops out in wave [c] of ‘A’,
then I will look lower into wave [a] next week.
Monday;
Watch for wave ‘v’ of (v) to form one last high above 1.2310.
And then I will look for a reversal lower into wave [a].
The pattern in wave (v) should be done by Monday evening.
And if this count is correct,
then Tuesdays session will begin the decline into wave [a].
USDJPY.
USDJPY 1hr.
USDJPY 4hr.

USDJPY daily.
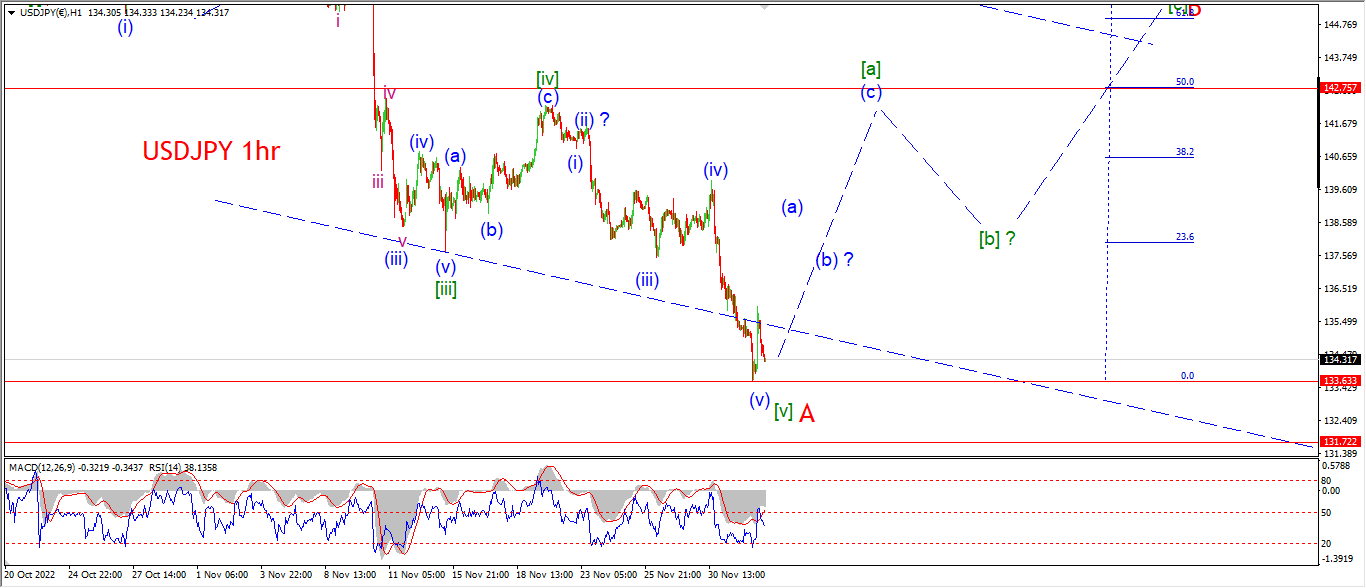
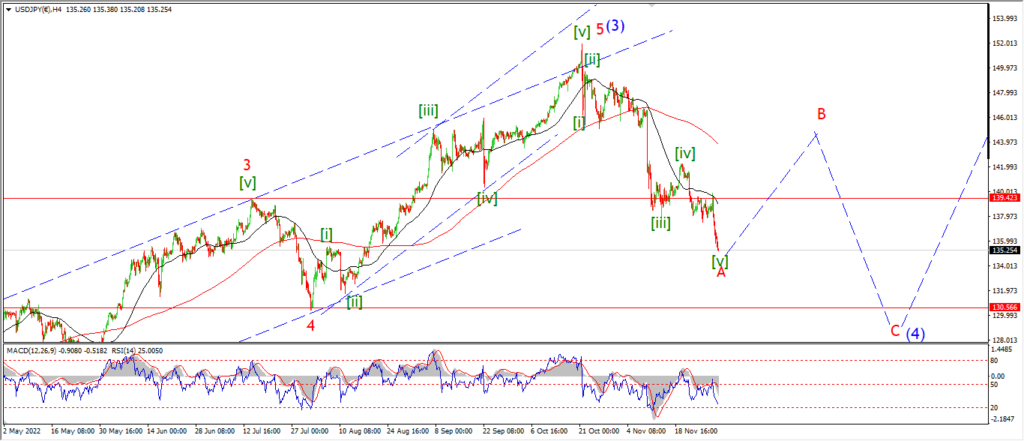
The bounce we saw today off the lows is a hint that this pair is ready to turn higher again after a long decline into wave ‘A’.
Wave ‘B’ has not been confirmed yet by a long shot,
but if the price holds above the low at 133.60 on Monday,
that will increase the odds of a rally into wave [a] next week.
Monday;
That is the aim on Monday then,
watch for the low at 133.60 to hold at wave ‘A’.
Wave (a) of [a] should rise above 138.00 in at least three waves.
And if that happens,
then I then wave ‘B’ has a real chance at taking the price higher over the coming weeks.
DOW JONES.
DOW 1hr.
DOW 4hr
DOW daily.
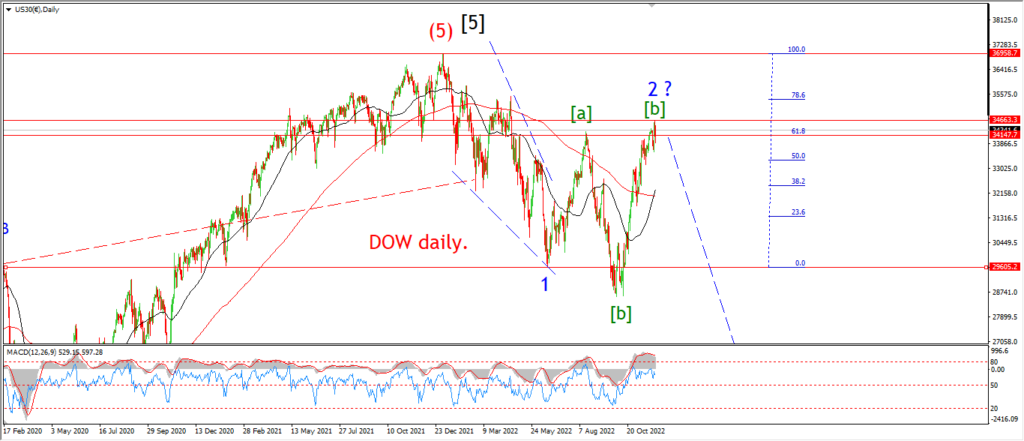
Take a look at the daily chart to begin with tonight.
I have shown the other alternate count on this chart which describes the actoin since the highs last January.
If we take the decline from January into the June lows as a leading diagonal wedge in wave ‘1’.
Then the market has been correcting sideways ever since in wave ‘2’.
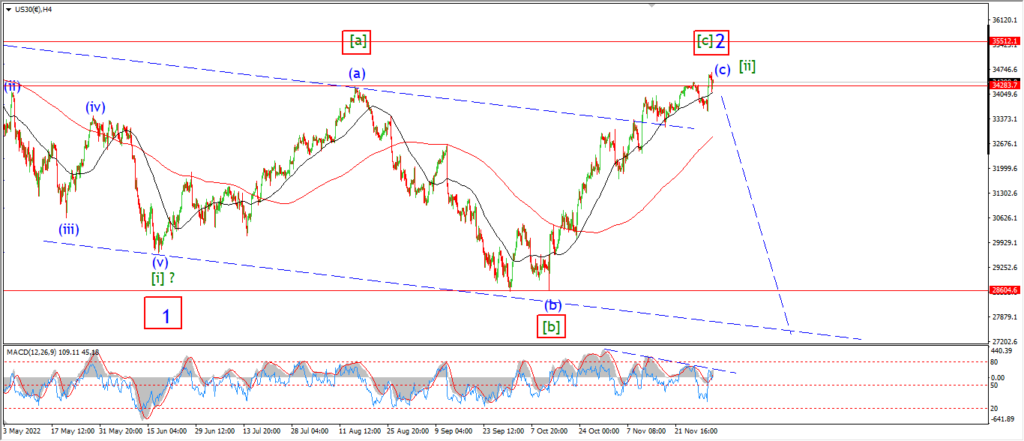
The market has put in some wild swings that can be interpreted in a few ways as I have shown on the 4hr chart.
But a three wave expanded flat correction in wave ‘2’ is a legitimate way to view this pattern also.
This weeks highs have broken above the 61.8% retracement level of wave ‘1’.
And the Daily momentum has turned lower off a multi year extreme high over the last month.
If this alternate count is correct,
then wave ‘2’ is now complete.
And the next step is wave ‘3’ down.
Monday;
As for the main hourly count;
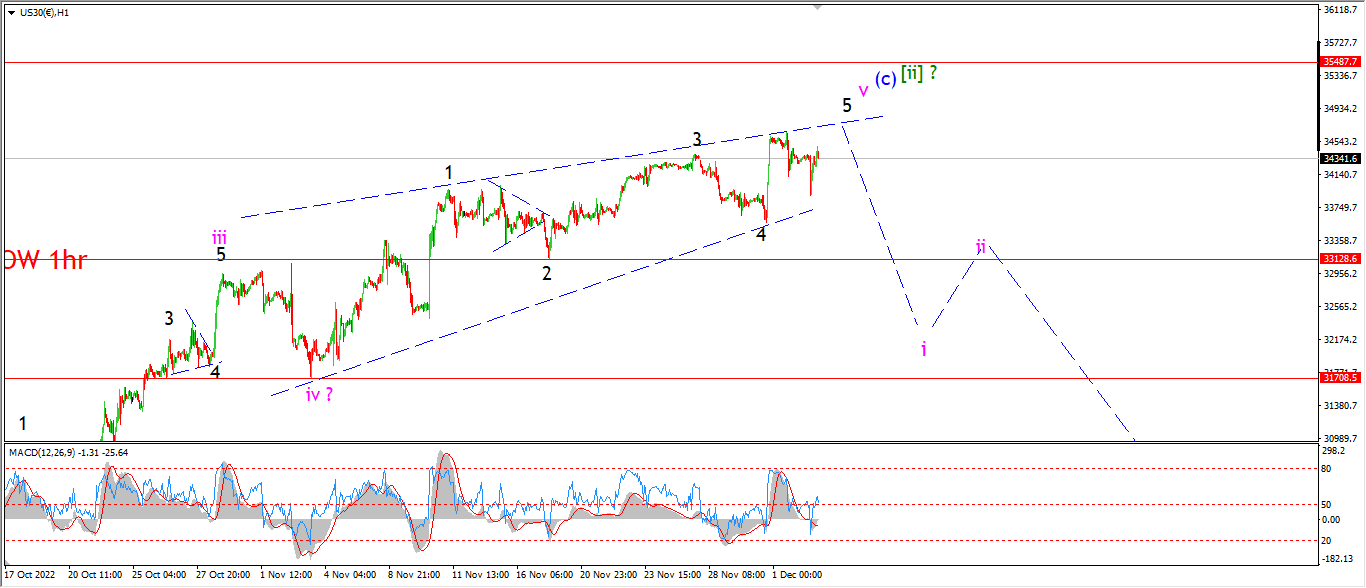
We have a decline today but the action has traced out three waves down off the wave ‘5’ high so far.
This action leaves the door open for another pop on Monday to a new high to compelte a clearer three wave pattern within wave ‘5’.
If the market turns down sharply on Monday,
then we have another completed pattern in wave ‘v’ of (c) and at least the possibility of a decline into wave ‘i’ as shown.
Watch for that final three wave pattern in wave ‘5’ of ‘v’ to complete an ending diagonal as shown.
GOLD
GOLD 1hr.
GOLD 4hr.

GOLD daily.
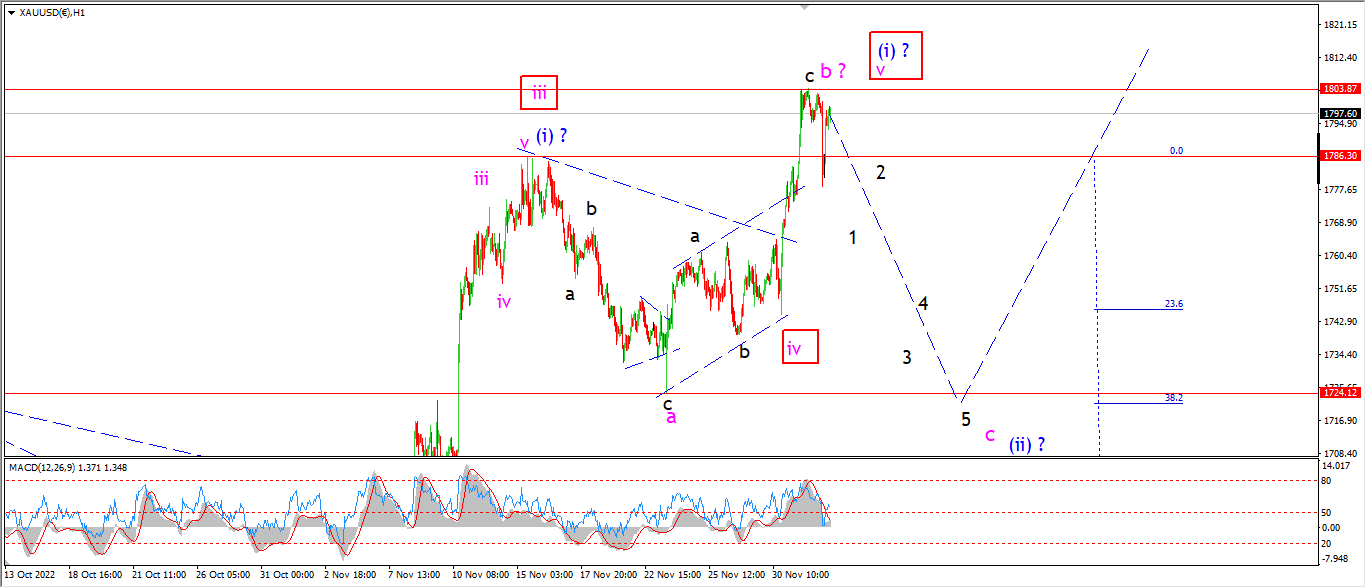
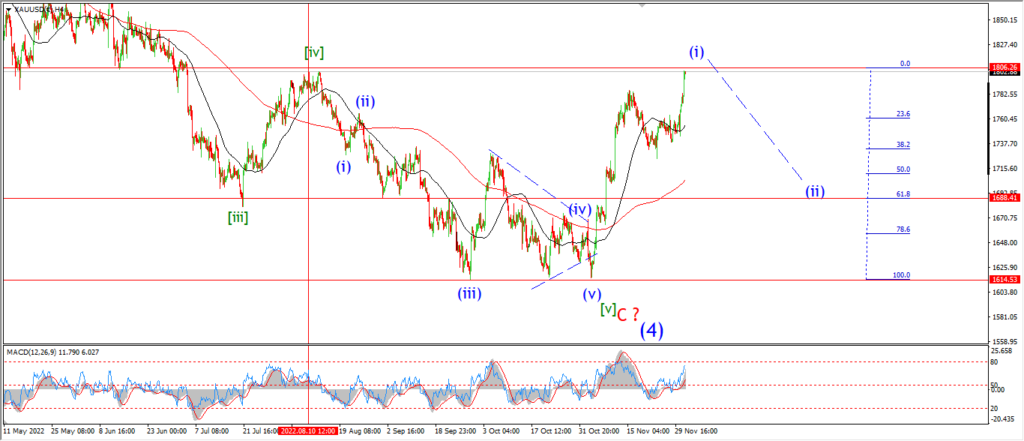
The whipsaw action rippled across all markets today and gold was no different.
the decline off this weeks highs is not a clear impulse wave so I am open to a slight new high on Monday.
This will compelte either wave ‘b’ of (ii),
or wave ‘v’ of (i).
Which ever pattern the market chooses,
the next major move will be to the downside to complete wave (ii) blue.
The main count calls for a decline into wave ‘c’ of (ii) in a five wave pattern.
and we should see at least a break of 1724 again in this scenario.
Monday;
watch for wave ‘b’ to finally top out and then prices will be free to fall into wave ‘c’ as shown.
CRUDE OIL.
CRUDE OIL 1hr.
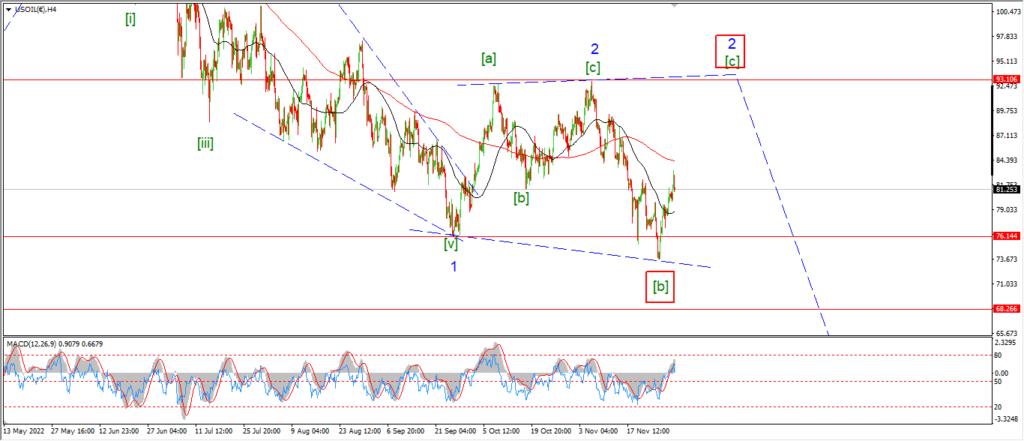
CRUDE OIL 4hr.
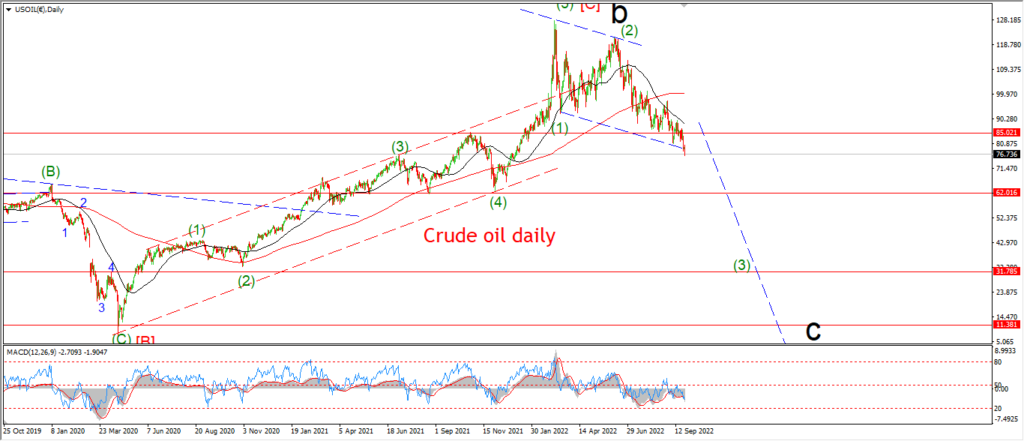
CRUDE OIL daily.
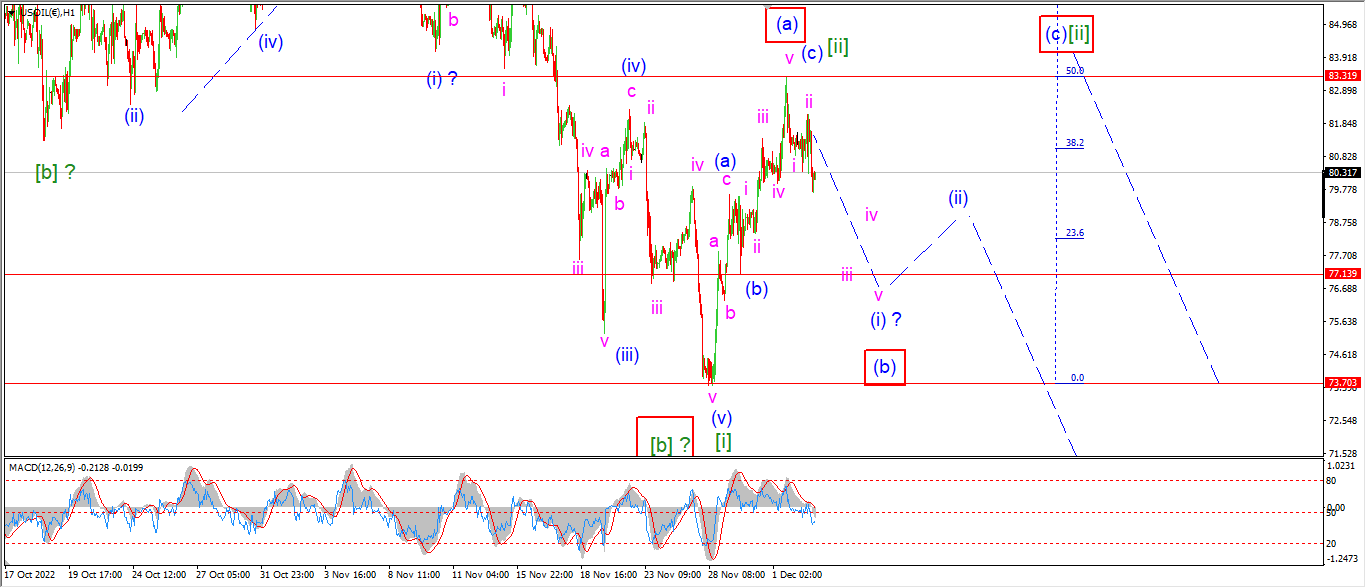
Three waves down off the wave [ii] high so far today.
This is a reasonable start to what could be wave (i) of [iii].
But there needs to be a follow through to the downside next week to confirm the idea of wave (i) now underway.
If we see a break of the wave (b) low at 77.14 again next week,
that will be a big boost to this bearish count in wave (i).
As for the alternate count;
The decline into wave (b) of [ii] should take at least all of next week.
and wave (b) will trace out three waves down overall.
So I cannot rule out this wave alternate count for wave [ii] for a while yet.
I think it is worth tracking this idea until it is proven invalid.
Monday;
Watch for wave (i) to trace out five waves down by the end of next week.
Wave [ii] must hold at this weeks high.
S&P 500.
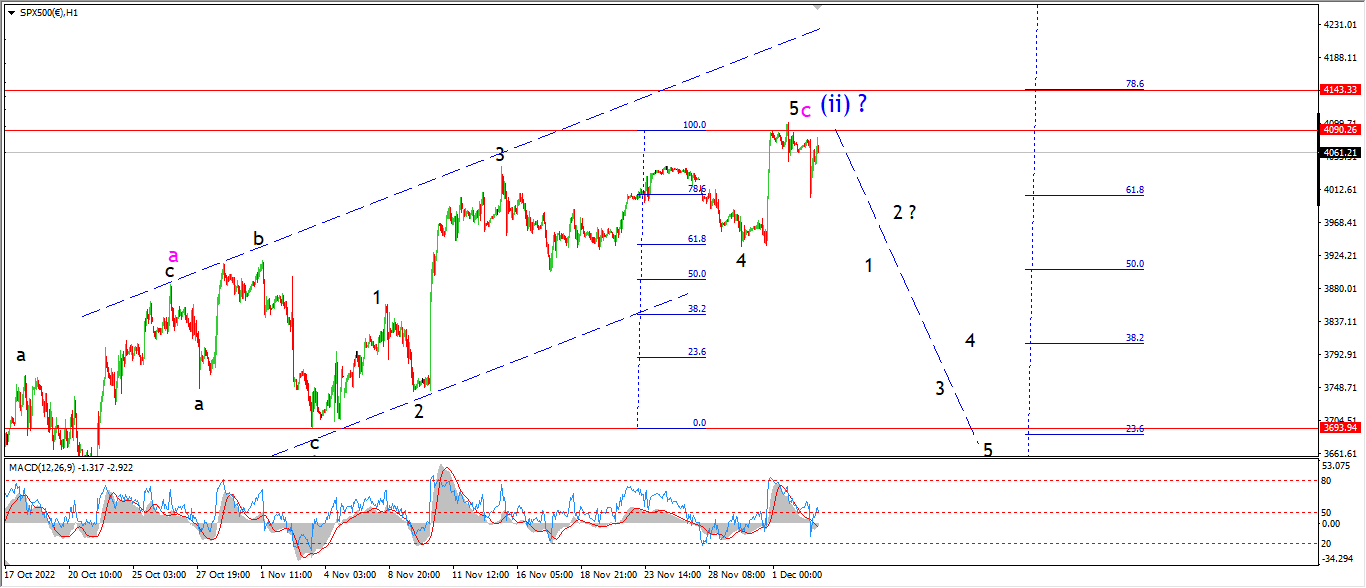
S&P 500 1hr
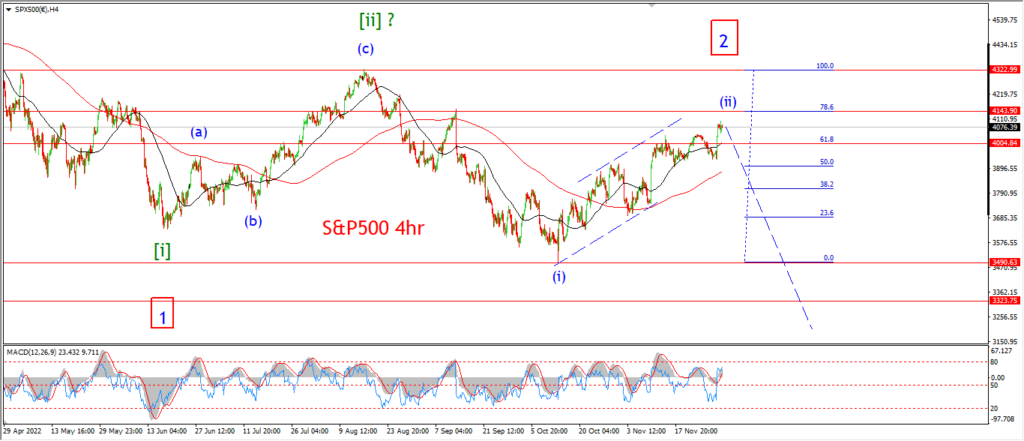
S&P 500 4hr
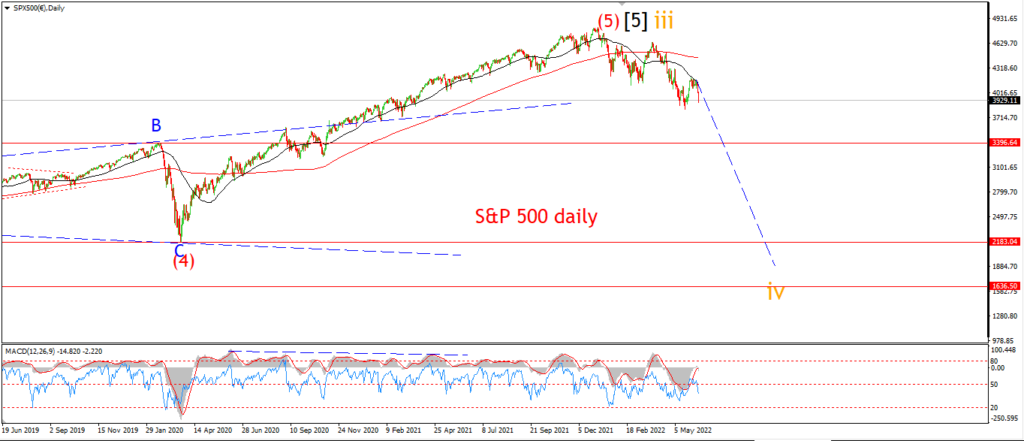
S&P 500 daily.
The market has been essentially flat over the last few sessions.
And we have seen an attempt today at breaking the rally again,
but this decline has been almost fully retraced this evening so I’m afraid the action has not revealed much to confirm my count.
I can add to the list of points in favor of the main count tonight though.
The rally we saw this week has brought wave ‘c’ to the equality level with wave ‘a’ at the highs.
you can see that the high this week was only slightly above the level where waves ‘a’ and ‘c’ equaled each other.
So we have completed pattern with equality ove waves and a bearish momentum divergence also.
I can only say that this is a perfect setup for a correction to complete and the next leg down to begin.
Monday;
The signals of an impending top will turn into that actual top sooner or later.
so next week remains open to a reversal pattern beginning.
Watch for wave ‘1’ of ‘i’ to begin with a retracement of this weeks rally.
SILVER.
SILVER 1hr
SILVER 4hr.
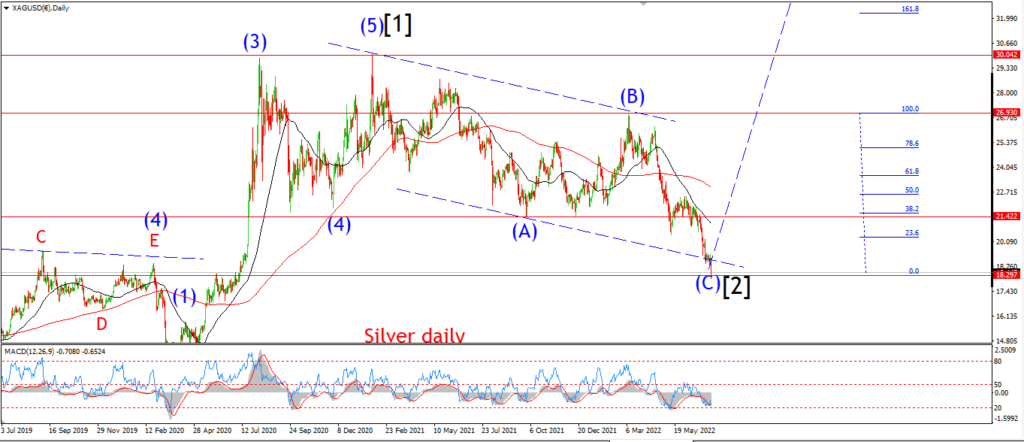
SILVER daily.
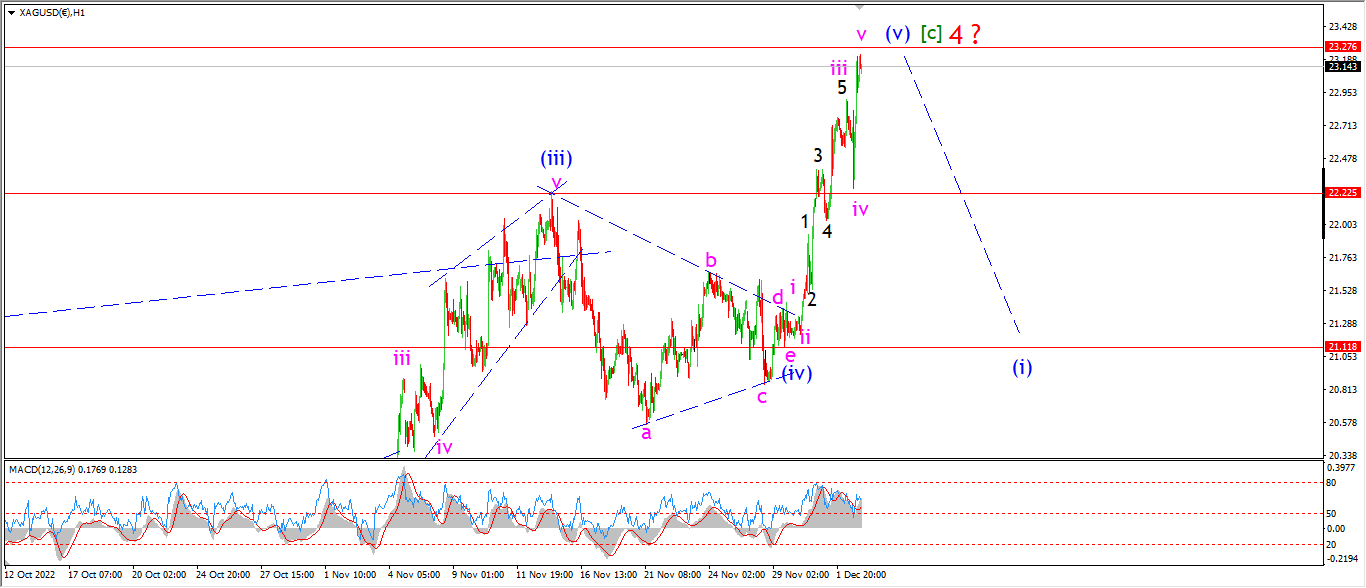
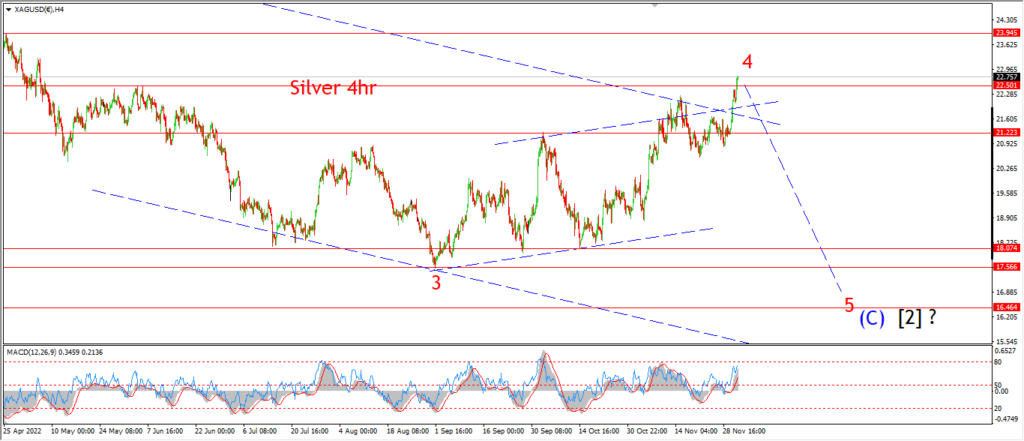
The trade today brought another sharp rally to break above the 23.00 level again.
While this may be sending the market into a panic thinking silver is about to launch to the moon,
I will again take the opposing view here,
it seems I am built to be an eternal contrarian against the wind of popular thought.
todays new high has completed an extended fifth wave in wave (v) blue.
Wave ‘iii’ of (v) has a perfect five wave internal pattern.
And wave [c] also has a perfect five wave pattern also.
The fact that the silver is rallying against the backdrop of collapsing inflation,
and a collapsing economy is notable,
but the added fact that silver is rallying along with the stock market is just an added hint that something is not what is seems here.
IF the stock market is going to continue its record matching run,
then silver will continue to rally.
But if the stock market turns like I think it will,
then silver will die on that hill too.
the slump in risk assets will kill the silver price too I’m afraid.
and that is where wave ‘5’ of (C) will come into play.
Monday;
Watch for wave this wave (v) rally to reverse in a big way next week.
the key level here is 21.11 at the wave (iv) low.
A break of that level will signal wave ‘5’ down is underway.
BITCOIN
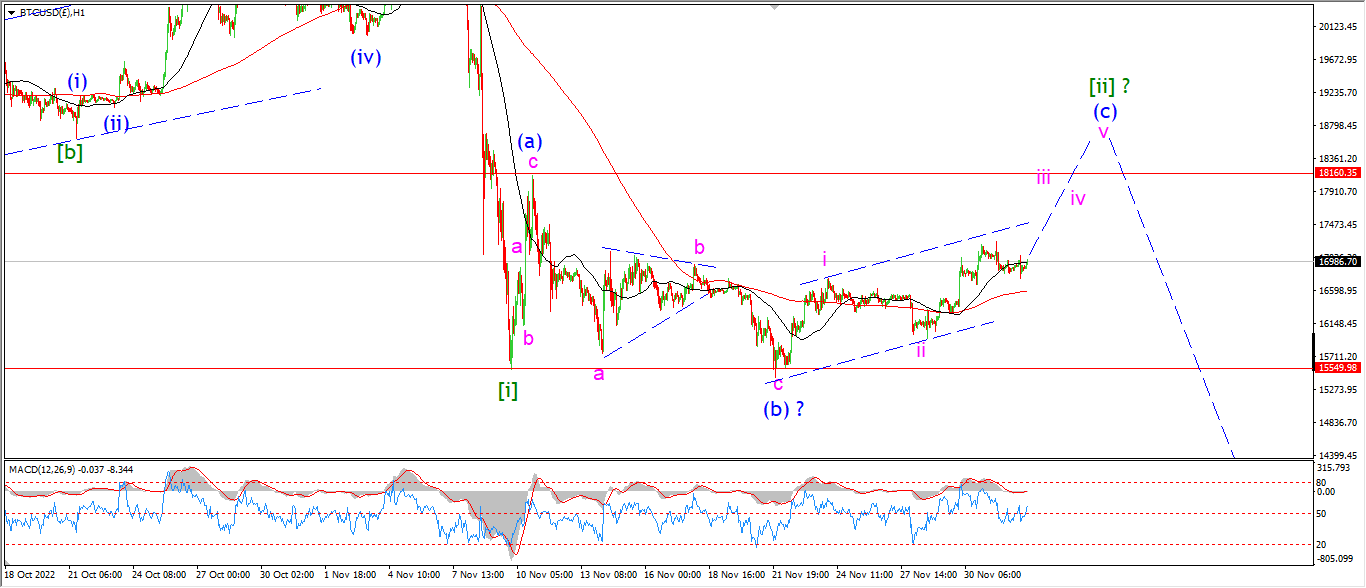
BITCOIN 1hr.
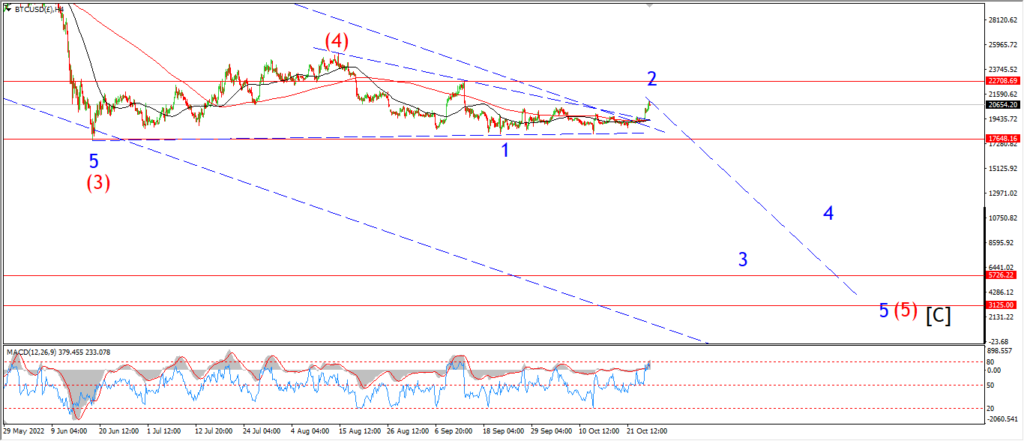
BITCOIN 4hr.

BITCOIN daily.
….
FTSE 100.
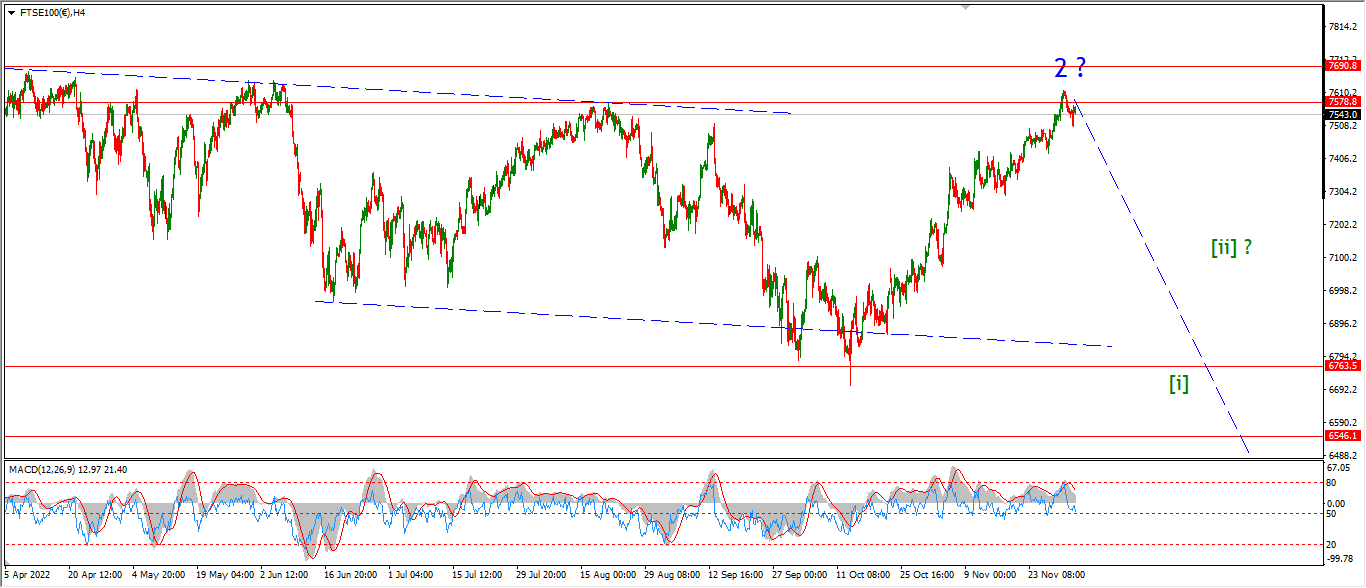
FTSE 100 1hr.
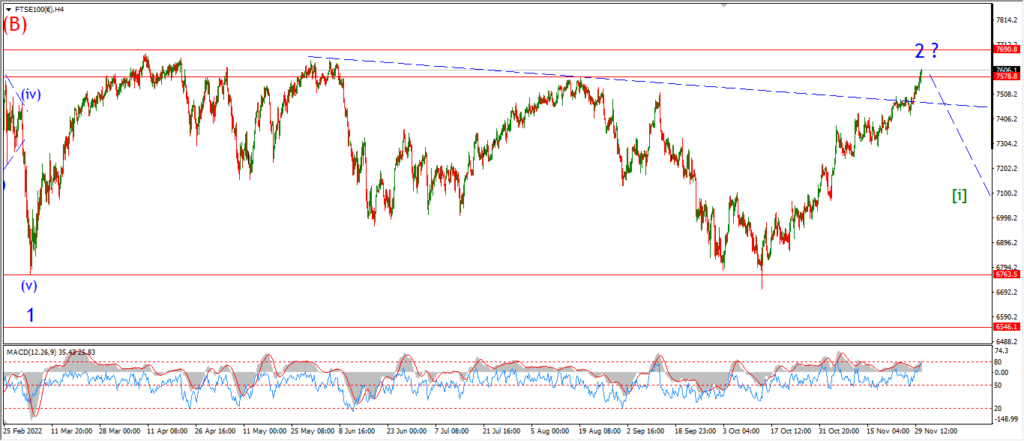
FTSE 100 4hr.

FTSE 100 daily.
….
DAX.
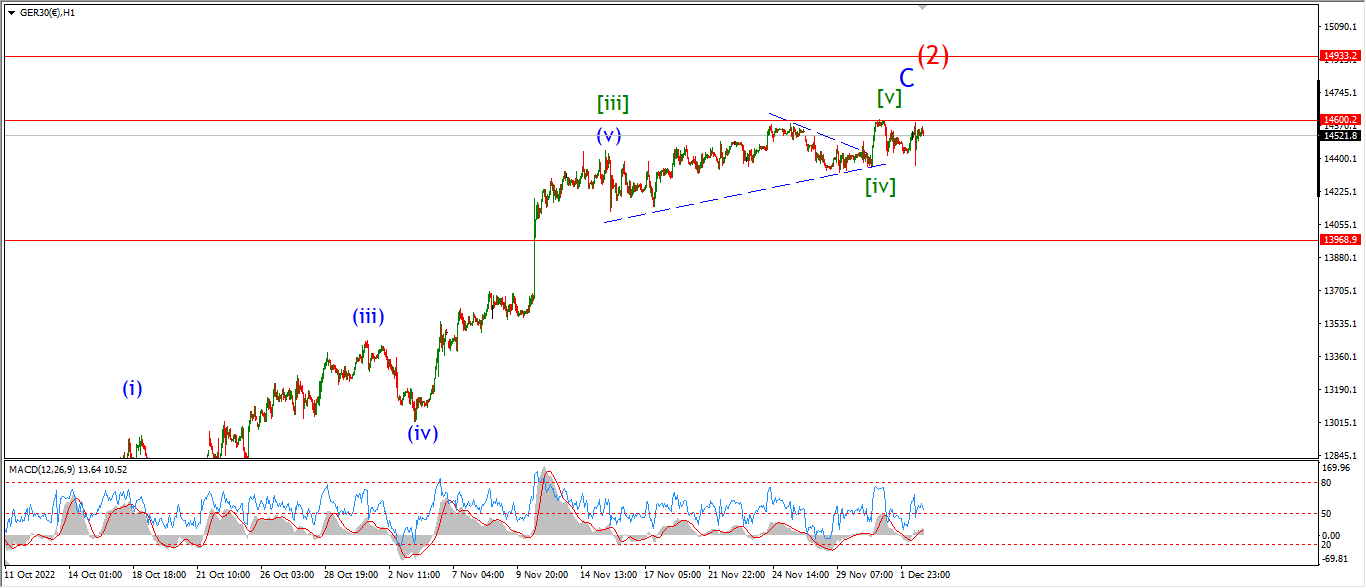
DAX 1hr
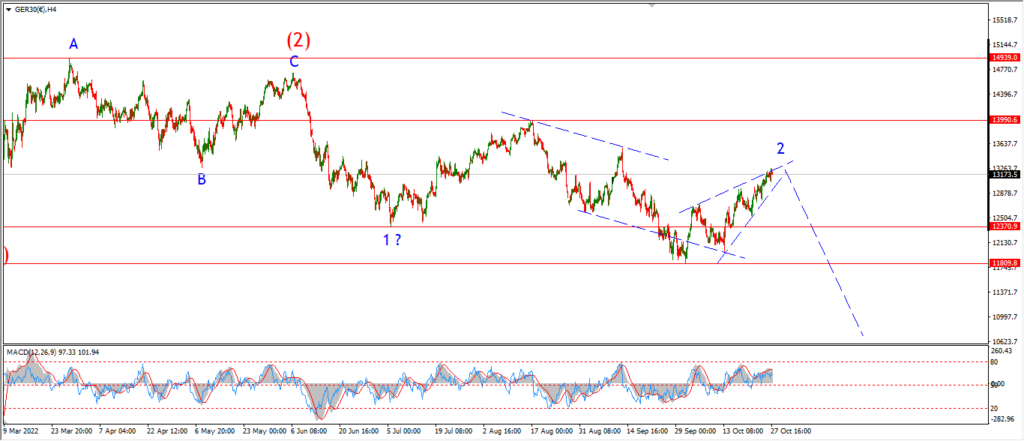
DAX 4hr

DAX daily.
….
NASDAQ 100.
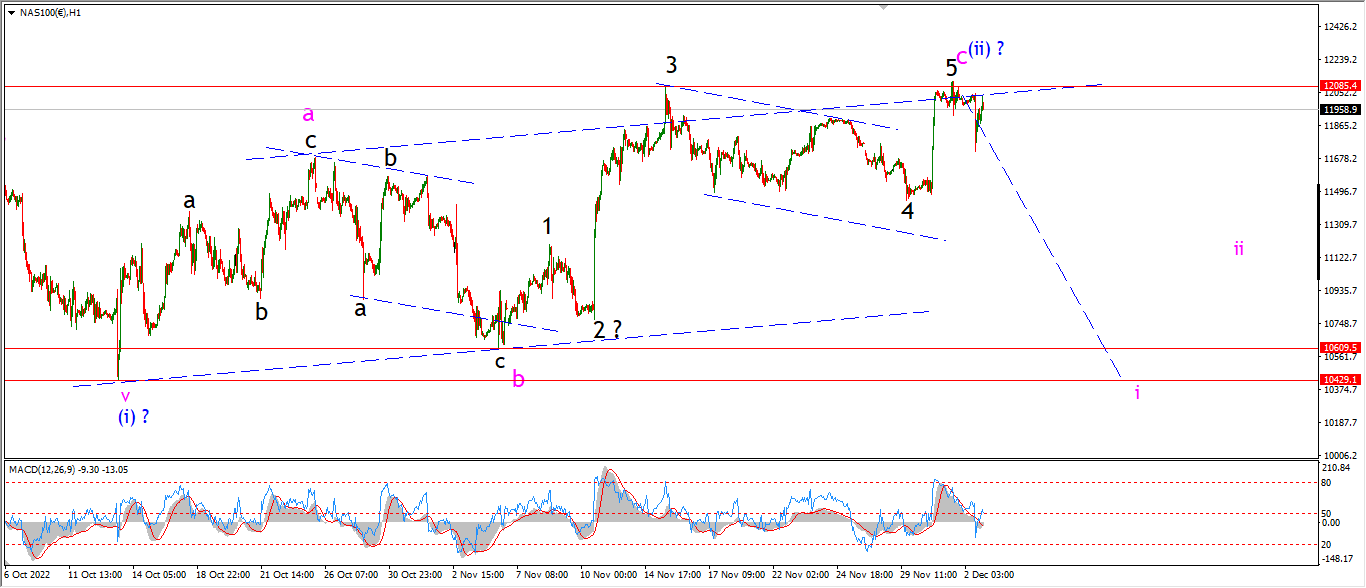
NASDAQ 1hr
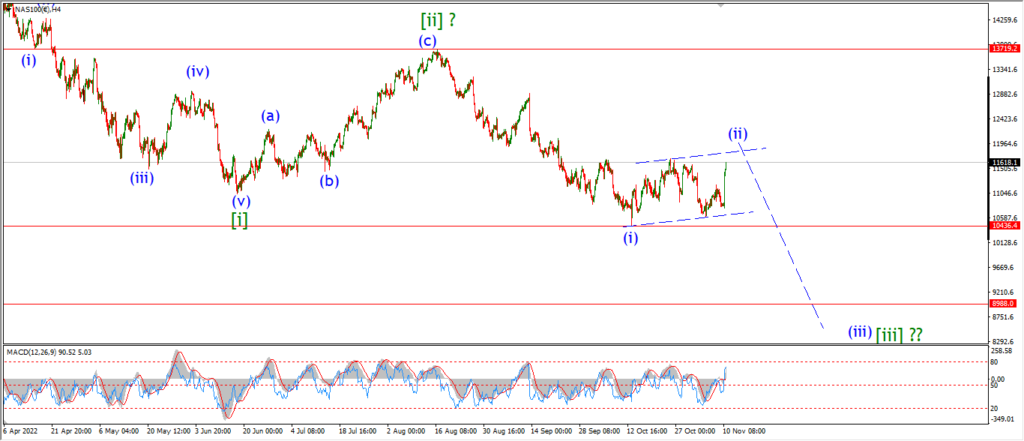
NASDAQ 4hr.

NASDAQ daily.
….