
Good evening to one and all.
The LORD’s blessings to you all tonight.
A few charts to start end the day for you, the clouds are gathering and a dark time is ahead of us this coming year.
Complete collapse in growth rate for M2 money supply … year/year pace now at weakest since May 1995


https://twitter.com/bullwavesreal
EURUSD.
EURUSD 1hr.
EURUSD 4hr.

EURUSD daily.
Well todays trade could not have followed the brief better to be honest!
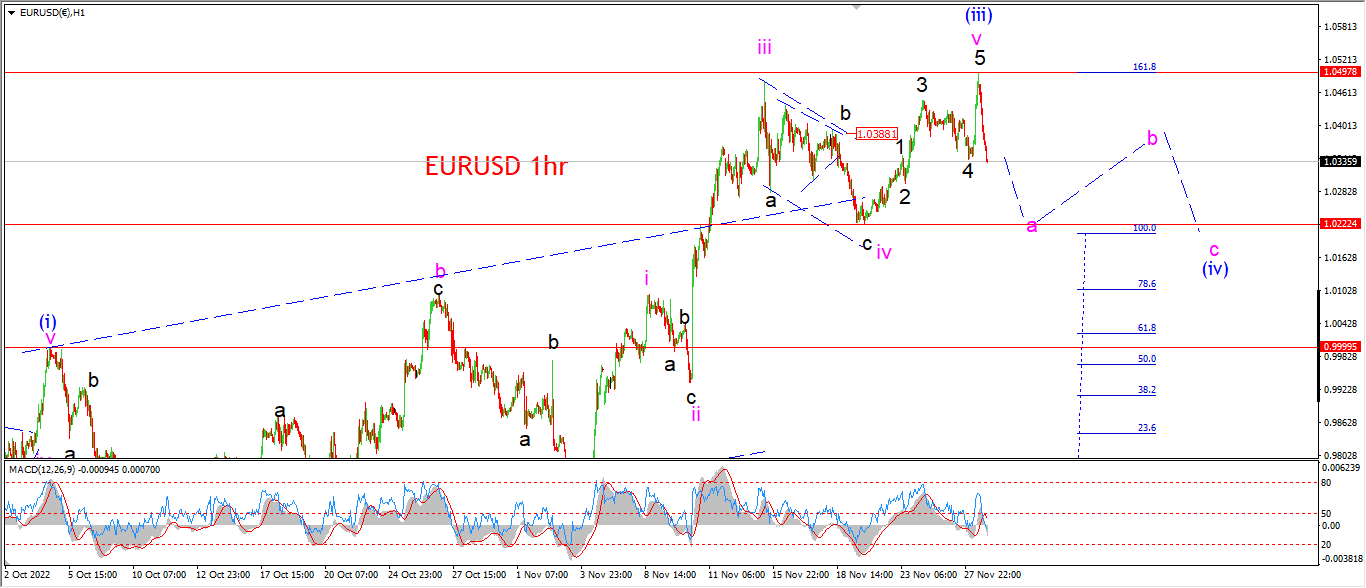
EURUSD rallied to a new high abvoe the wave (iii) high and stopped immeditaely at the 161.8% Fibonacci extension target at 1.0497.
And then the price reversed with a nice bang off that session high.
I am now looking at wave (iii) complete at todays highs,
and wave (iv) underway with that initial decline off the top.
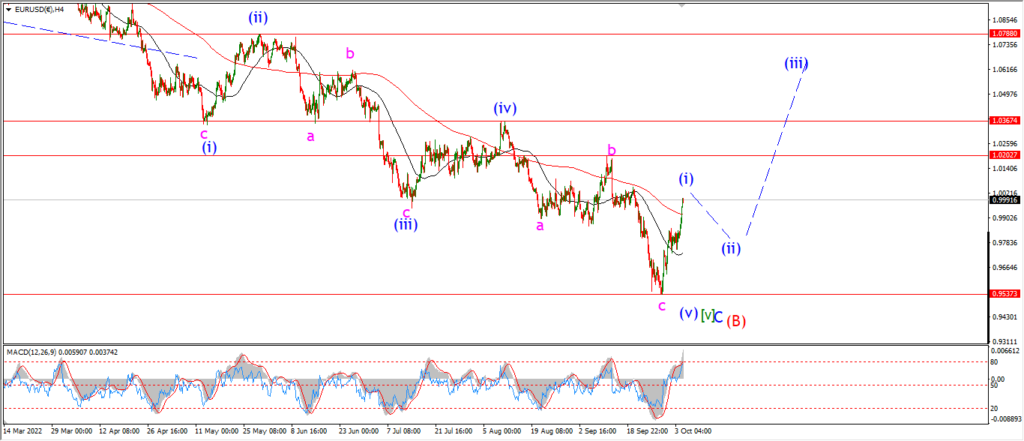
The correction in wave (ii) was long and drawn out,
and the guideline of alteration between corrective waves may come into play here.
so I suspect wave (iv) should be shorter with a simple internal structure.
tomorrow;
Watch for wave ‘a’ of (iv) to fall into the wave ‘iv’ low near 1.0222 again.
Wave (iv) must complete above the wave (i) high at 1.00 even.
A break of that level will invalidate this bullish count.
GBPUSD
GBPUSD 1hr.
GBPUSD 4hr.

GBPUSD daily.
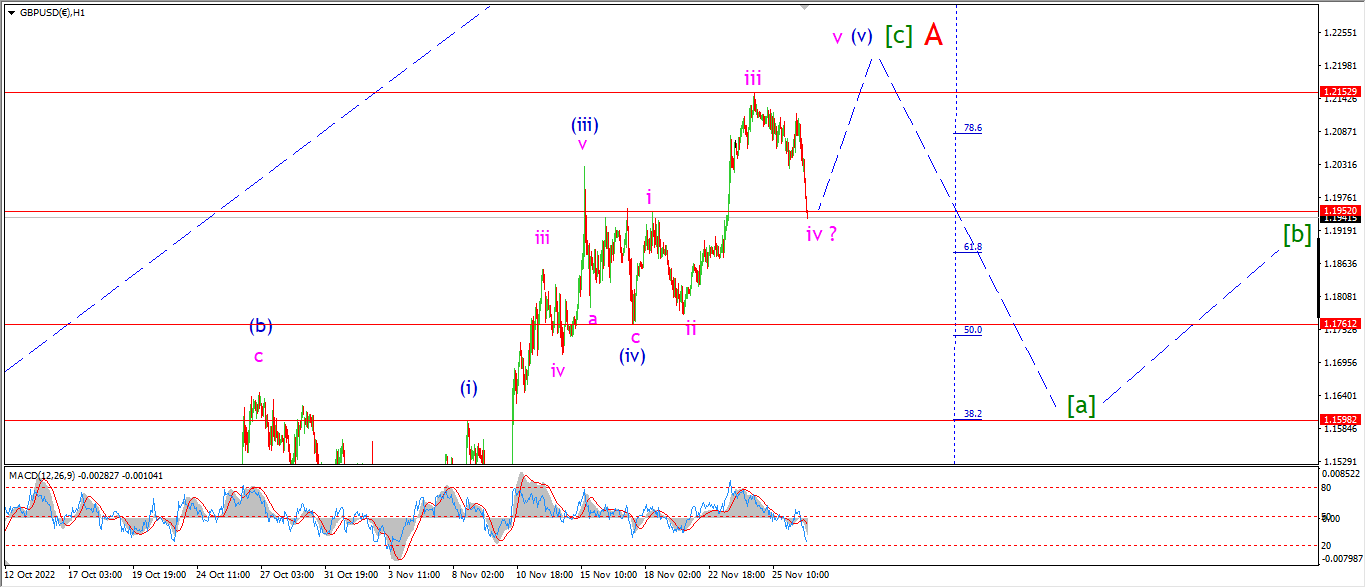
The decline in wave ‘iv’ broke the wave ‘i’ high this evening,
so we are on the verge of invalidating this short term count for wave (v) blue.
Right now the action is hinting that the top is in for wave ‘A’ and wave ‘B’ is now underway.
We will have to wait and see how this goes,
there is still a small chance that wave ‘v’ can turn higher and compelte a wedge in wave (v) blue.
If the price does break of the wave (iv) low at 1.1761 again will confirm wave [a] of ‘B’ is underway.
And then I can concentrate on wave [a] down.
Tomorrow;
I won’t discard the main count just yet.
The decline so far is only in three waves.
So this can still be counted as a five wave wedge in wave (v) blue.
With wave ‘v’ of (v) left to make a new high.
Watch for wave ‘v’ of (v) to turn higher from here and complete wave (v) blue as suggested.
If the price holds below 1.1950 tomorrow that will favor the idea of a top in place now for wave ‘A’.
USDJPY.
USDJPY 1hr.
USDJPY 4hr.

USDJPY daily.
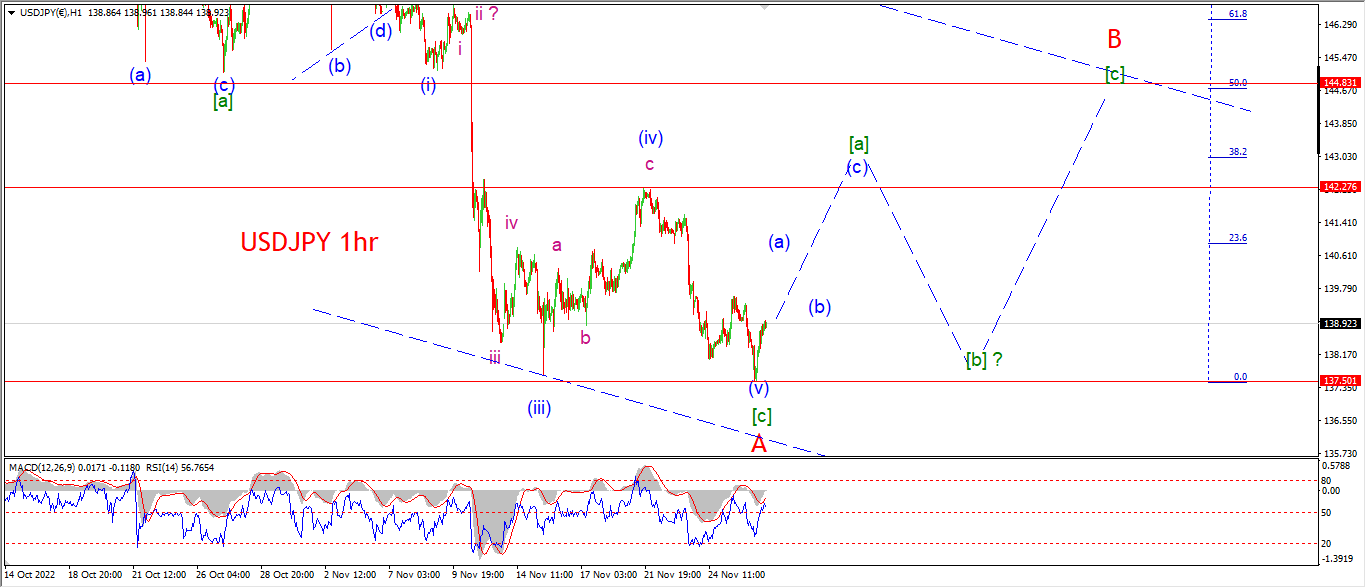
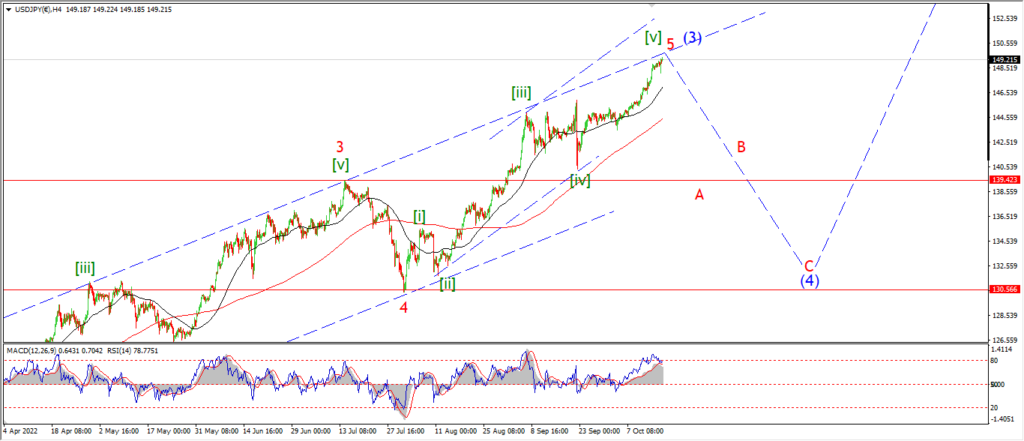
The action in USDJPY today has forced me to rethink the pattern for wve ‘A’ down.
I have now shown a larger five wave pattern in wave [c] of ‘A’.
The count still suggests a correction higher in wave ‘B’ is coming our way this week.
But that correction is only now beginning.
Wave [a] of ‘B’ should run higher to hit the wave (iv) high at 142.27.
Wave [a] can take a three or five wave internal form,
it all depends on the overall pattern in wave ‘B’.
And the initial target for wave ‘B’ lies at the 50% retracement level of wave ‘A’ near 144.80.
Tomorrow;
Watch for wave ‘A’ to hold at 137.50.
Wave [a] should trace out three waves up at least over the coming days.
DOW JONES.
DOW 1hr.
DOW 4hr
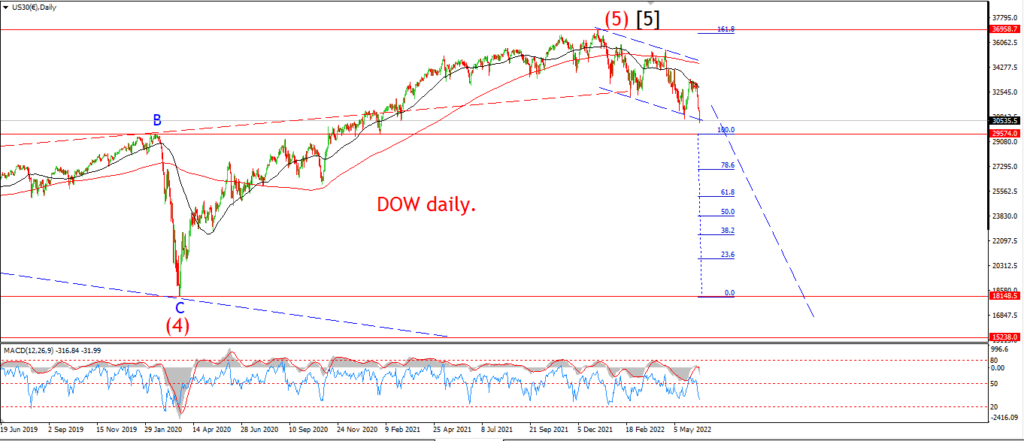
DOW daily.
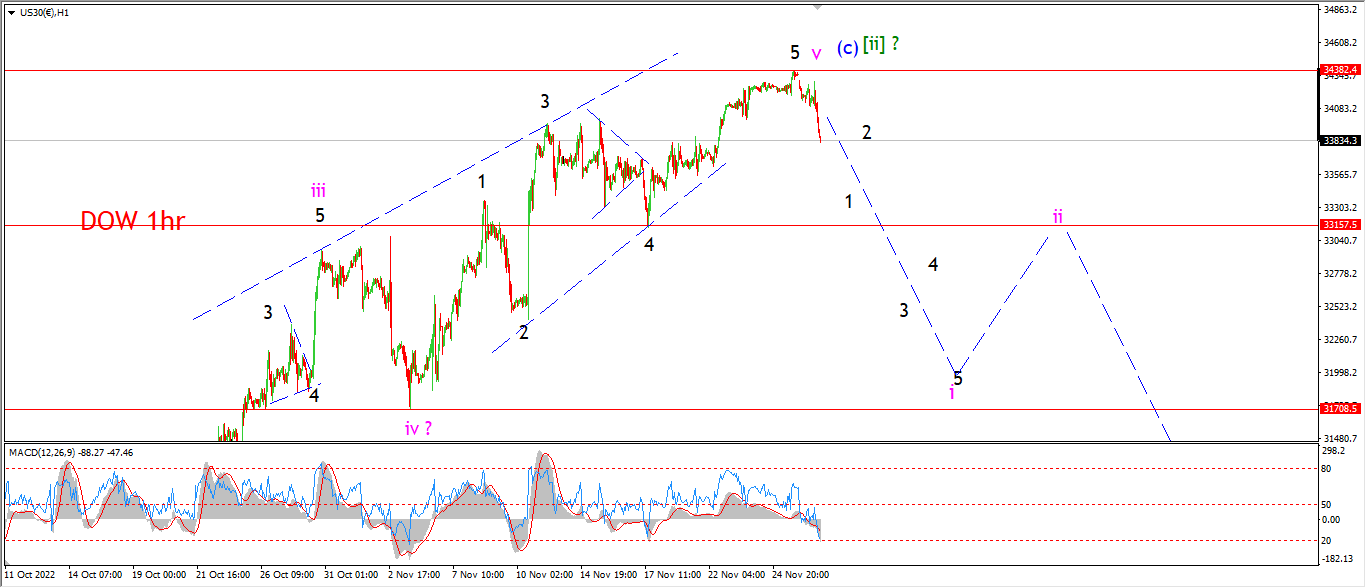
We have something to work with at least tonight after a small reversal off the top of last weeks rally.
There is no confirmation of a top in place for wave [ii] at last weeks high,
but I am willing to look at the possibility at least.
The initial target for a reversal pattern to hit is the wave ‘4’ low at 33150.
A break of that low will raise the probability of a top significantly.
And a five wave decline to break that support sill go one step further again!
So todays decline is welcome,
but it is not enough to get excited about just yet.
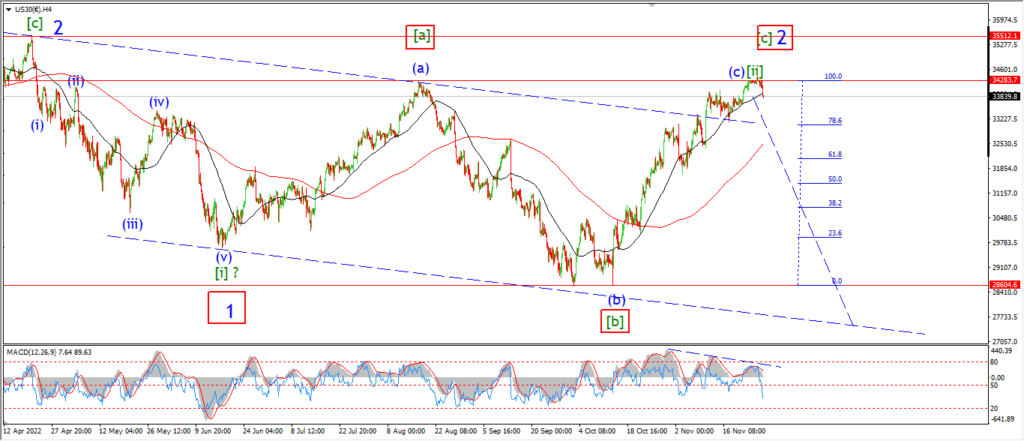
The momentum oicture on the 4hr chart just gets worse from day to day now,
and the RSI has gone negative with a cresting MACD line now also.
So the 4hr chart is pointing to a reversal on the cards.
Tomorrow;
Watch for wave ‘1’ of ‘i’ to trace out five waves down and break the wave ‘4’ low at 33150.
After that we can begin to get serious about the next waves down.
GOLD
GOLD 1hr.
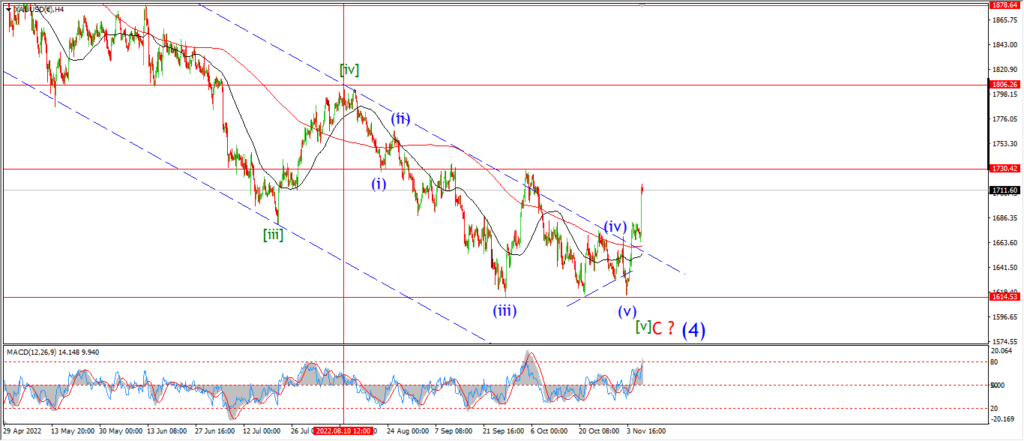
GOLD 4hr.

GOLD daily.
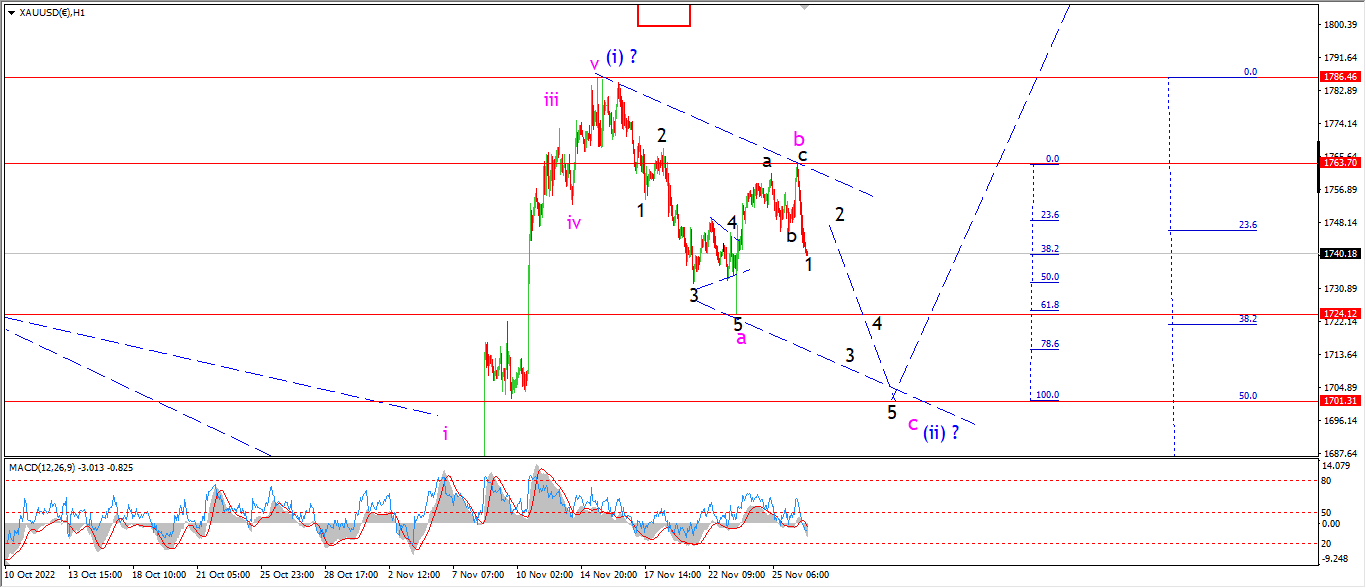
Todays action has also changed the hourly count in gold.
I have now shown a five wave decline into wave ‘a’ at the 1724 lows of last week.
And a three wave rally into the high today in wave ‘b’.
The action now suggests a zigzag correction lower in wave (ii) this week.
And this pattern calls for a five wave decline into wave ‘c’ of (ii).
I have labelled todays decline as wave ‘1’ of ‘c’ of (i).
The minimum target for wave ‘c’ lies at 1724 again.
If wave ‘c’ equals the size of wave ‘a’,
then we could see a low for wave ‘c’ of (ii) closer to 1700 again.
Tomorrow;
Watch for a five wave decline in wave ‘c’ to continue throughout this week,
with a minimum target at 1724.
CRUDE OIL.
CRUDE OIL 1hr.
CRUDE OIL 4hr.
CRUDE OIL daily.
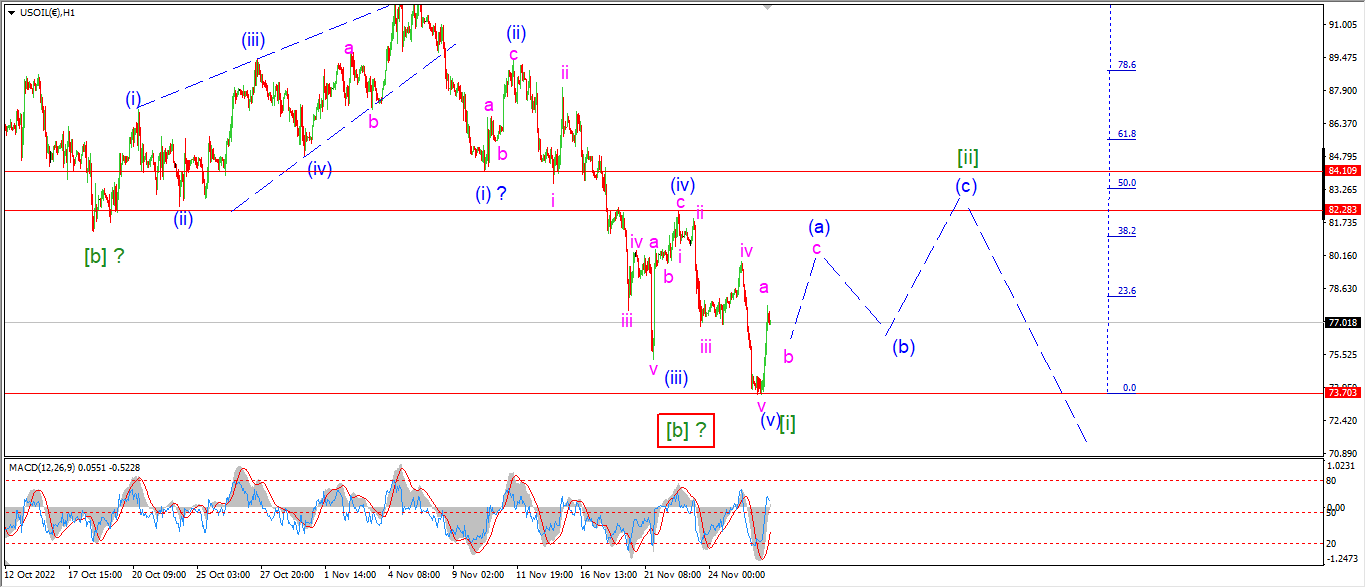
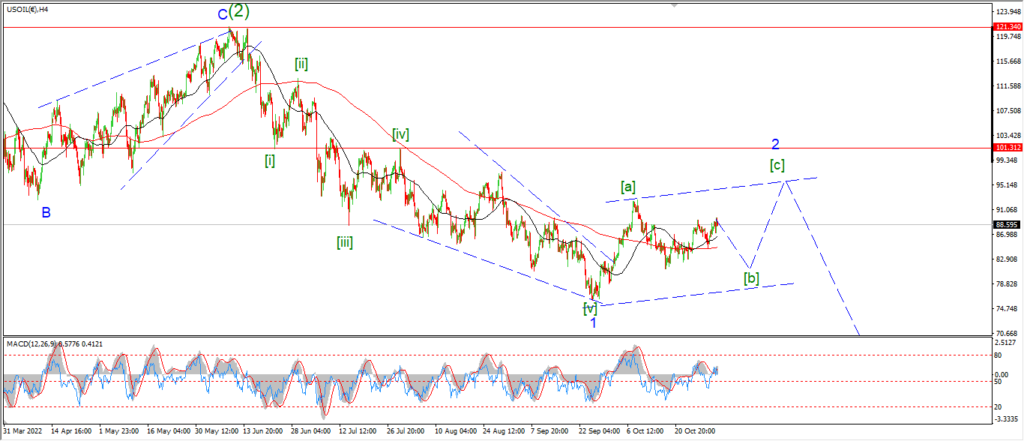
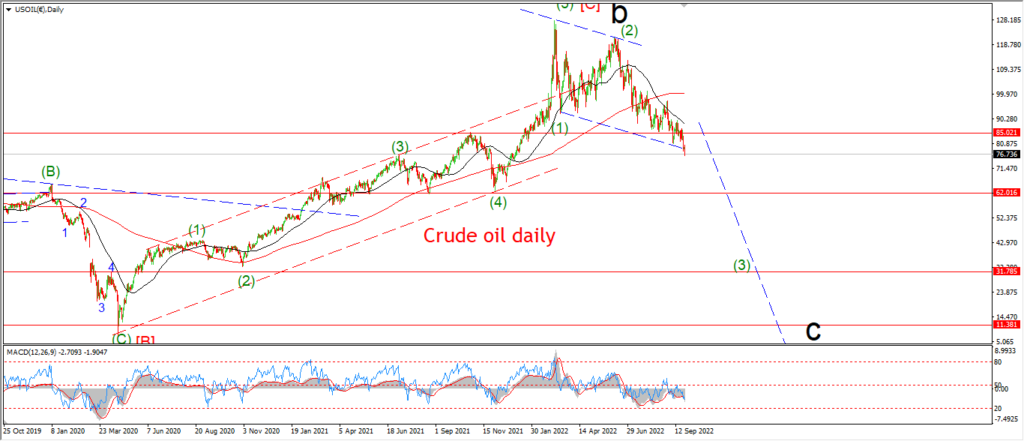
Crude completed wave (v) of [i] down at todays lows with a break of the previous wave (iii) low from last week.
And once that pattern was complete,
the price turned higher to begin wave [ii].
Wave (a) of [ii] is now underway after that rally,
and we should see at least three waves up in wave (a) over the next few days.
It should take at least a week to complete wave [ii] green.
And I am looking at a target near 84.00 again to complete wave [ii].
Tomorrow;
Watch for wave (a) to trace out three waves up and top out above 80.00 again.
S&P 500.
S&P 500 1hr
S&P 500 4hr
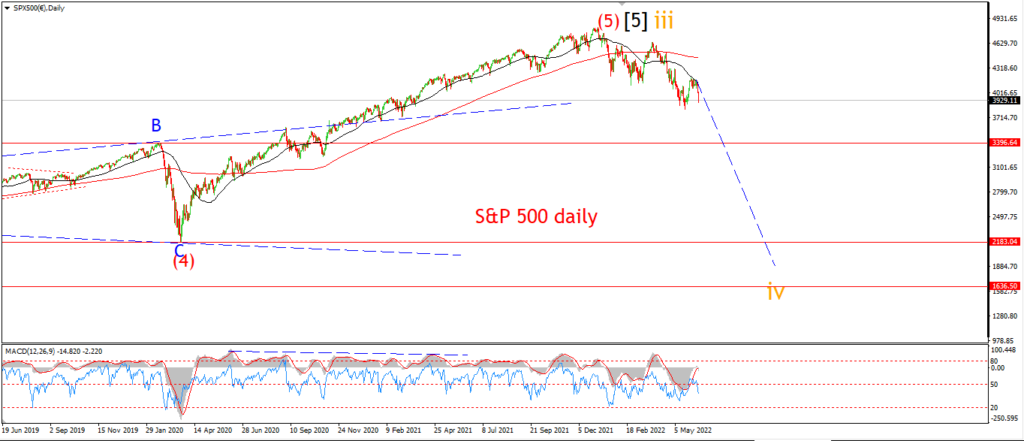
S&P 500 daily.
Much like the pattern in the Dow tonight,
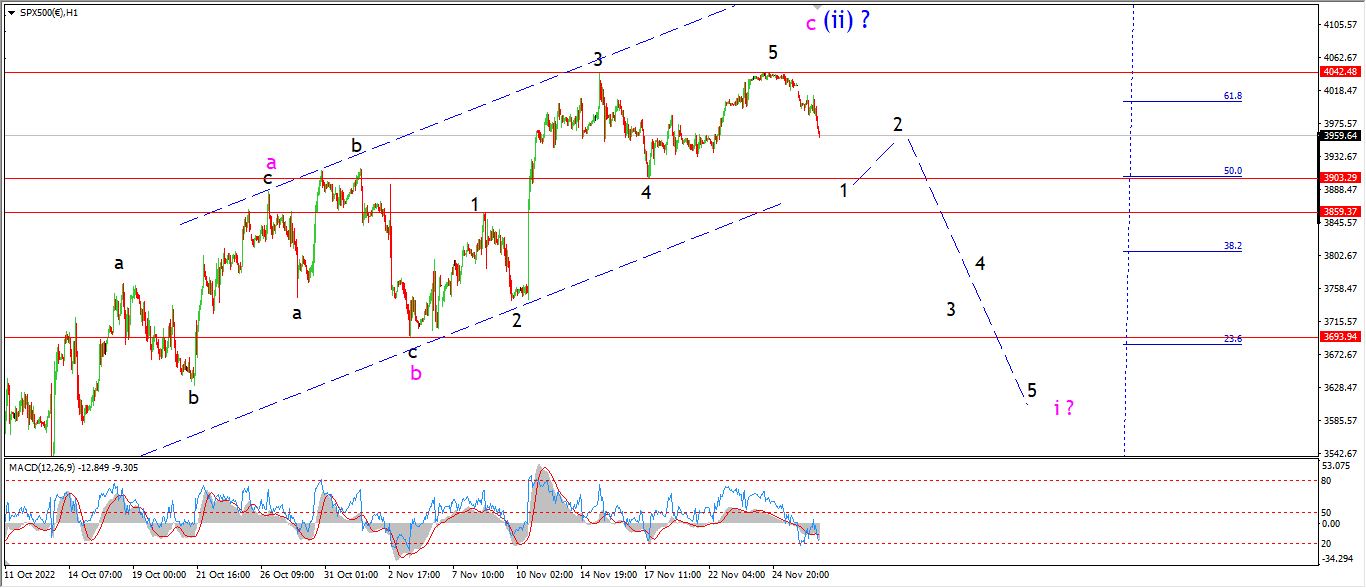
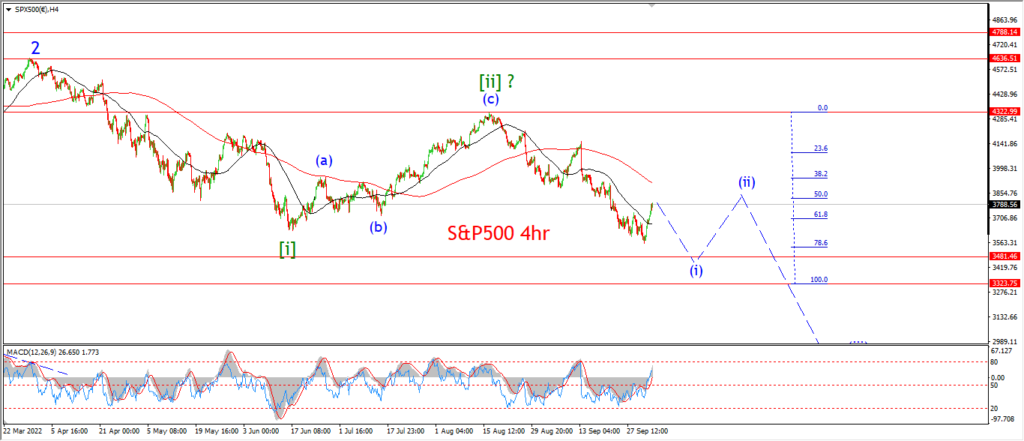
the decline today is a good start, but not enough to confirm a top in place at all yet.
I am looking for a drop back below the wave ‘4’ low at a minimum to boost the potential of this reversal pattern.
There is a support zone from 3860 to 3904 between waves ‘1’ and ‘4’ of the previous rally.
A break below this zone in five waves will really help out this pattern.
Tomorrow;
Watch for wave ‘1’ of ‘i’ to fall in five waves to break that support zone.
And once that happens we can then look lower into wave ‘i’ pink for the rest of the week.
SILVER.
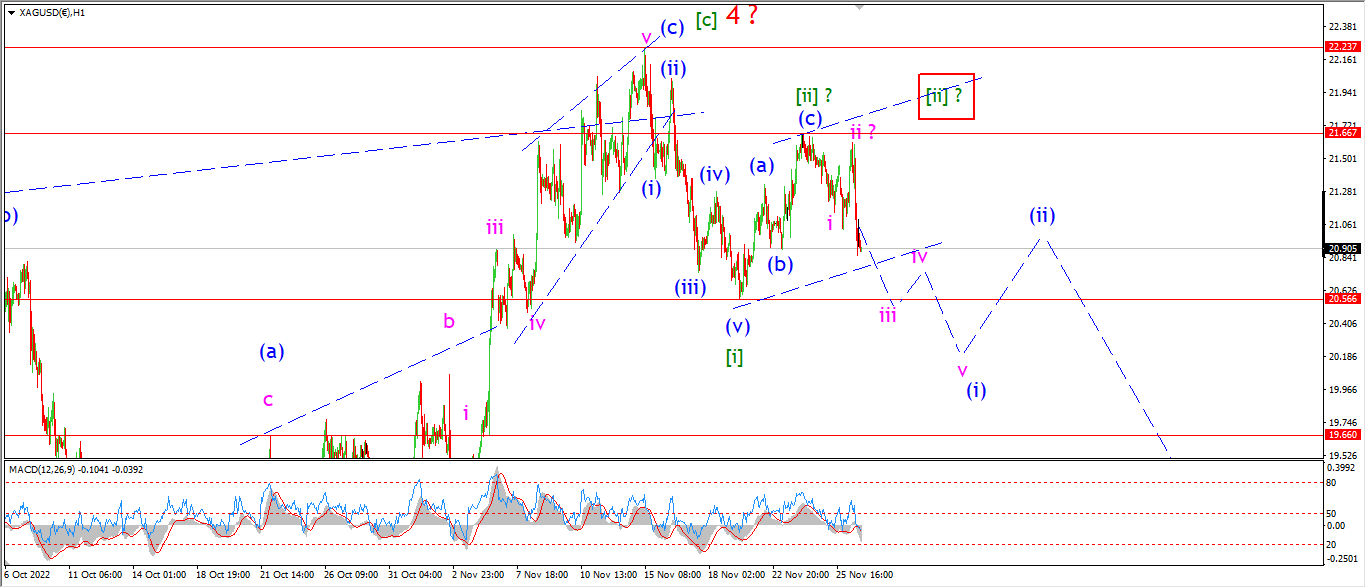
SILVER 1hr
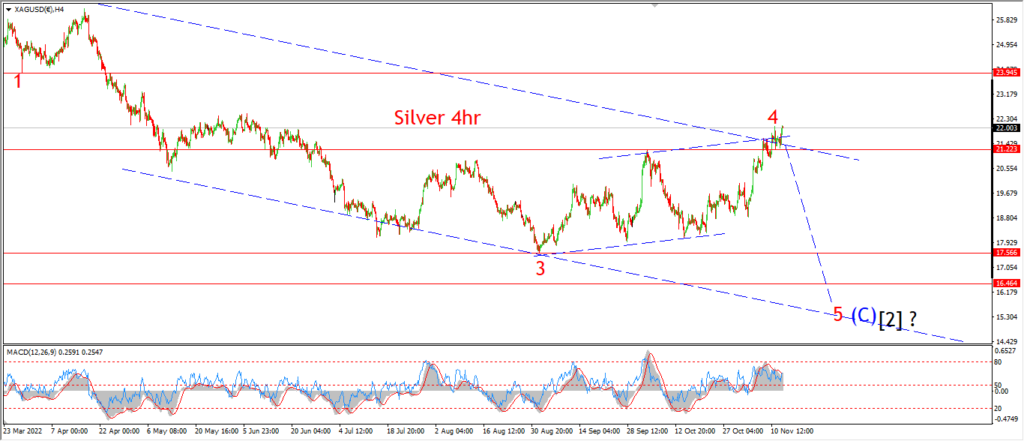
SILVER 4hr.
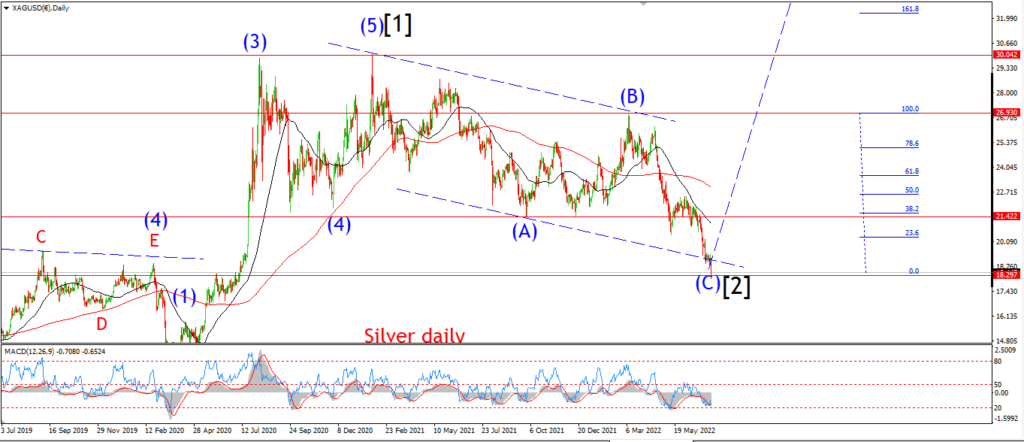
SILVER daily.
A sharp drop in silver today has traced out three waves down off the wave [ii] high today.
While this decline is in line with the main count for wave (i) of [iii] down.
We definitely need to see a break of the wave [i] low at 20.56 again to raise the probability of the main count.
If the price holds above 20.56 again this week,
and this three wave decline off wave [ii] also holds,
then I will switch to that alternate count for wave [ii] showning a larger three wave correction.
Tomorrow;
Watch for wave (i) to continue lower in five waves and break the wave [i] low at 20.56.
BITCOIN
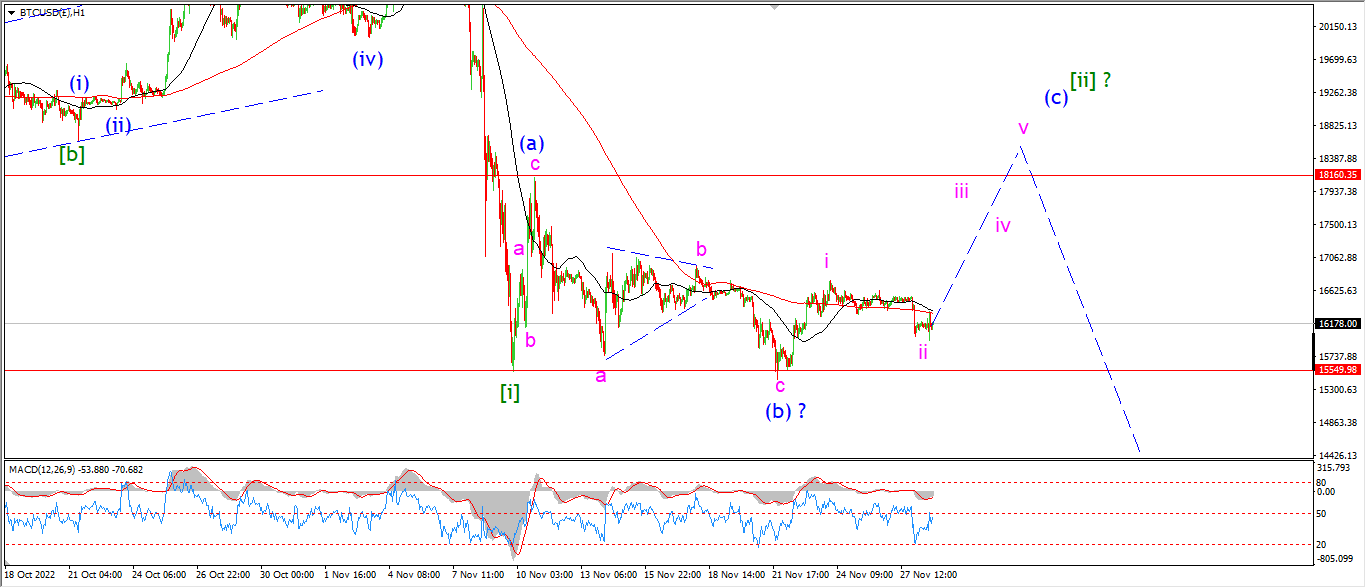
BITCOIN 1hr.
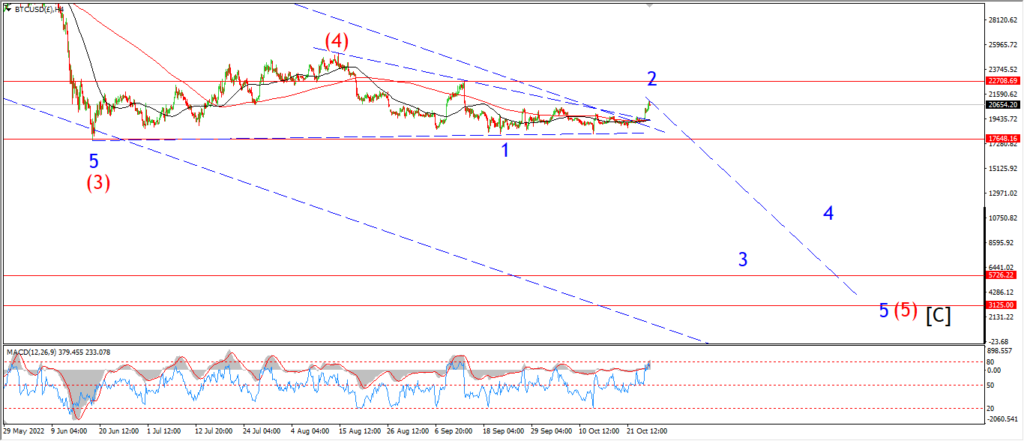
BITCOIN 4hr.

BITCOIN daily.
….
FTSE 100.
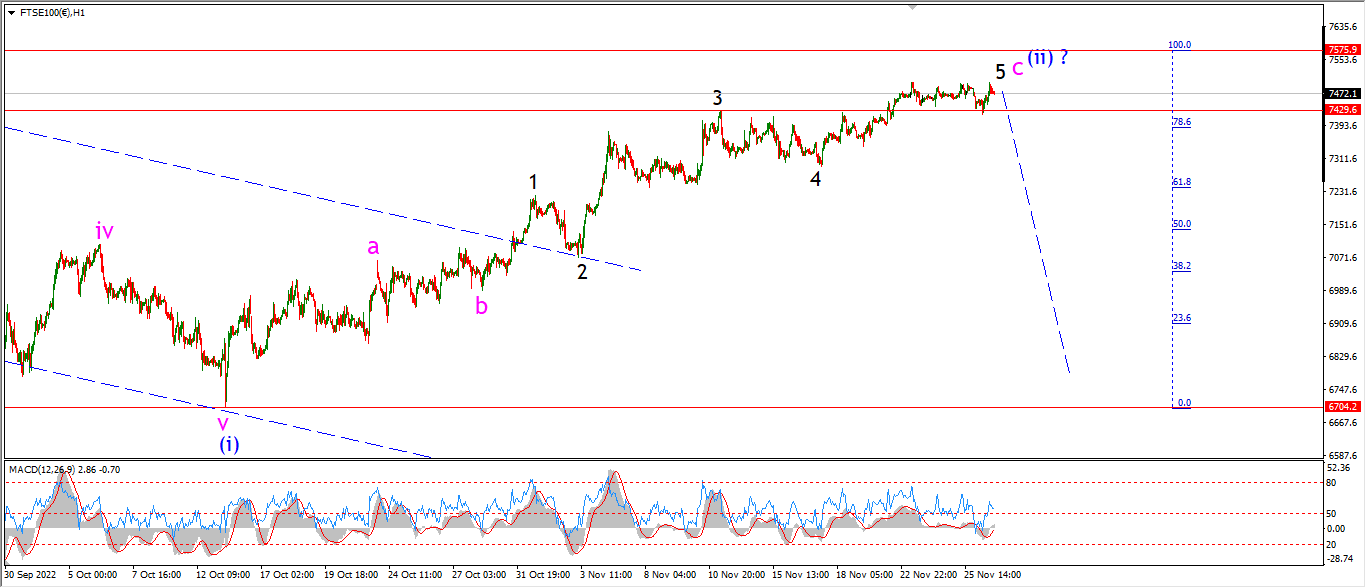
FTSE 100 1hr.
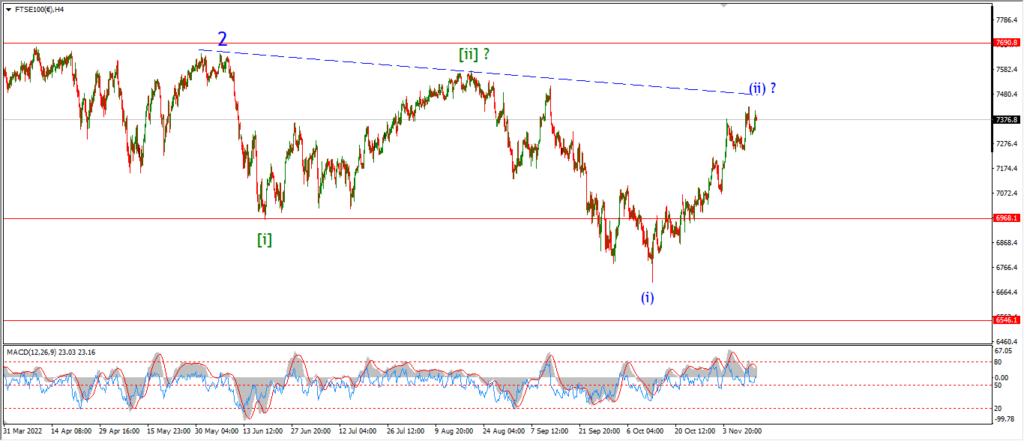
FTSE 100 4hr.

FTSE 100 daily.
….
DAX.
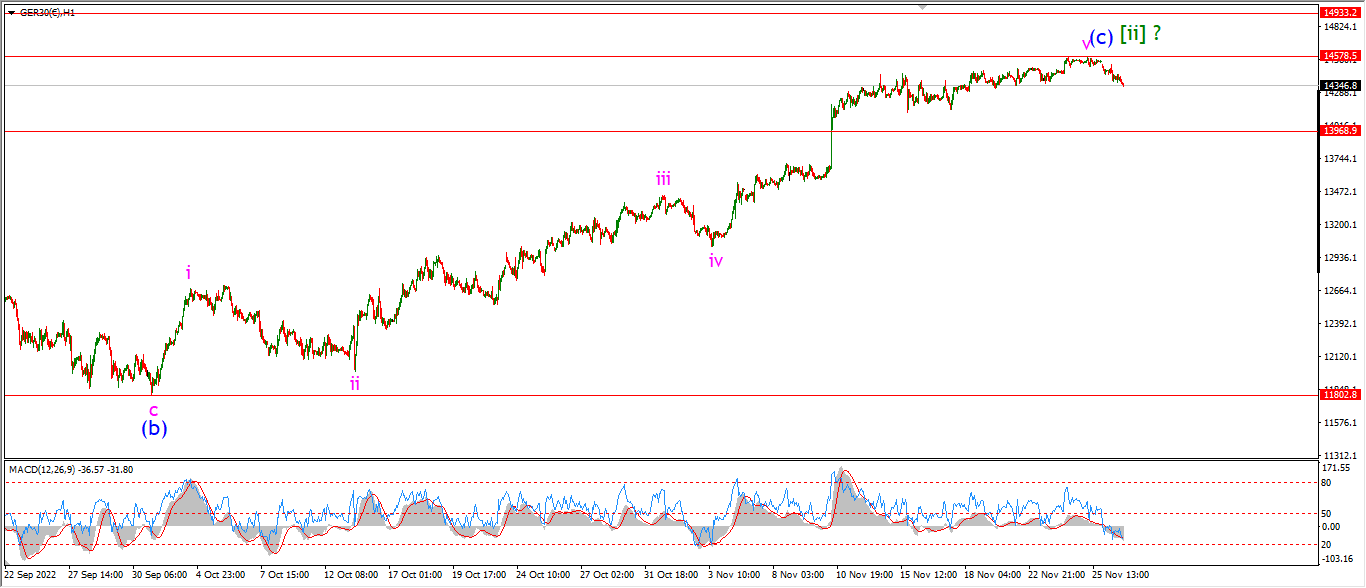
DAX 1hr
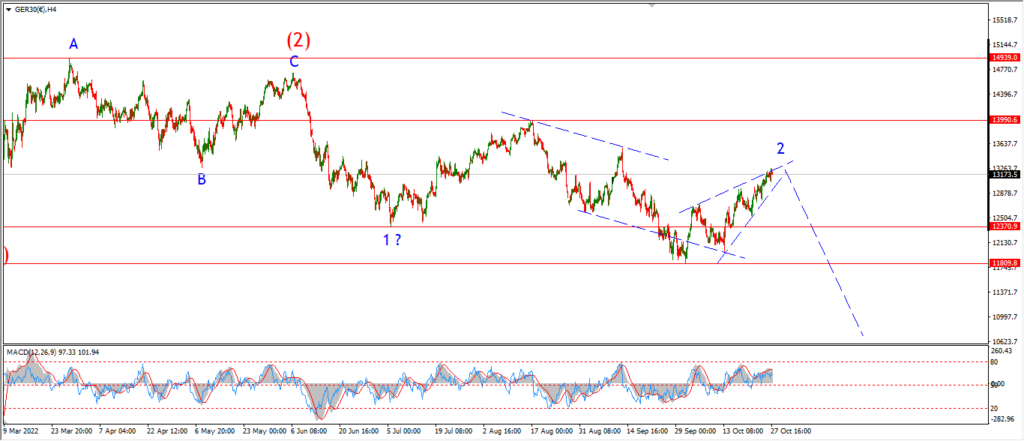
DAX 4hr

DAX daily.
….
NASDAQ 100.
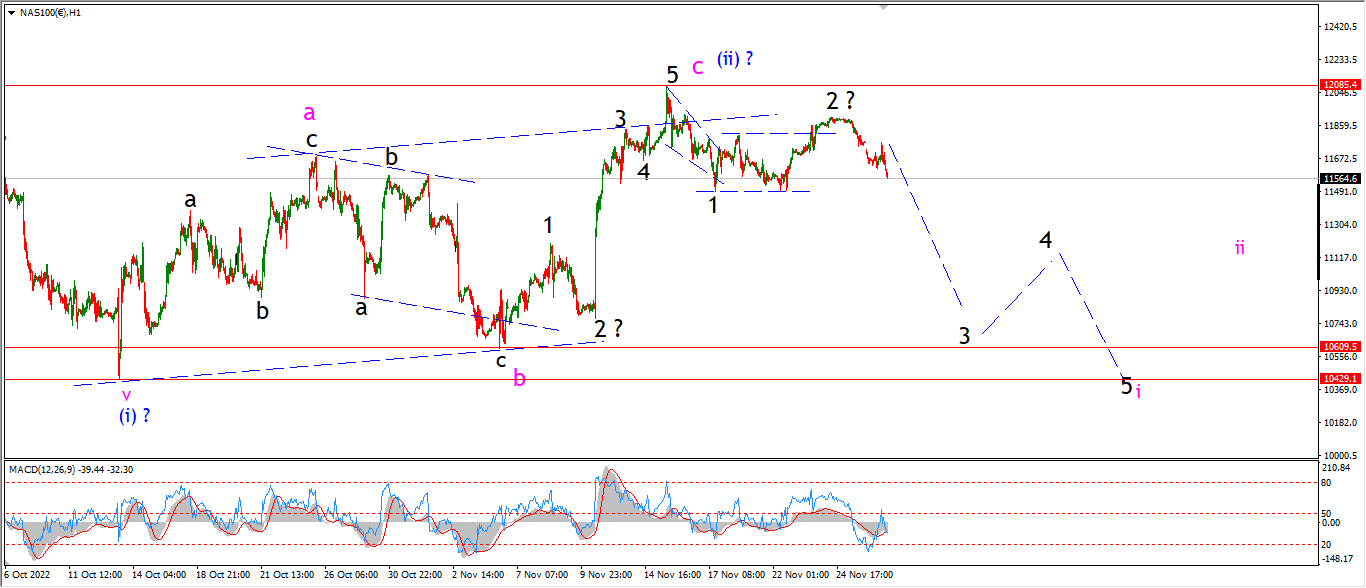
NASDAQ 1hr
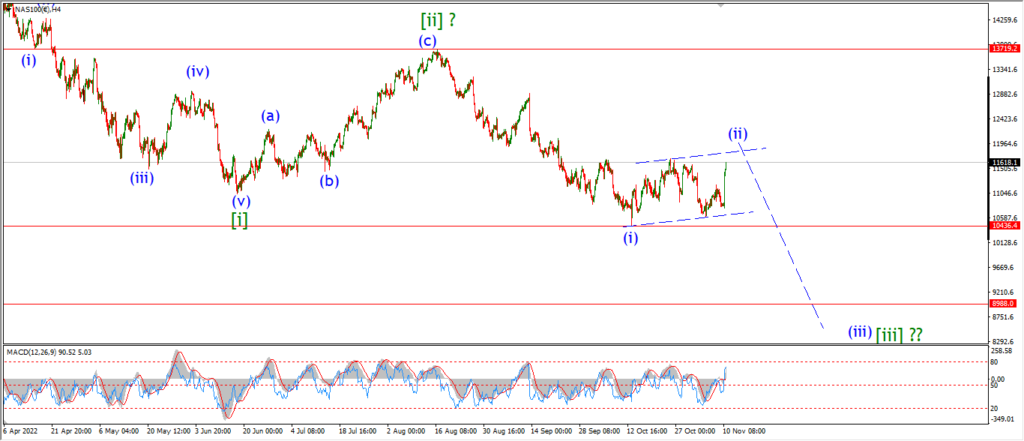
NASDAQ 4hr.

NASDAQ daily.
….