
Good evening to you folks, and the Lord’s blessings to you all tonight.
funny story,
I have been ill all weekend with the bloody covid bug again! my wife got it last week, probably picked it up in the hospital she works in, then it jumped onto me.
It really knocked me for 6 yesterday, I am feeling better today thank the Lord!
But I gotta say, I do sympathize with any elderly person that gets this thing, it could really do damage for sure!
Ok, enough of the sob stories, on with the show.
EURUSD.
EURUSD 1hr.
EURUSD 4hr.

EURUSD daily.
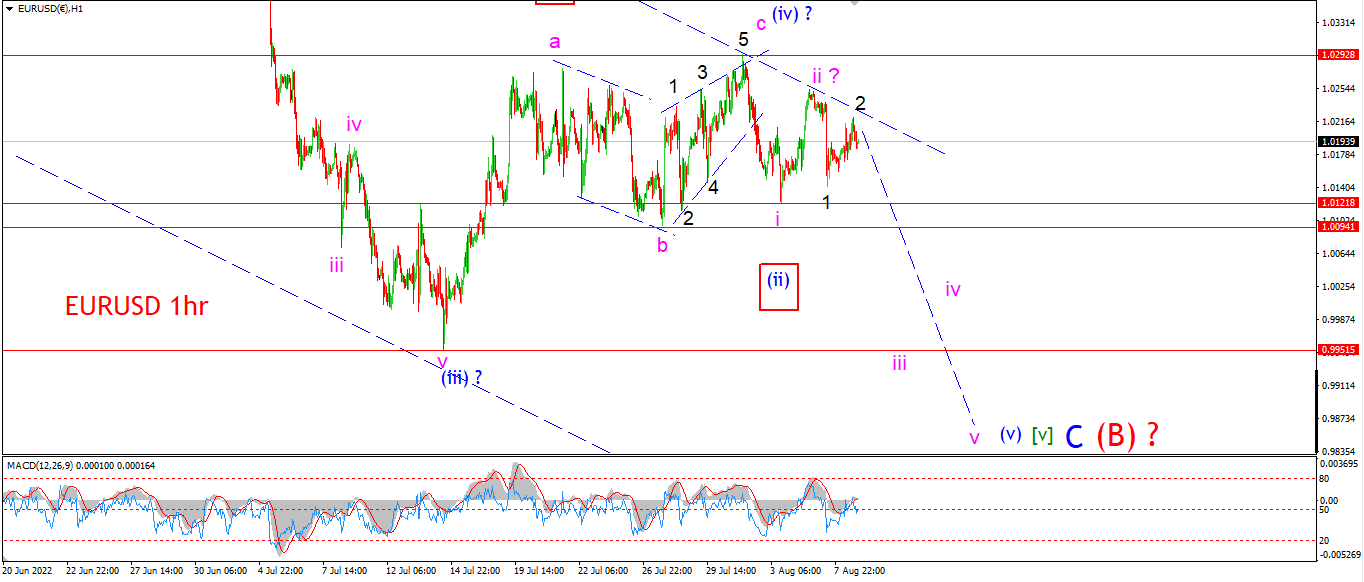
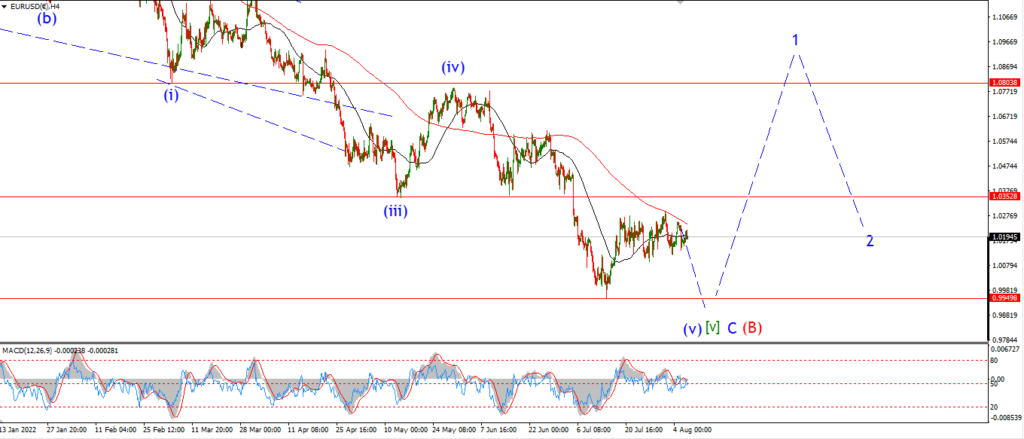
The action in EURUSD continues to have a slight downside bias today without giving away the overall pattern just yet.
I am happy to label todays action as an upside correction in wave ‘2’.
And this suggests wave ‘iii’ of (v) should turn lower again tomorrow.
The alternate bullish count is not ruled out yet.
But a break below 10121 will invalidate that (i) (ii) idea.
Tomorrow;
The key to this pattern will be a break of 1.0094.
That will confirm wave ‘iii’ of (v) is underway.
GBPUSD
GBPUSD 1hr.
GBPUSD 4hr.

GBPUSD daily.
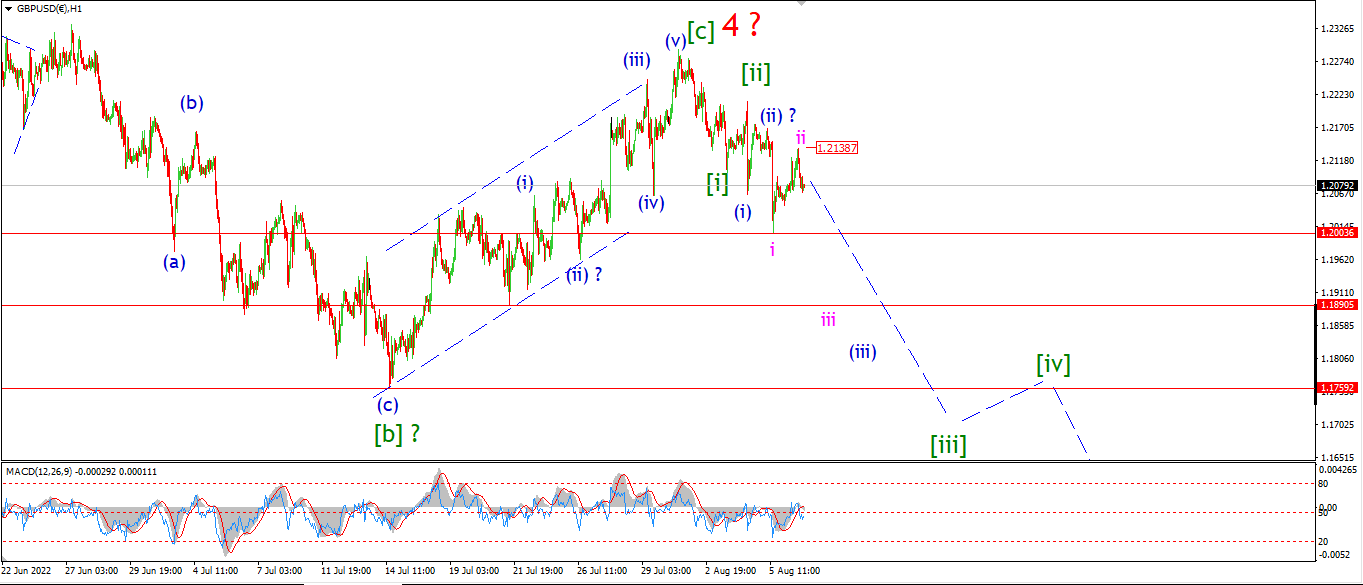
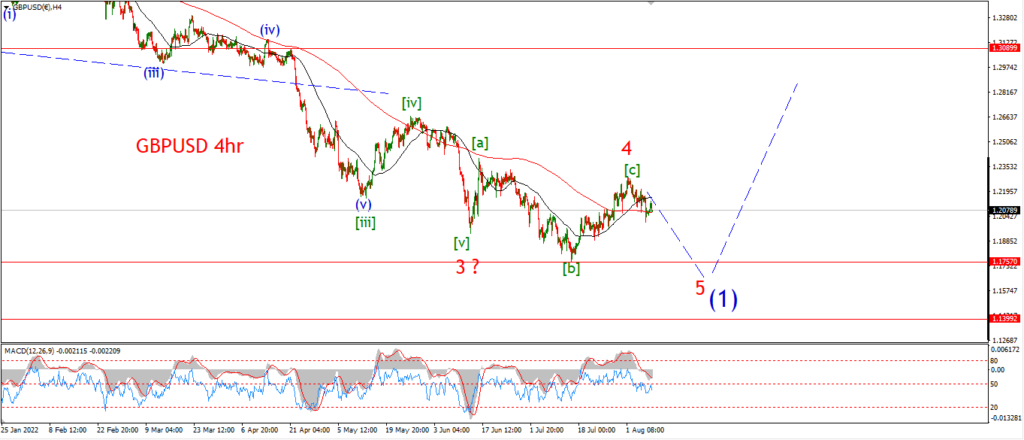
I am looking at a different pattern for wave ‘5’ red in cable tonight.
this pattern is best viewed on the 4hr chart.
If this pattern is correct,
then we will see a large acceleration lower this week in a third of a third decline.
The only way I can explain the overlapping declines last week is as a series of 1,2 waves at declining degrees.
Wave ‘iii’ of (iii) of [iii] will take the price back below 1.1900 at a minimum.
and then the larger pattern will begin to step lower over the following weeks as wave ‘5’ complete.
Tomorrow;
Watch for wave ‘ii’ to hold at 1.2138.
Wave ‘iii’ down should break 1.2003 to confirm.
USDJPY.
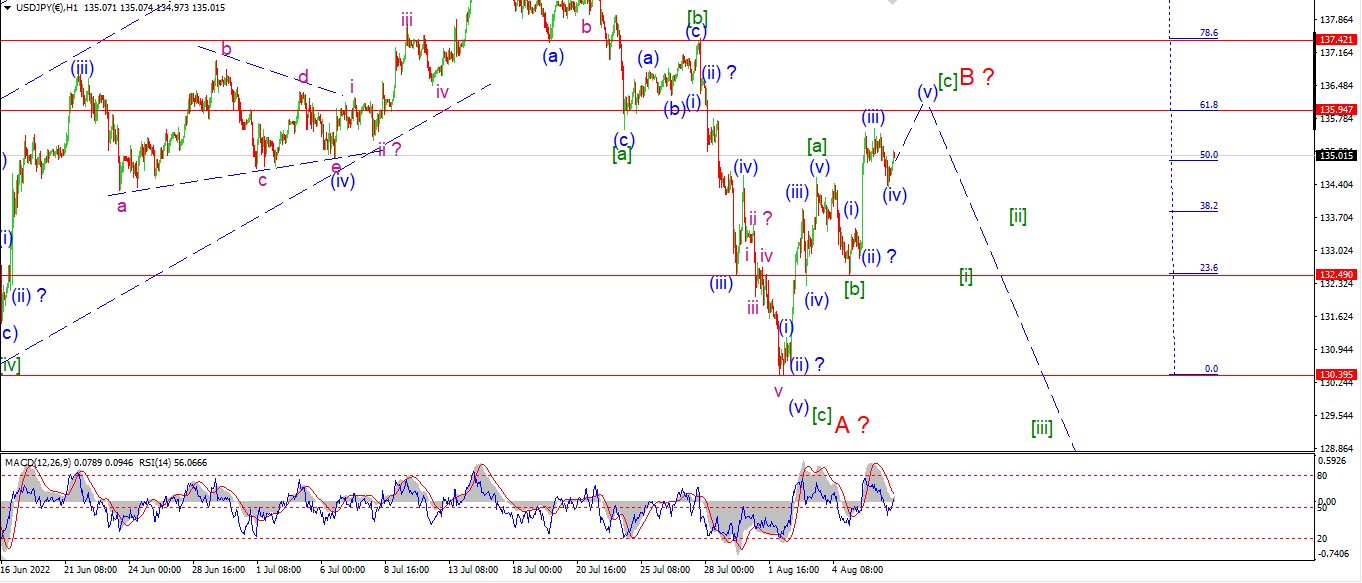
USDJPY 1hr.
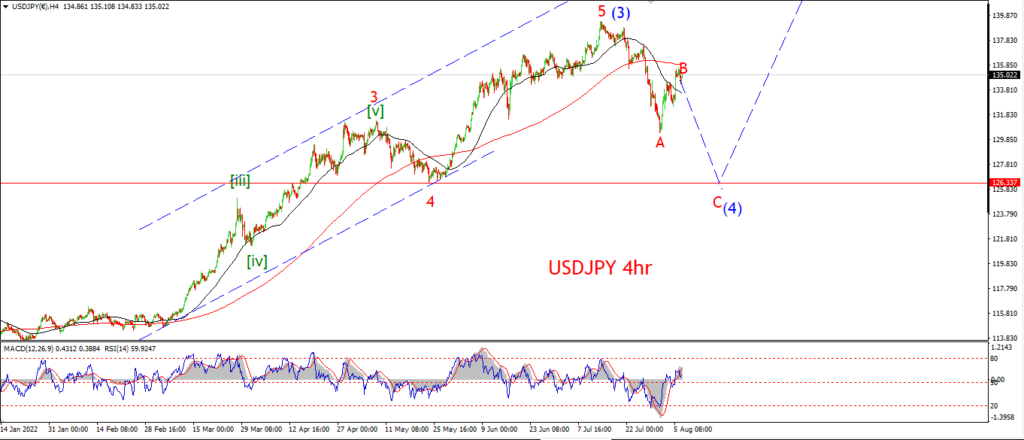
USDJPY 4hr.
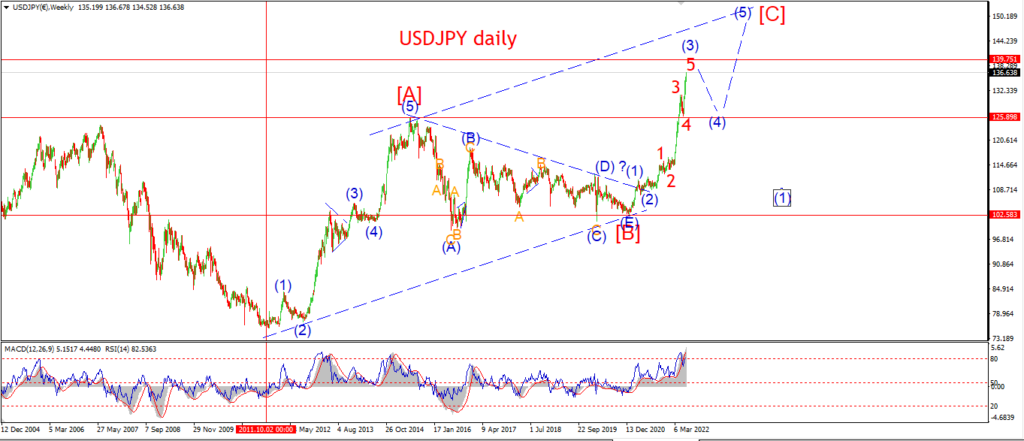
USDJPY daily.
Todays decline is more corrective in nature and suggests wave [c] of ‘B’ is still completing.
Wave [c] should trace out five internal waves up.
Wave (v) of [c] should pop to a new high near 135.95 at the 62% retracement of the wave ‘A’ decline.
Tomorrow;
WAtch for wave [c] to complete five waves up.
Wave ‘B’ should complete tomorrow and then wave [i] of ‘C’ will return lower by midweek.
DOW JONES.
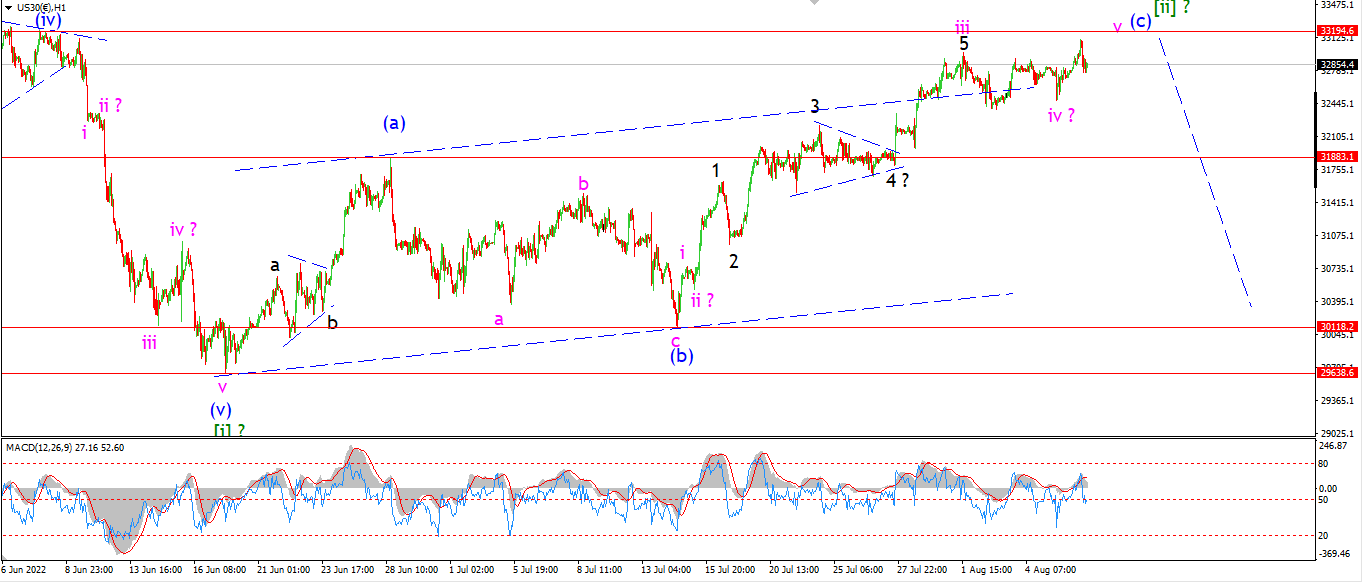
DOW 1hr.
DOW 4hr
DOW daily.
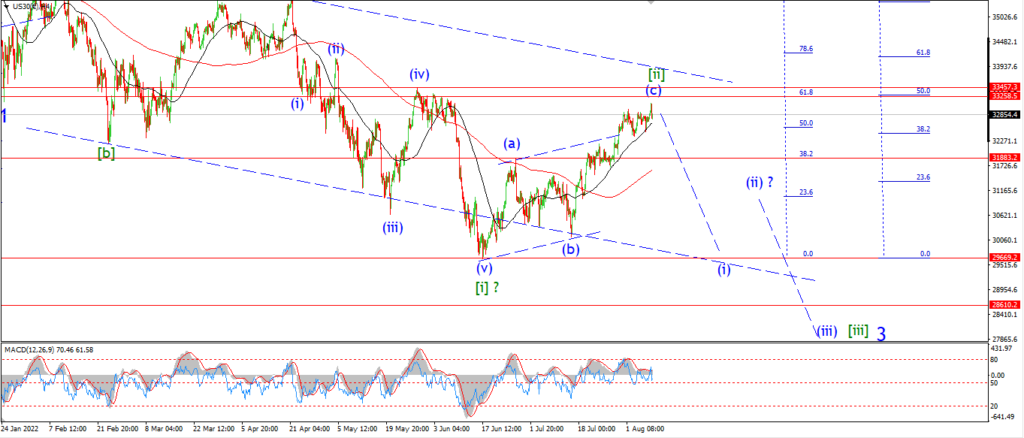
Take a look at the 4hr chart to start with tonight.
I have switched to a simpler count for waves [i] and [ii].
And now I am viewing this latest correction higher as a correction at one degree higher than previously.
Now for the interesting part.
This corrective rally in wave [ii], is now stalling just below the 61.8% retracement level of the wave [i] decline.
Add to that,
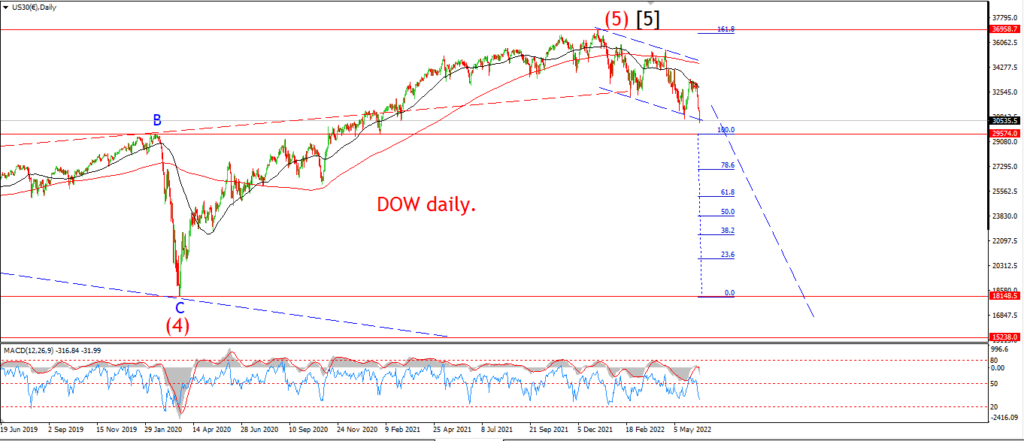
the correction in wave [ii] is stalling just below the 50% retracement level of the whole decline off the all time high back in January.
The price is still holding below the previous wave (iv) high of the wave [i] decline.
and all that is happening with the backdrop of a serious momentum divergence on the 4hr chart.
In my view,
all this information points to a resolution to the downside in wave [iii] over the coming months.
And the main thing I am looking for is an initial decline to begin wave (i) of [iii] this week.
Tomorrow;
Watch for wave (i) of [iii] to begin to show its hand with a drop back below 31880 at the previous wave (a) high.
This level also marks the the area of the internal triangle within wave (c) of [ii].
Which seems to raise the importance of a break of that level in my humble opinion.
GOLD
GOLD 1hr.
GOLD 4hr.
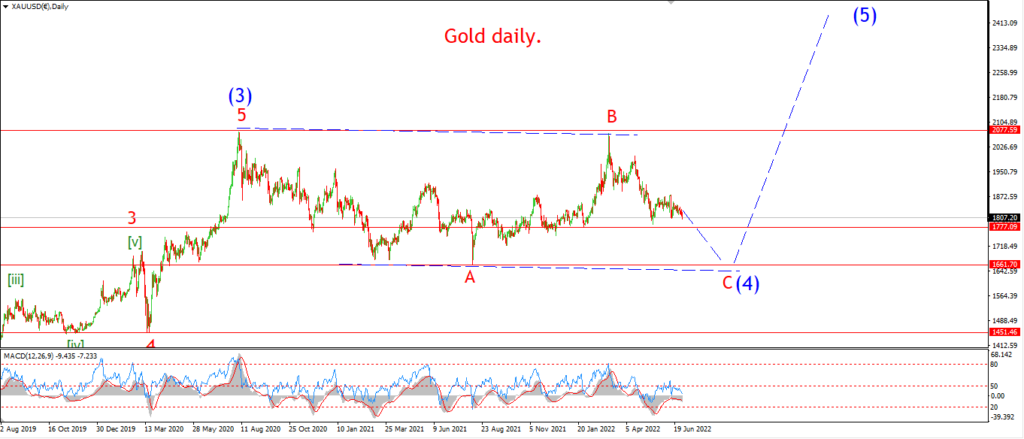
GOLD daily.
We may be on the verge of a bullish switch in the Gold pattern this week.
But I just want to show you why I am not jumping on that bandwagon just yet.
If you look at the daily chart you will see that the previous wave ‘A’ low lies at 1676.90.
The recent low last month did not break the wave ‘A’ low.
Now the current rally may well be the beginning of that large wave (5) up that I have been long awaiting,
but for the moment,
I am not convinced on that idea.
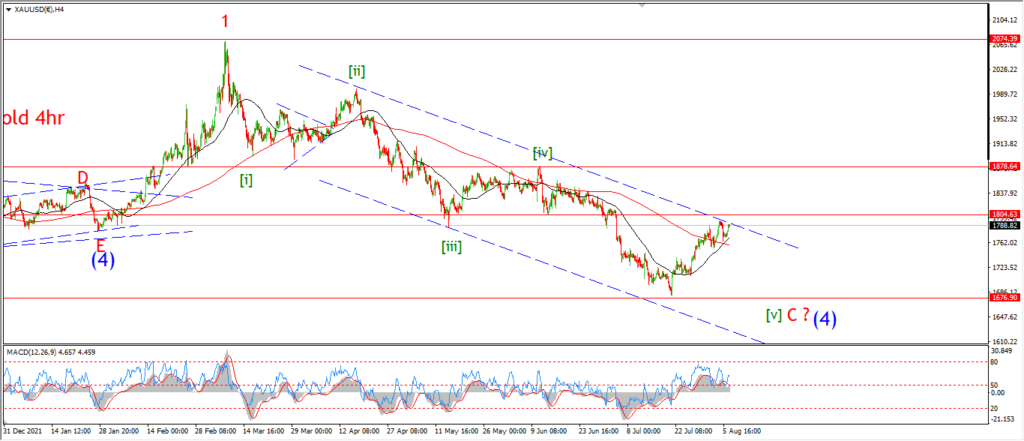
On the 4hr chart.
1804.75 marks the low of wave (i) of [v] of [c].
If that level breaks,
then I will switch to the alternate bullish count.
Tomorrow;
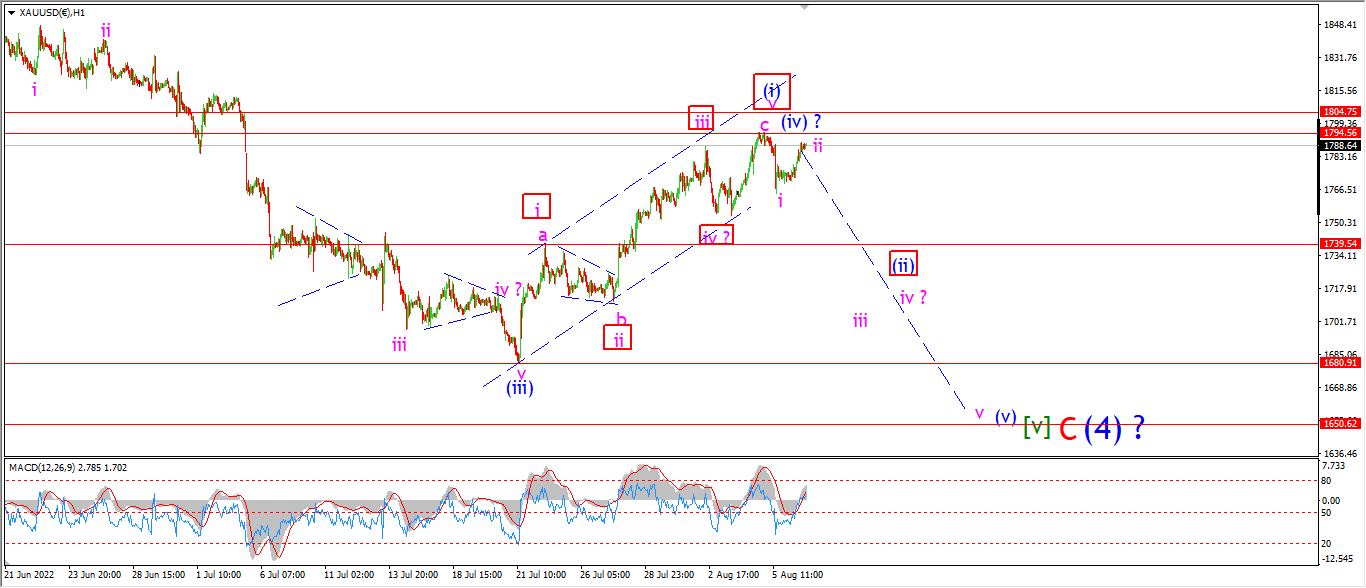
As for the hourly chart.
We have a small lower high today and this is labelled wave ‘ii’ of (v).
WAve ‘iii’ down must begin with a sharp decline below 1740 again.
If that happens,
then the main count will be confirmed and we can expect a decline to break that 1676 low again to complete the larger pattern.
CRUDE OIL.
CRUDE OIL 1hr.
CRUDE OIL 4hr.
CRUDE OIL daily.
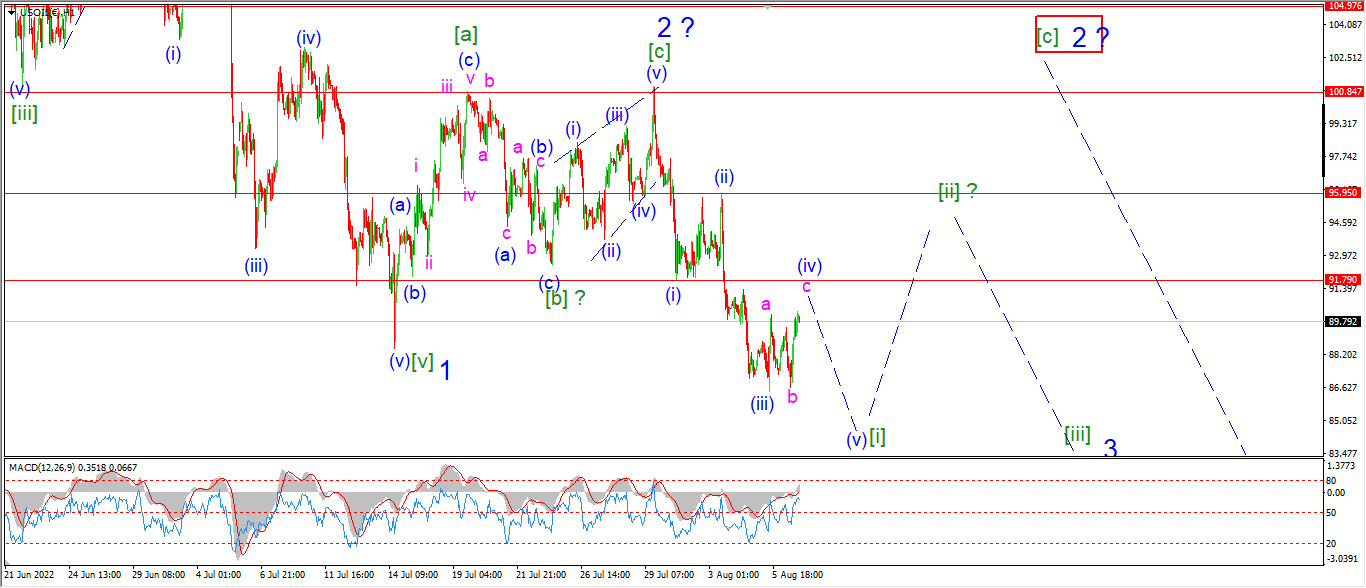
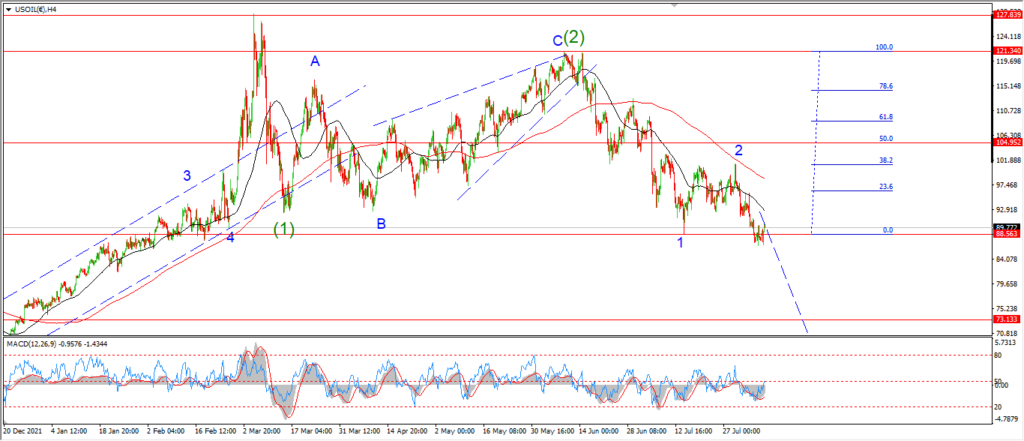
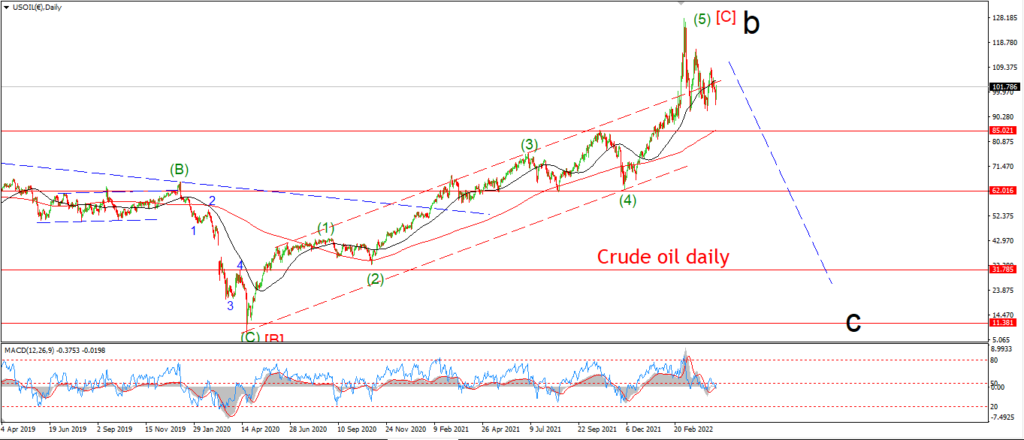
I am looking at an alternate count for wave [i] of ‘3’ tonight.
And the action for the last few sessions has now traced out three waves higher in wave (iv) of [i].
This count calls for a decline into wave (v) of [i] this week,
and then wave [i] should yield to a corrective rally in wave [ii] later this month.
Tomorrow;
Watch for wave (iv) to complete below 91.80 at the wave (i) low.
Wave (v) should fall below 86.00 again at a minimum.
S&P 500.
S&P 500 1hr
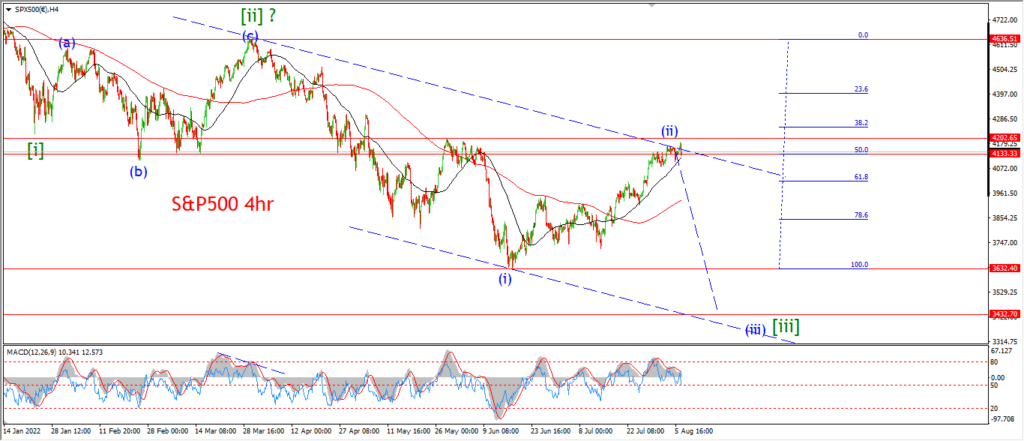
S&P 500 4hr
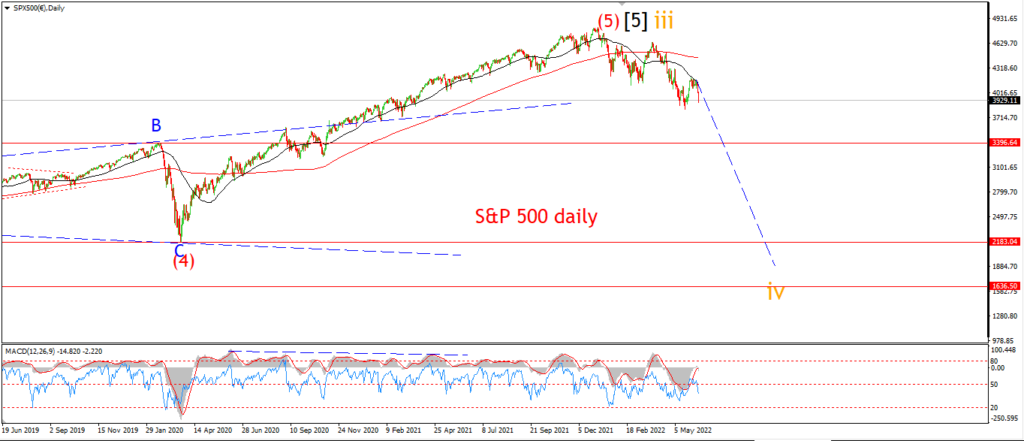
S&P 500 daily.
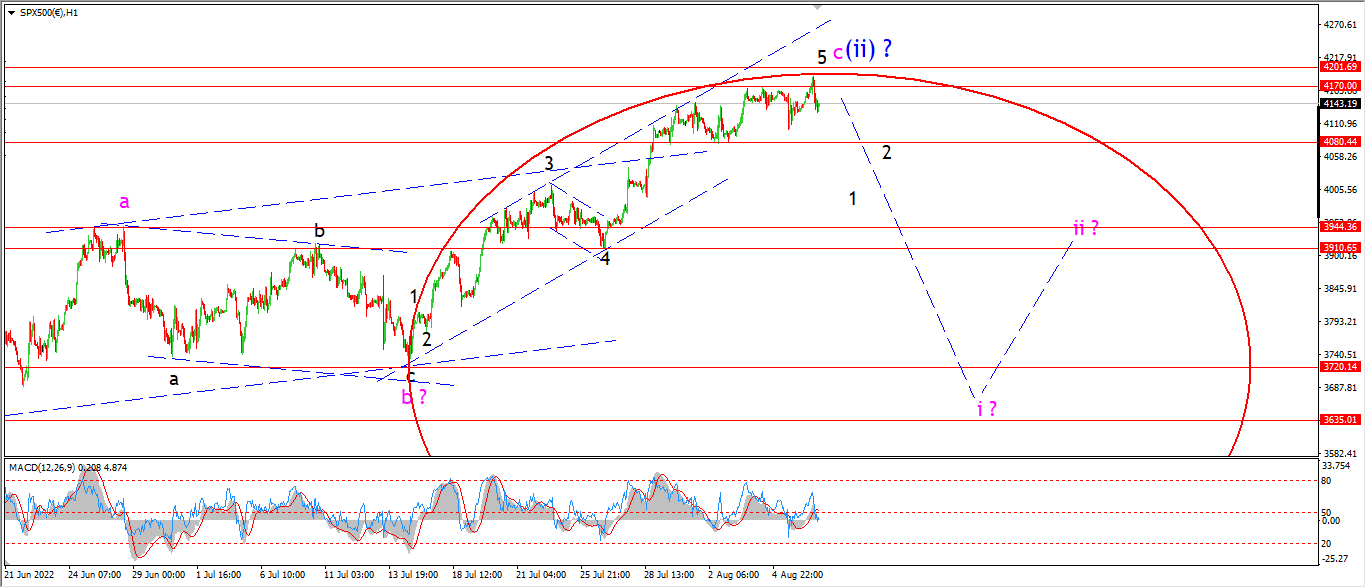
I am getting artistic tonight by showing the slowing momentum in wave ‘c’ within the arc of an ellipse.
While there is no major merit in the curve,
it does show the rate of deceleration quite well.
We will have to wait and see if the right hand curve of the ellipse will hold the price action also.
There is no change on that count today.
The price made a new intraday high but the market is now about to close in the red today.
So I will call that a fail in my book.
And we can just picture that as part of the reversal cycle and general momentum reversal underway.
the market is a big juggernaut,
it might take time to turn,
but when it does it will be unstoppable in the opposite direction.
Tomorrow;
I am watching three support levels below us here.
The recent correction low at 4080,
The wave ‘a’ high at 3944,
and the wave ‘4’ low at 3910.
If the market falls and takes out all of those supports this week,
then I think we can confirm the turn into wave ‘i’ is a done deal.
SILVER.
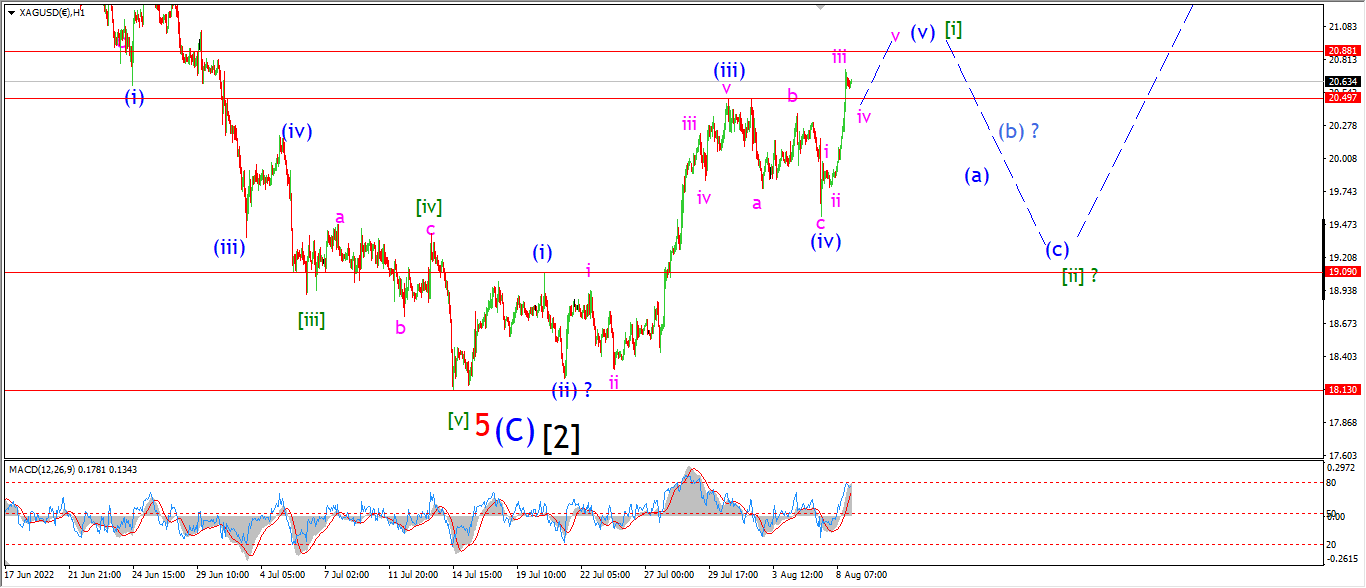
SILVER 1hr
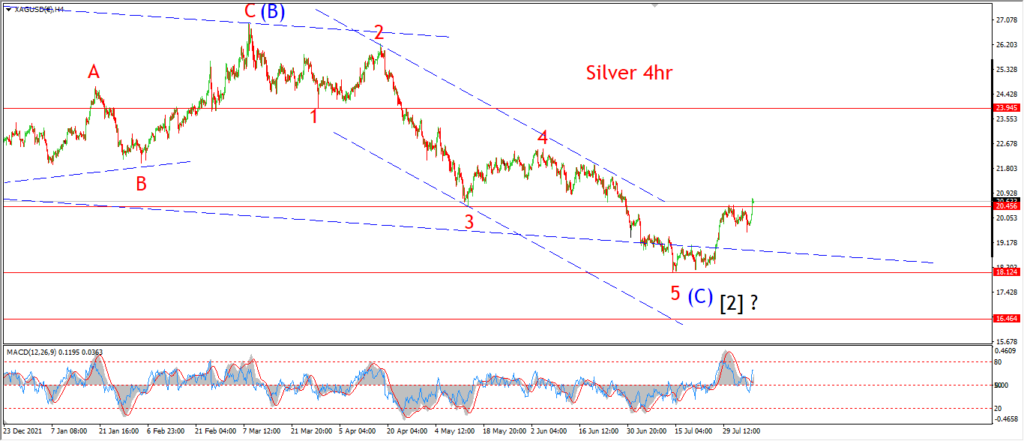
SILVER 4hr.
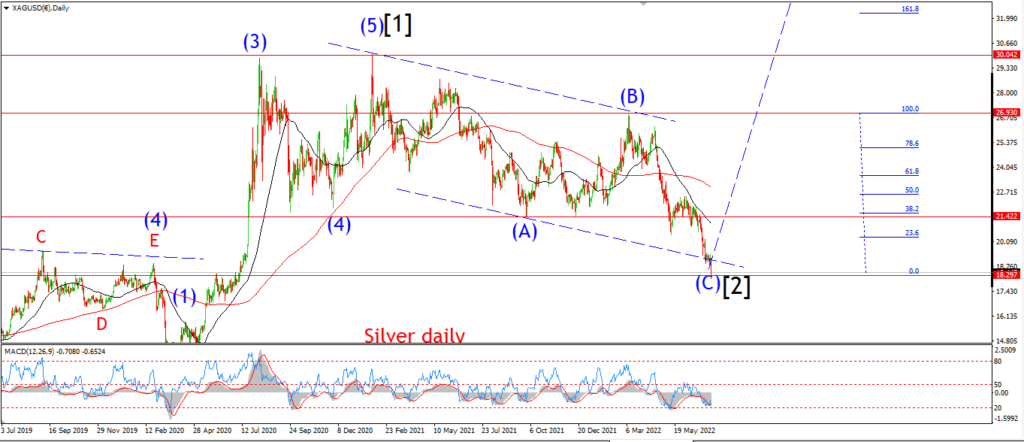
SILVER daily.
You may not be surprised to see that I am switching to the bullish count for silver after todays rally.
I think that todays spike was enough to seal the deal of a five wave pattern off the lows,
and now I can focus on that important higher low scenario into wave [ii] over the coming weeks.
If and when that does happen,
then silver will be positioned for the greatest rally we may ever have seen in this market.
Wave [3] up is a big deal.
And the daily chart suggests a tripling of the silver price in wave [3].
Tomorrow;
First thing that needs to happen is a clear bullish impulse wave off the low in wave [i] and [ii].
Wave [i] should complete this week.
And we may even see the beginning of wave [ii] before Friday.
Wave for five waves up to complete in wave (v) blue.
BITCOIN
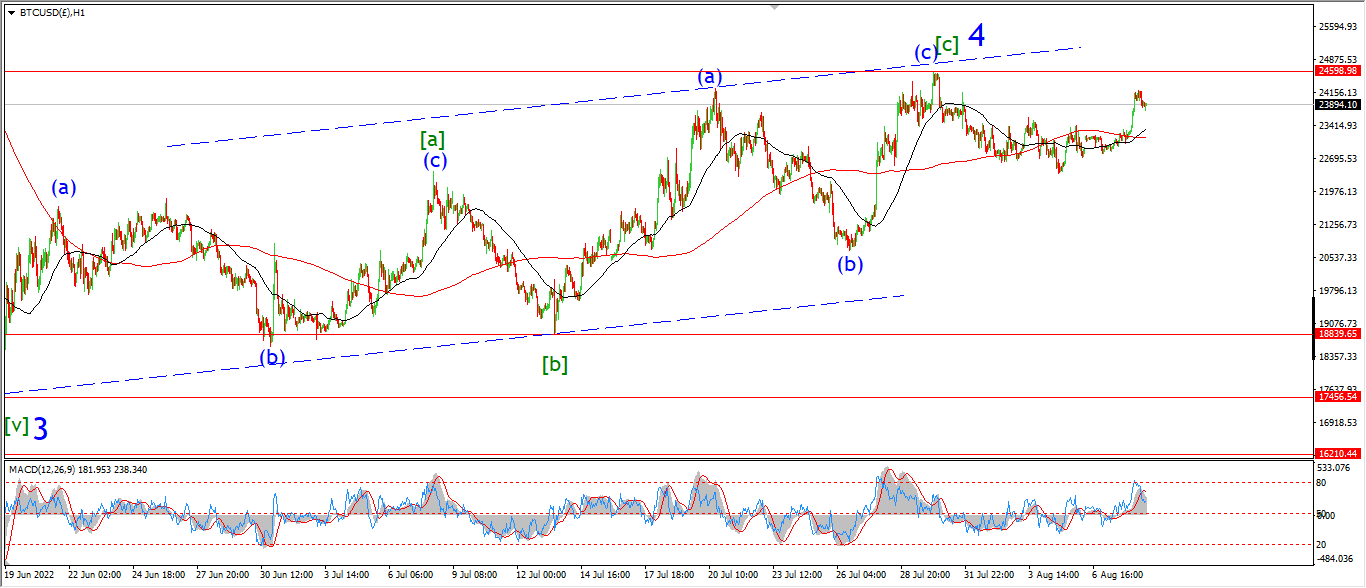
BITCOIN 1hr.
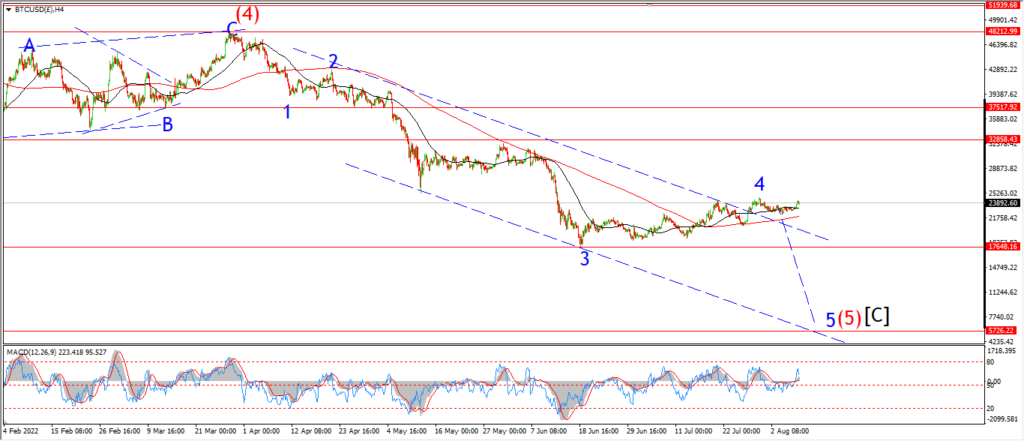
BITCOIN 4hr.

BITCOIN daily.
….
FTSE 100.
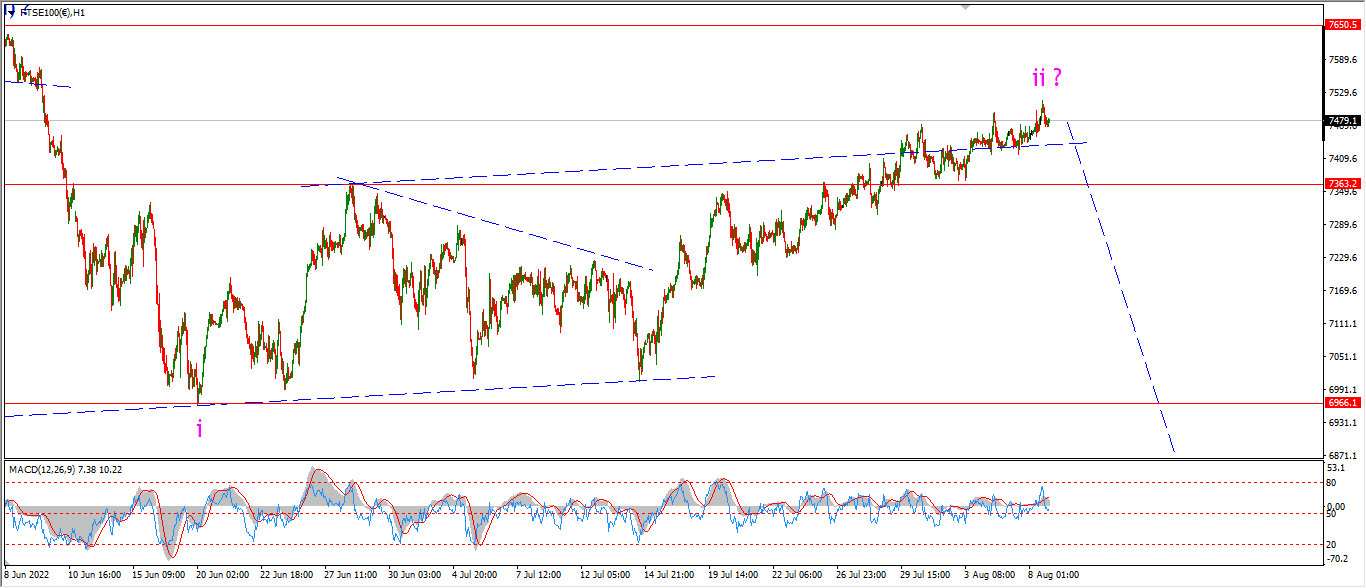
FTSE 100 1hr.
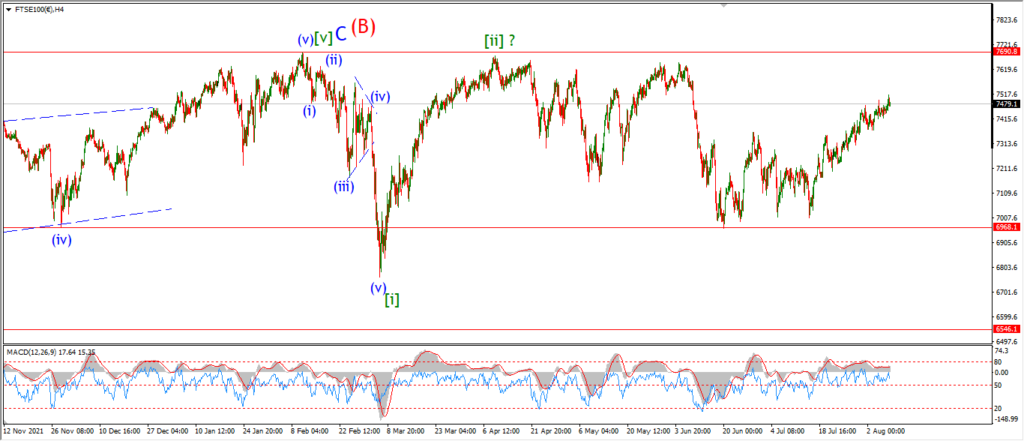
FTSE 100 4hr.

FTSE 100 daily.
….
DAX.
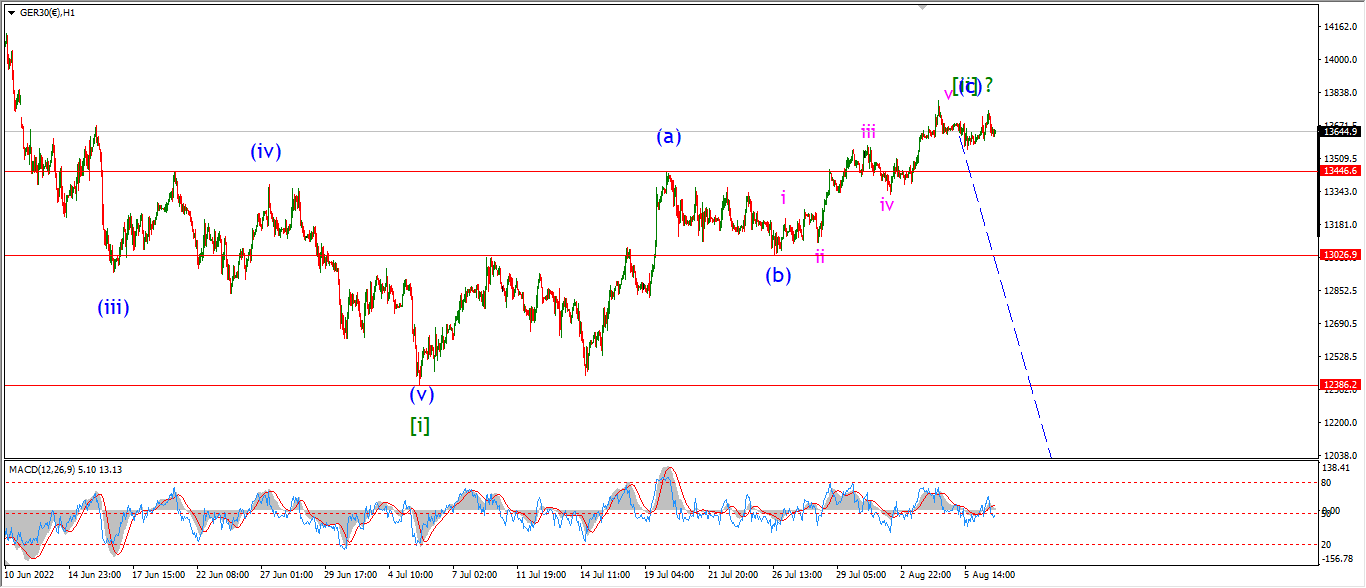
DAX 1hr
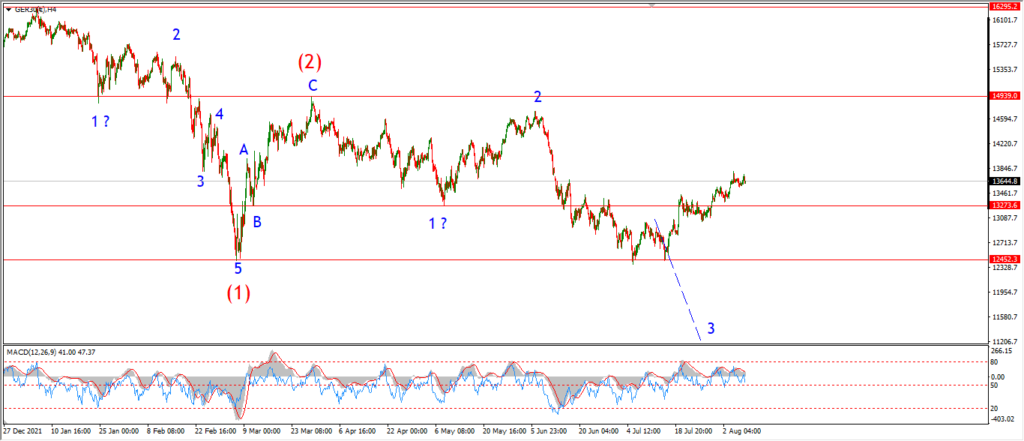
DAX 4hr

DAX daily.
….
NASDAQ 100.
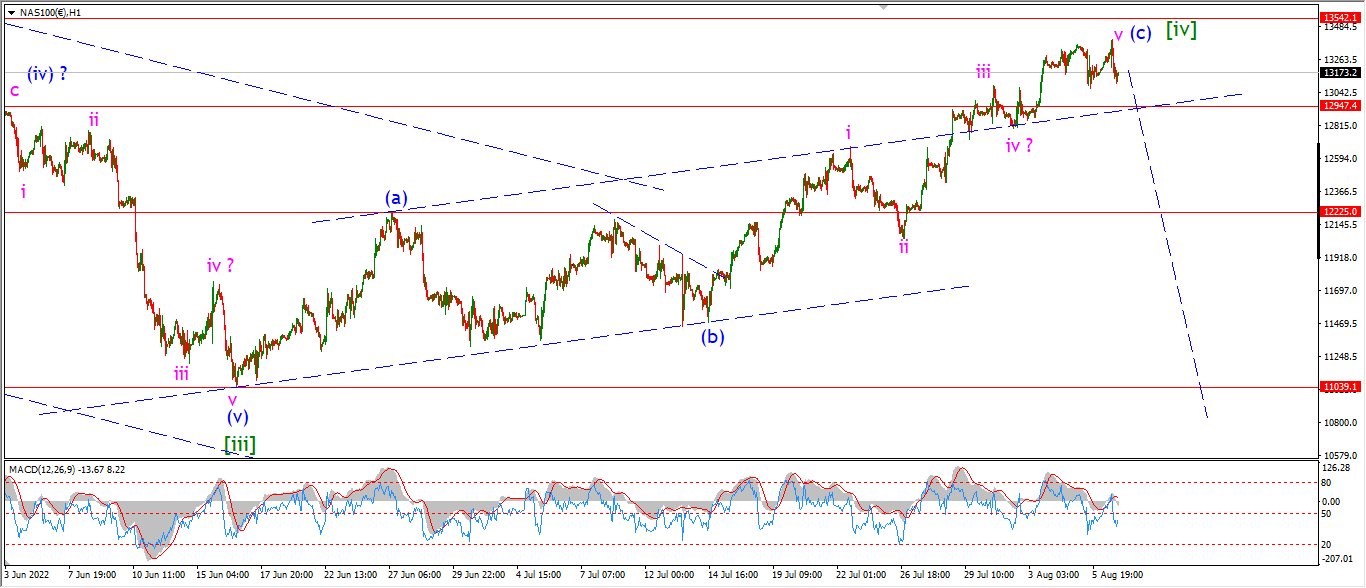
NASDAQ 1hr
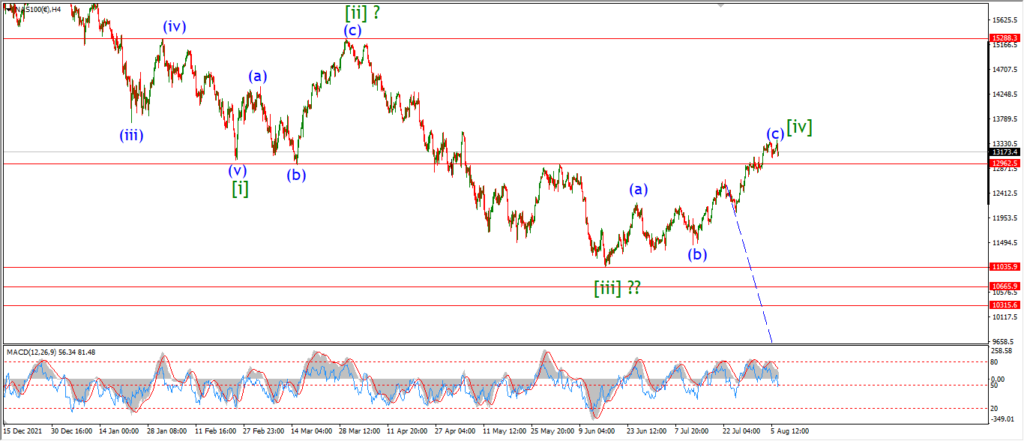
NASDAQ 4hr.
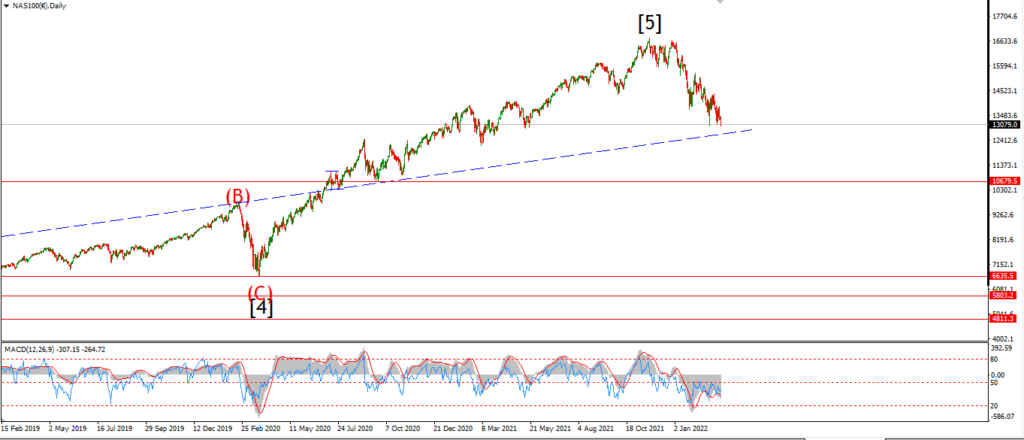
NASDAQ daily.
….