
Good evening to you folks, and the Lord’s blessings to you all tonight.
I am back!
I think it happens once every 6mths or so, but it happened last night again!
The website went down with a bang, and it took last night and all of today to get back on track again.
I want to thank you for your patience, I am a one man show here and everything falls on my lap when problems come.
So I end up trying to solve problems that I know very little about, but its a lesson in patience and humility if nothing else!
So I thank God for those lessons and for getting me back in action tonight.
For those who what to, here is a link to the video from earlier today – https://youtu.be/tYp3tp58uwQ
Ok, on with the show I think.
EURUSD.
EURUSD 1hr.
EURUSD 4hr.

EURUSD daily.
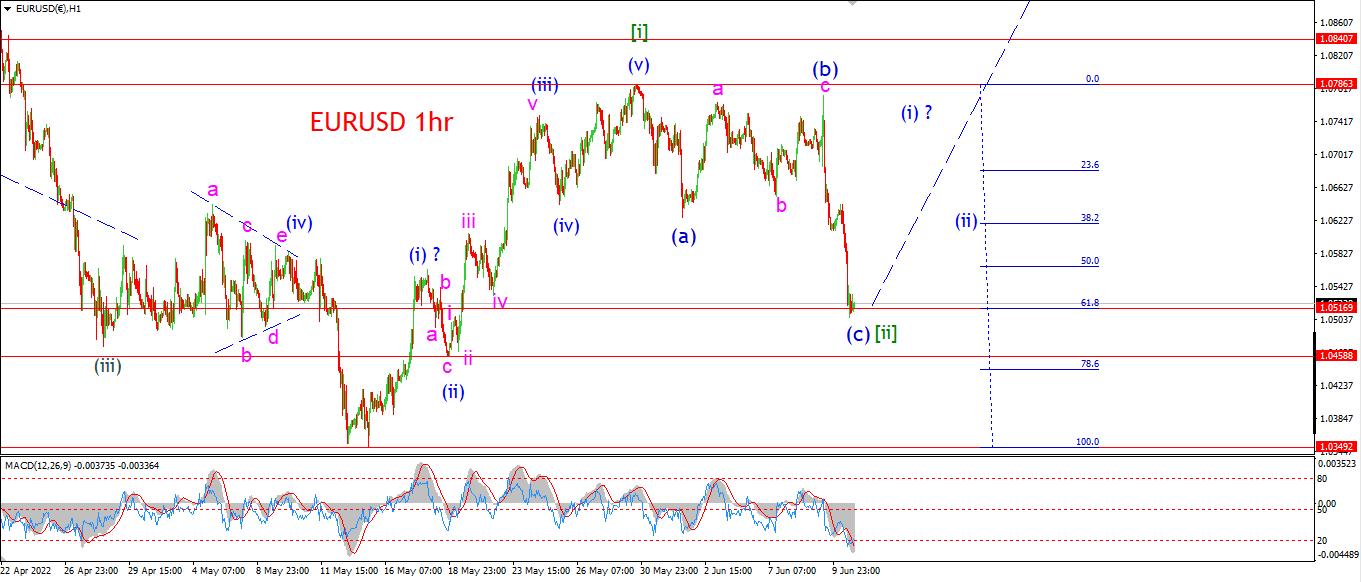
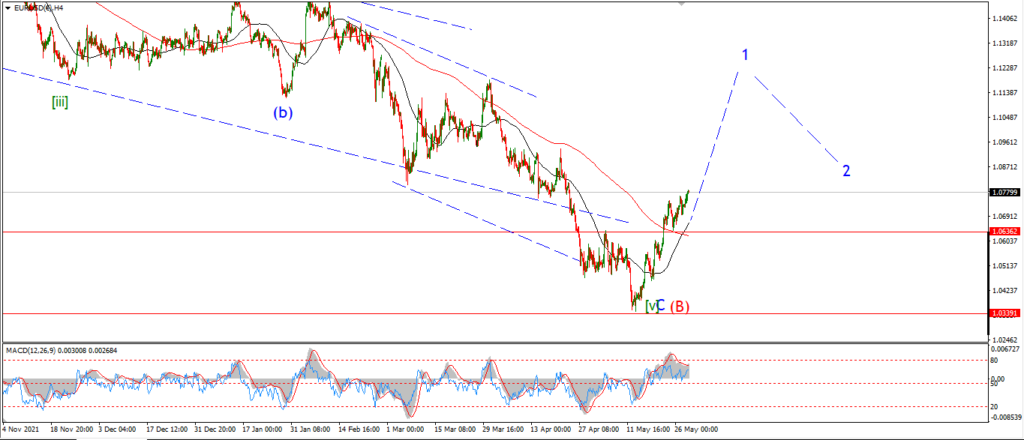
EURUSD has now completed a flat correction in wave [ii] this evening.
The action triggered the alternate count yesterday, but you did not get to see that!
The correction in wave [ii] has now hit the 62% retracement level of wave [i].
And after that sharp move lower today I think I will be looking for a bounce on Monday to signal wave (i) of [iii] is underway.
Monday;
Watch for wave [ii] to complete very soon and I think the initial move higher into wave (i) should happen on Monday.
Wave (i) of [iii] should retrace much of the decline in wave (c).
GBPUSD
GBPUSD 1hr.
GBPUSD 4hr.

GBPUSD daily.
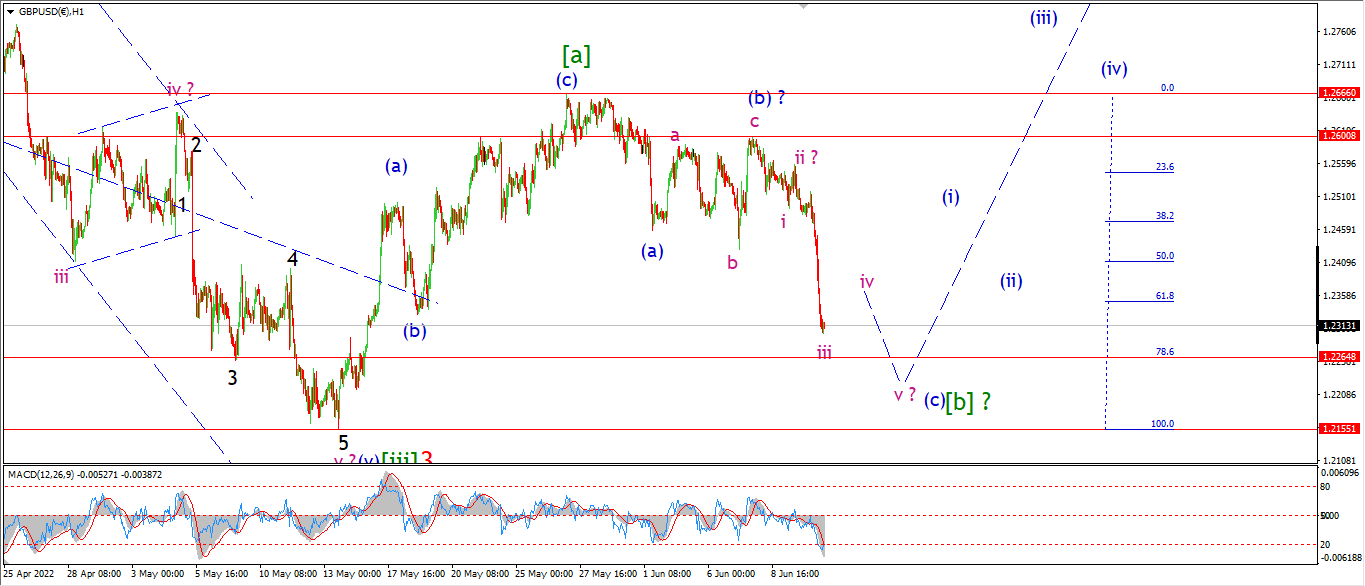
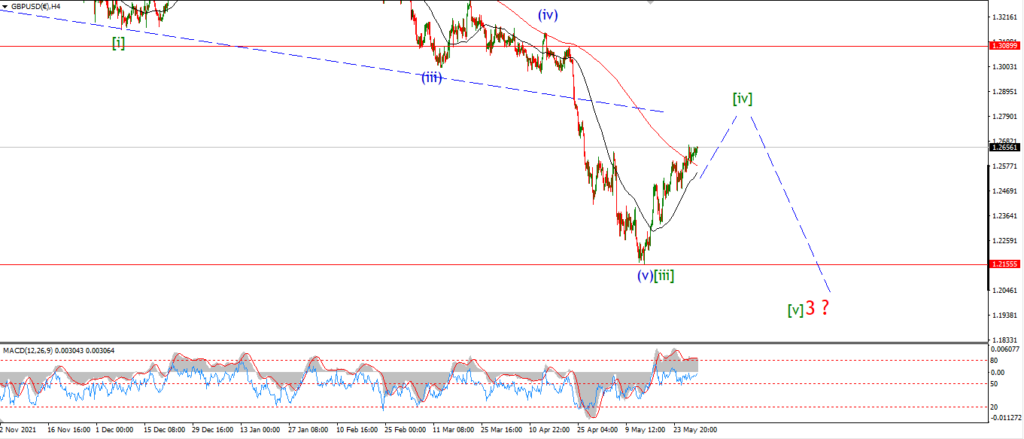
cable has surprised me to the downside today with that sharp drop to trigger the alternate count for wave [b].
I am now tracking a large wave (c) decline to complete a flat correction wave [b].
And I still do favor the idea of a further rally into wave [c] over the coming week.
Monday;
The price must hold above 1.2155 in wave [b].
And then next week I am looking for wave [c] to begin with a spike rally into wave (i) of [c].
Wave (c) of [b] should complete five wave down on Monday and then reverse higher in five waves.
USDJPY.
USDJPY 1hr.
USDJPY 4hr.
USDJPY daily.
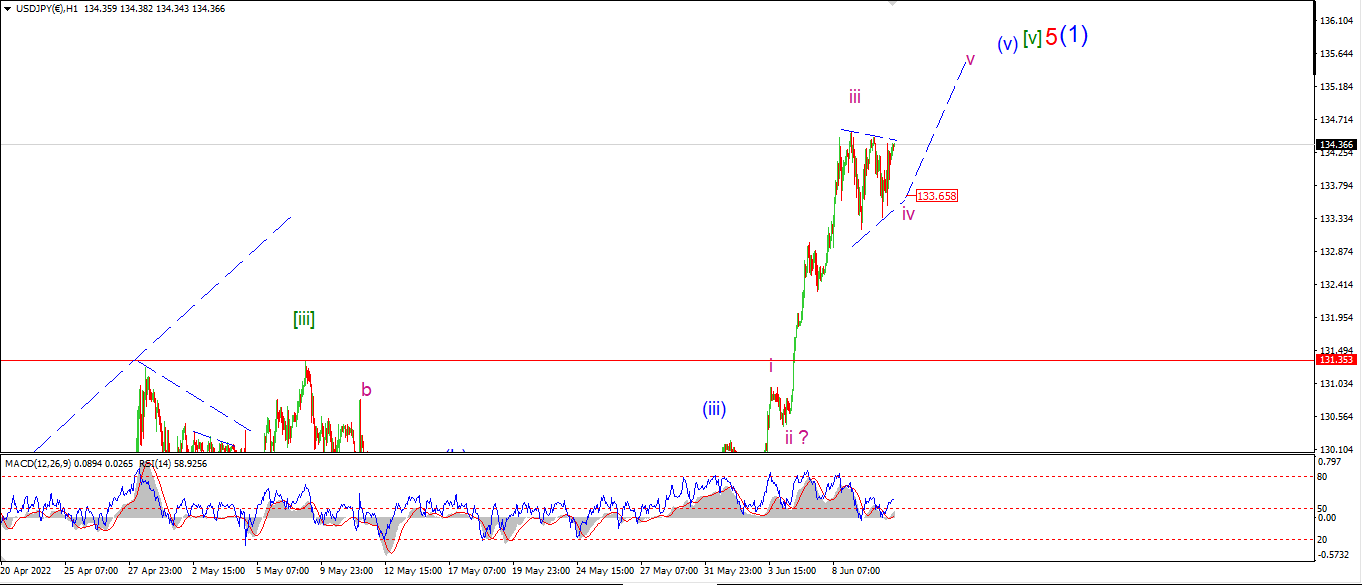
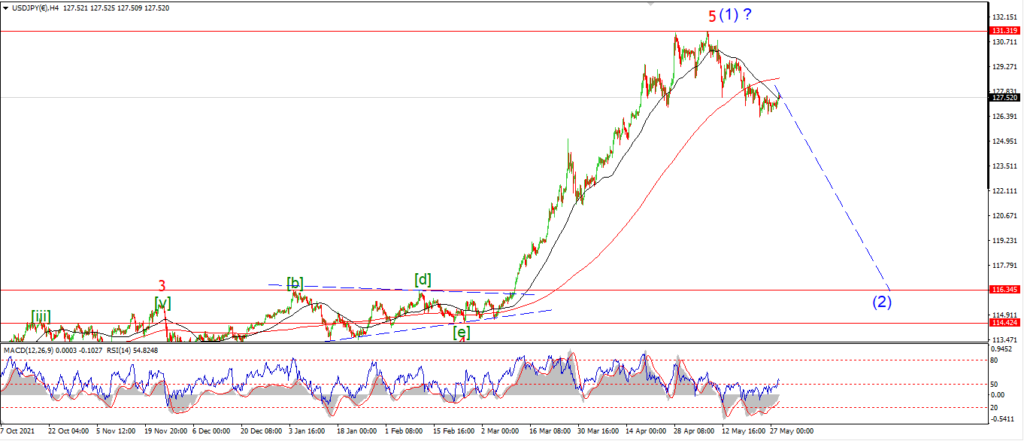
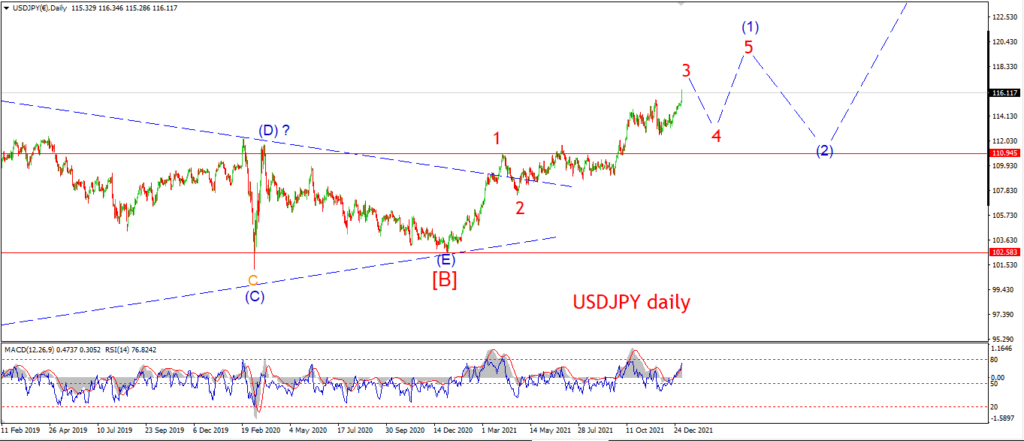
USDJPY has done very little today but correct sideways.
The action is taking the form of a triangle in wave ‘iv’ now.
And this pattern suggests one more high to break above 135.00 again in wave ‘v’ of (v) next week.
Monday;
The triangle can fall again to complete another higher low near 133.65.
And then wave ‘v’ should push higher again.
DOW JONES.
DOW 1hr.
DOW 4hr
DOW daily.
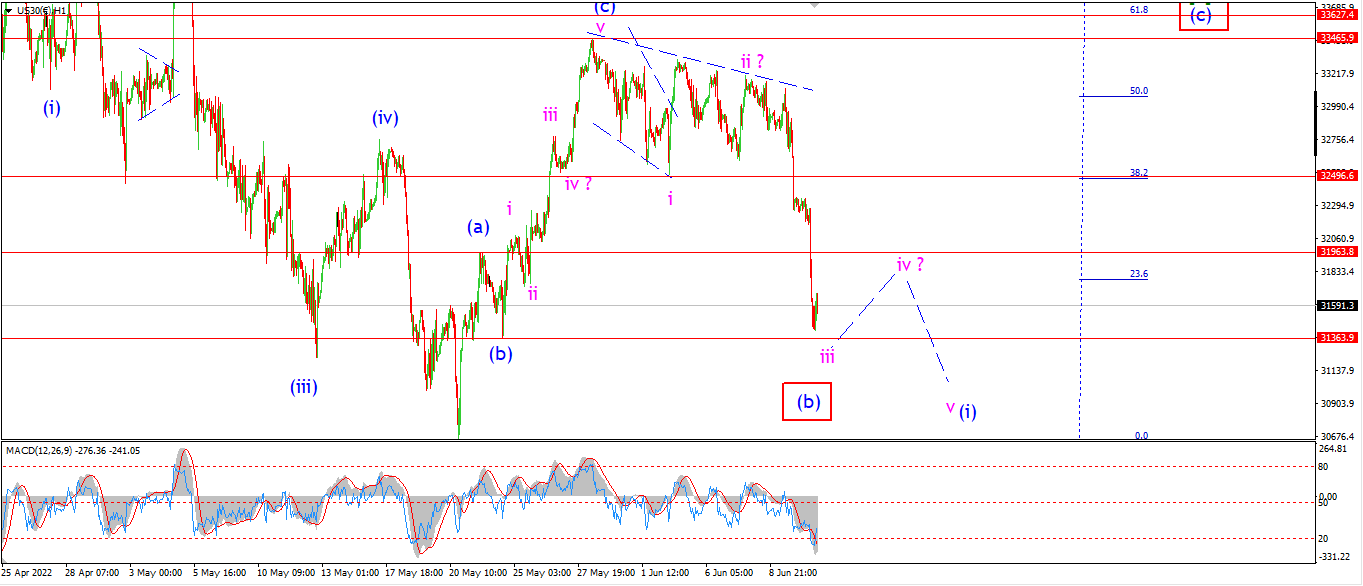
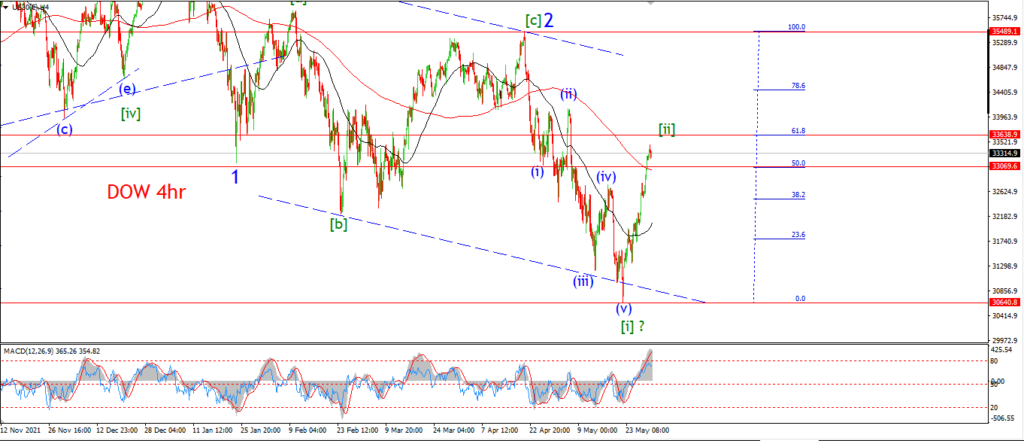
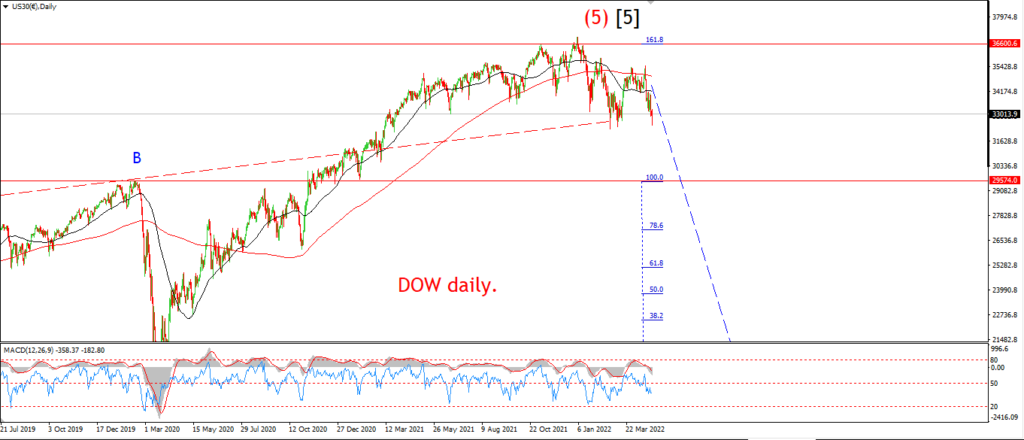
Now the market is back below 32000 again and falling in an impulsive pattern,
I think we are safe to consider the idea of a wave (i) of [iii] pattern now.
The initial decline off the high at wave [ii] was confused to say the least,
but todays acceleration lower does fit with the idea of wave ‘iii’ of (i) as shown.
And now the price is finding a low at the recent wave (b) low,
this is a good area to consolidate sideways in wave ‘iv’ of (i).
Wave ‘iv’ should complete by Tuesday,
and then wave ‘v’ is expected to bring the market back close to a new low on the year.
Monday;
The market is finally falling back in line with the bearish count again.
and if I am correct here,
then we have a long way down ahead to complete wave [iii] down.
Watch for wave ‘iv’ of (i) co correct higher and hold below 32000 again.
GOLD
GOLD 1hr.
GOLD 4hr.
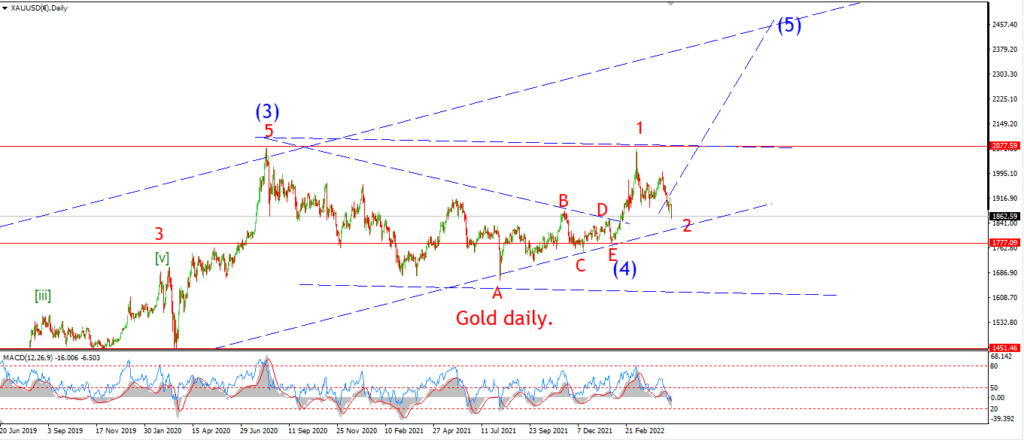
GOLD daily.
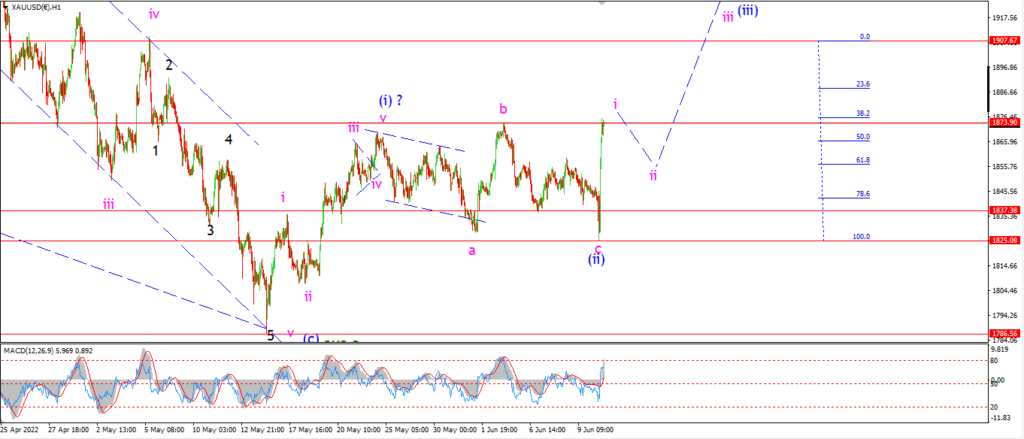
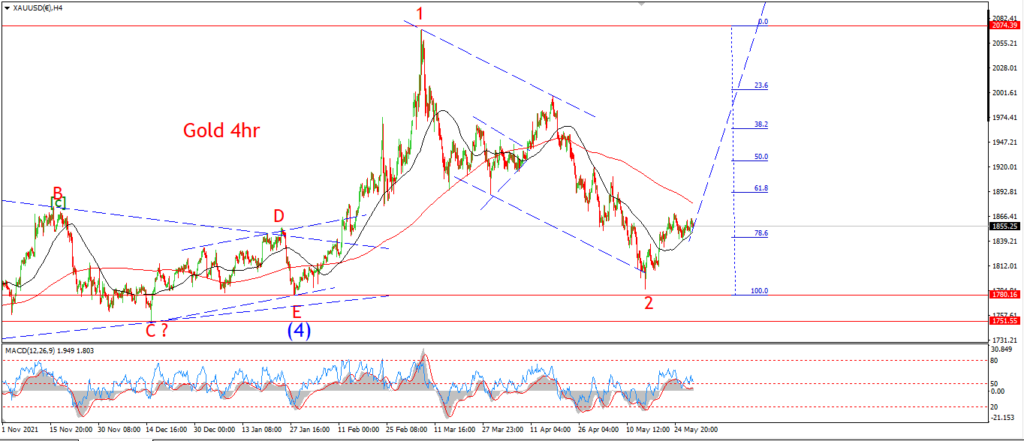
Todays action first broke the bullish pattern and then confirmed the bullish pattern in the space of a few hours!
WAve (ii) is now labelled as a lager ‘tripple three’ complex correction.
and the price shot higher to break the previous interim high at 1873 again to signal that wave (iii) is now underway.
If this count is correct,
then we are about to begin a rally phase in wave (iii) of [iii].
Monday;
watch for wave (ii) to hold at todays lows.
Wave ‘i’ and ‘ii’ should complete a higher low near 1850.
and then wave ‘iii’ of (iii) is expected to rally again later in the week.
CRUDE OIL.
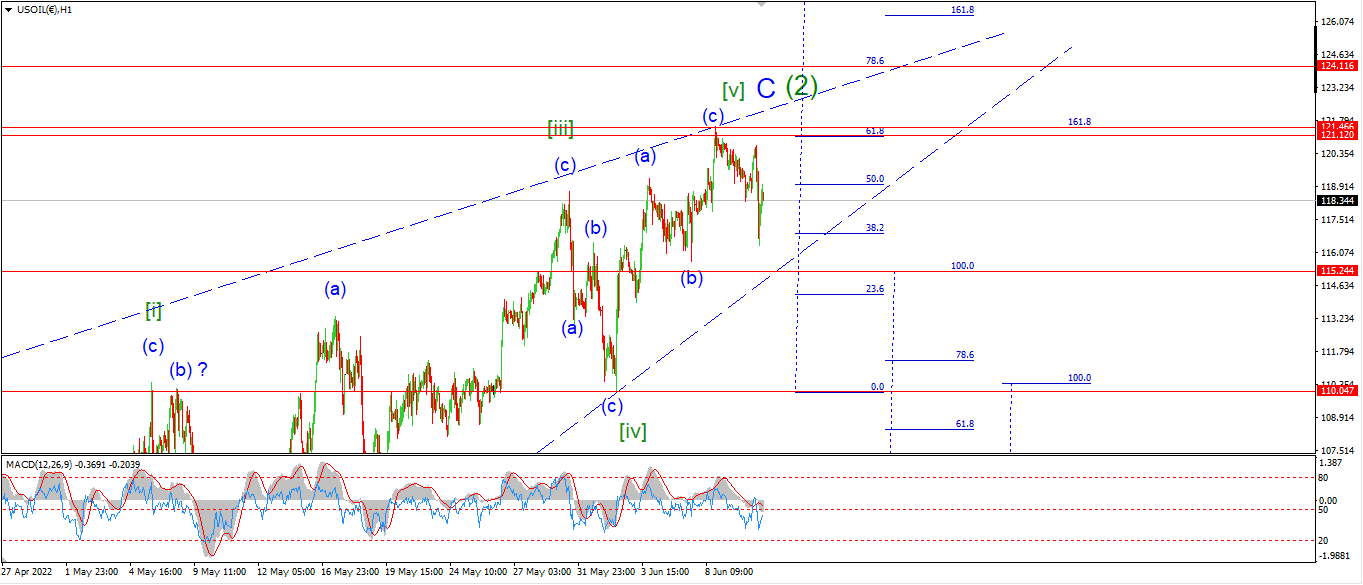
CRUDE OIL 1hr.
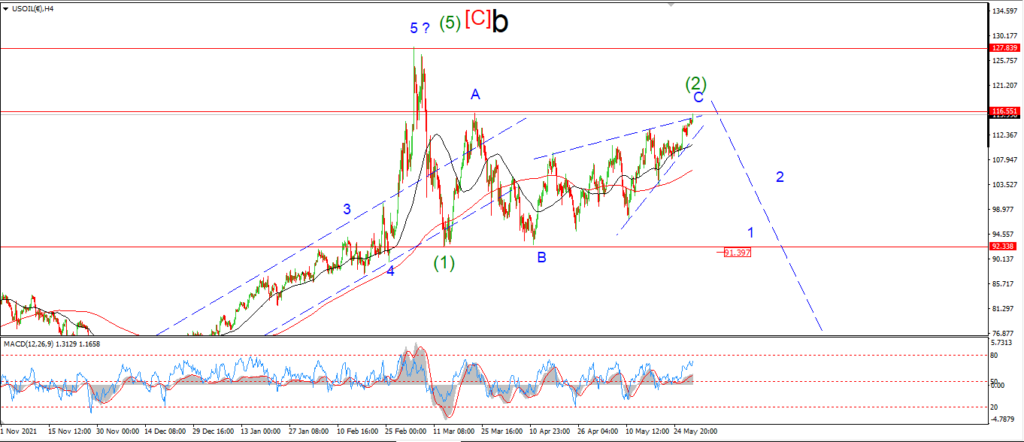
CRUDE OIL 4hr.
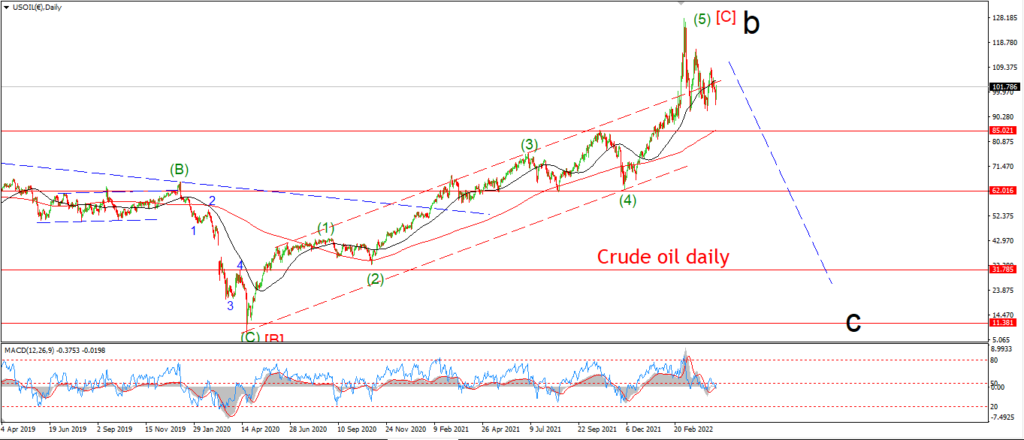
CRUDE OIL daily.
There is pressure building in the crude oil market that I think will result in a sharp decline in the price.
The pattern I am following is a large ending diagonal pattern in wave ‘C’ of (2).
And wave (3) down is next on the cards.
The upside action is increasingly choppy, overlapping and lacks momentum.
The price is basically flat for the first 10 days of June.
The price is also rising in a narrowing wedge,
this alone is indicative of a weak and diminishing trend.
And there is a reasonable chance that the price action is forming a head and shoulders top now.
We will see about that last point soon enough.
Monday;
If wave (2) is complete,
then wave (3) down must begin to make progress lower off the top in an impulsive manner.
Watch for the initial five wave pattern lower next week.
The main support level lies at 110.00 so a break of that will be the biggest signal that a top is in for wave (2).
S&P 500.
S&P 500 1hr
S&P 500 4hr
S&P 500 daily.
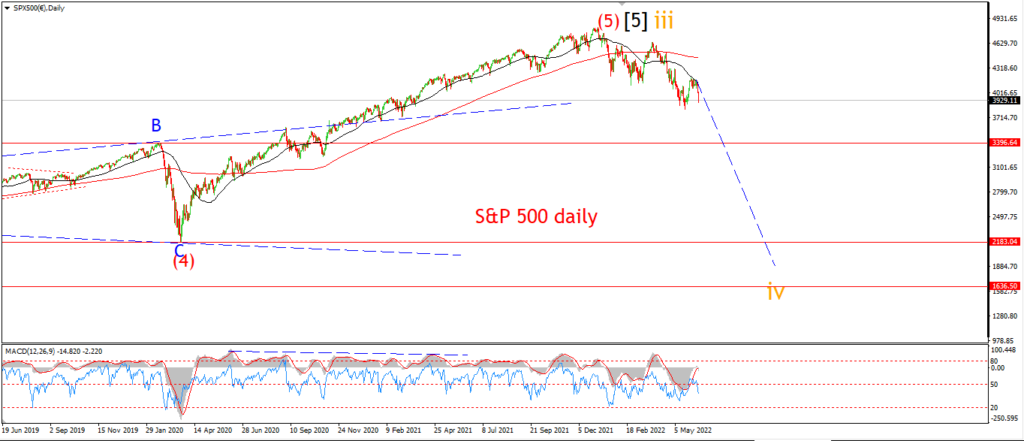
I am looking at the daily chart first this evening,
and the decline over the last few sessions has created another failure below the 50dma.
This is a pretty bad signal for any bull out there especially on the daily timescale.
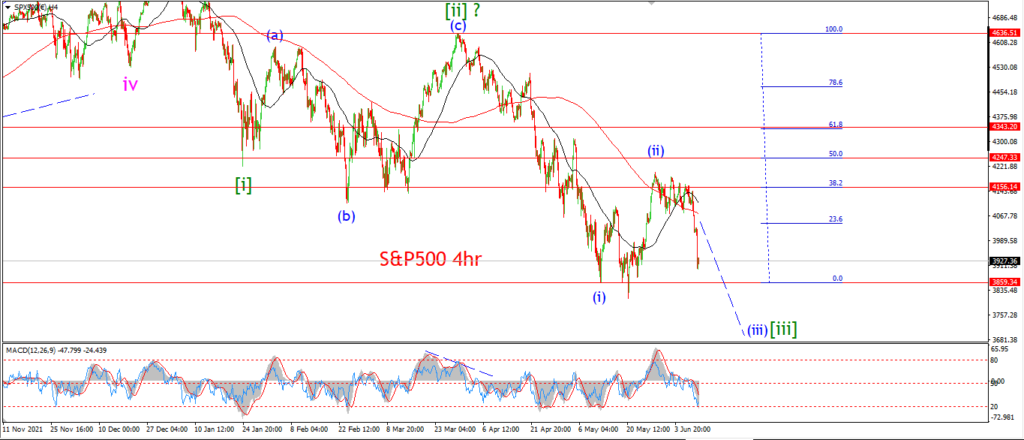
On the 4hr chart the market has failed at the 200ma.
Again, this is a shorter term bearish signal and confirmation of the wave count.
Also this does signal a shift towards negative momentum again.
We will see if that results in a further decline in wave (iii) next week.
But the signs are there to support this idea.
Monday;
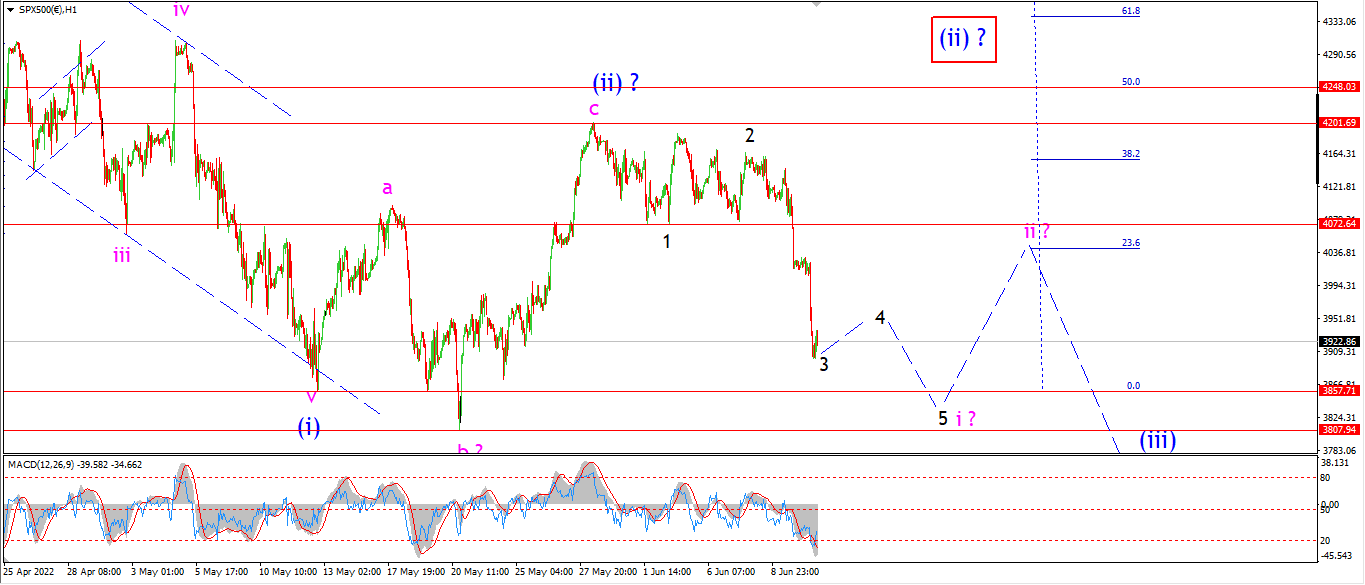
The hourly chart shows an acceleration lower today in wave ‘3’ of ‘i’ of (iii).
I am looking for a correction in wave ‘4’ of ‘i’ on Monday.
And then a final drop in wave ‘v’ of (i) by midweek.
The price will find some support at the recent lows again to complete wave (i).
And then we should see another correction higher in wave (ii) beginning by the end of next week.
SILVER.
SILVER 1hr
SILVER 4hr.
SILVER daily.
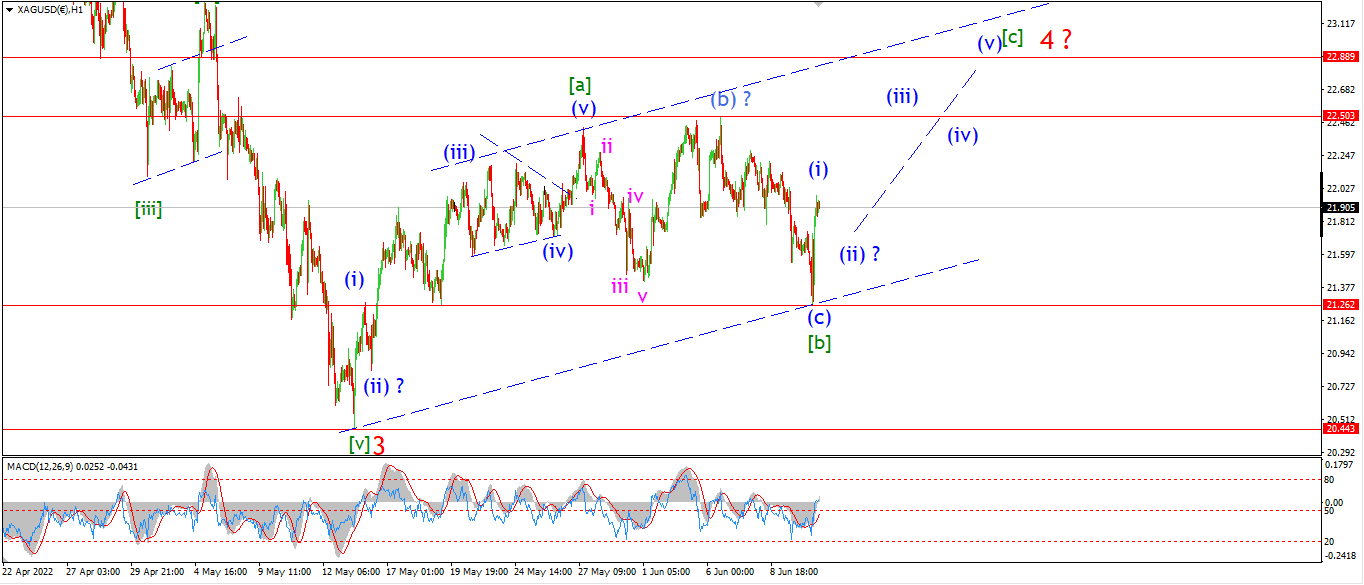
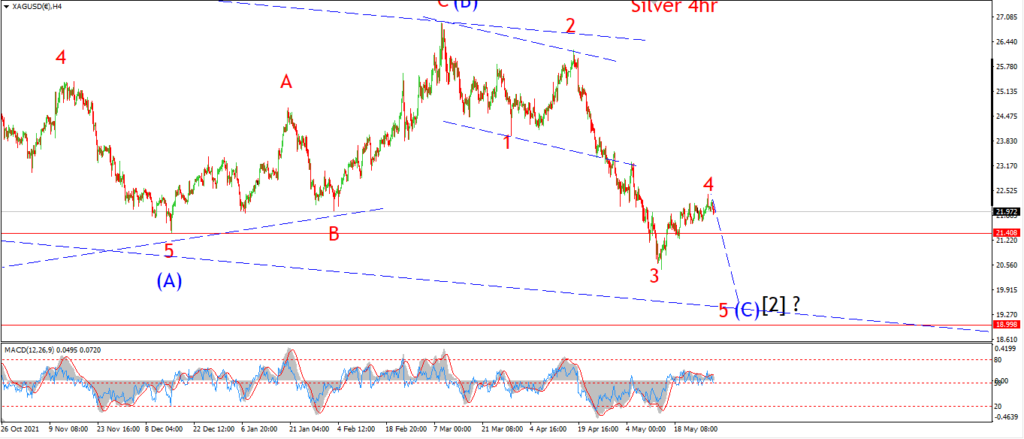
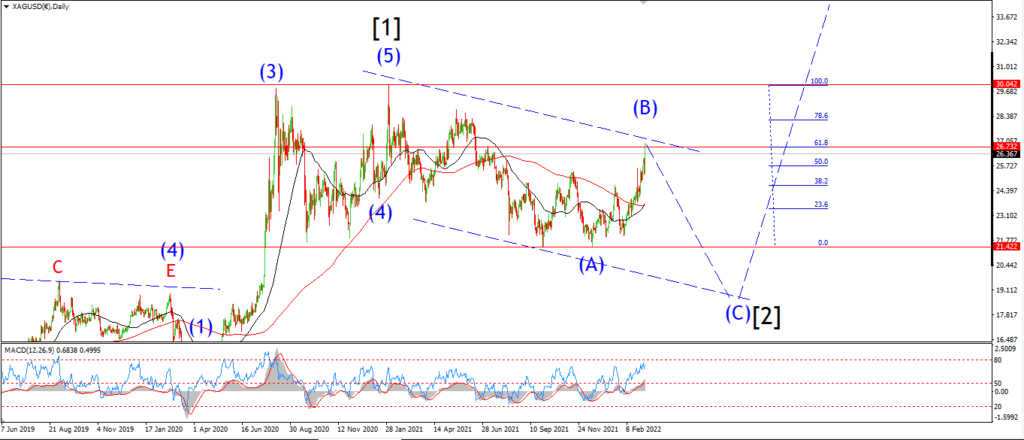
The action in silver has shifted the pattern in favor of a larger wave ‘4’ correction.
Wave (i) and (ii) will create a higher low o Monday in this scenario.
And then wave (iii) of [c] of ‘4’ should break out above the previous high at 22.50 by the end of next week.
the channel should be filled in wave ‘4’ close to the 23.00 mark.
Monday;
watch for wave (ii) to complete above 21.30.
Wave (iii) of [c] will begin by late Tuesday ideally.
Only a break of the low at 20.40 again will invalidate this new pattern for wave ‘4’.
BITCOIN
BITCOIN 1hr.
BITCOIN 4hr.

BITCOIN daily.
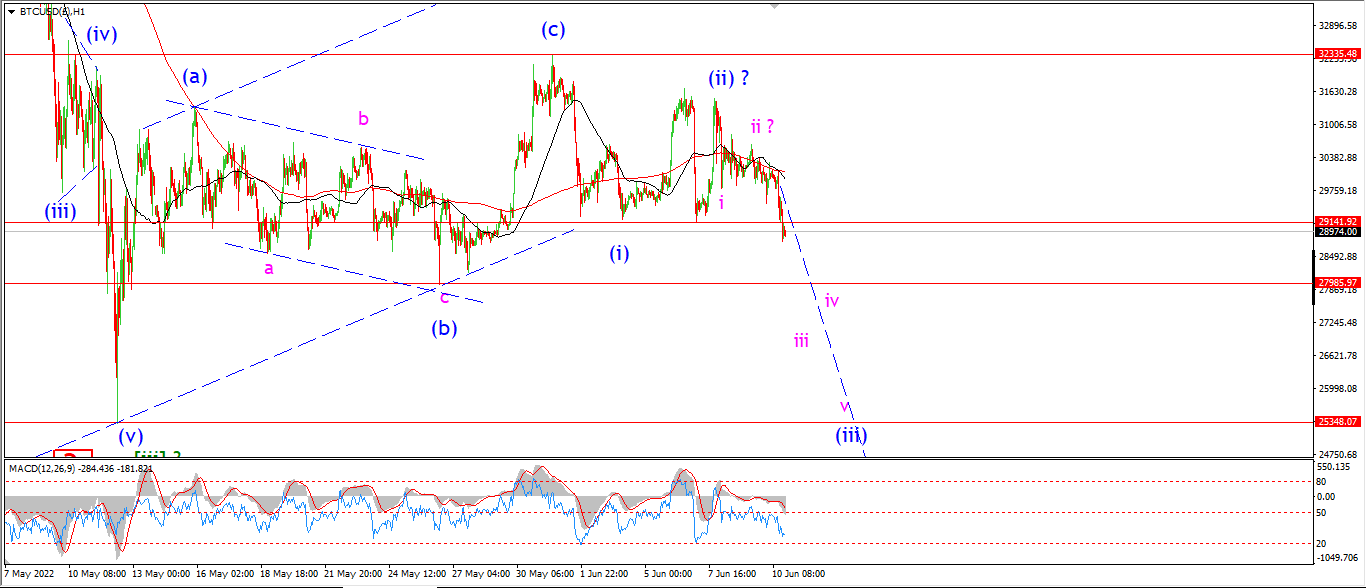
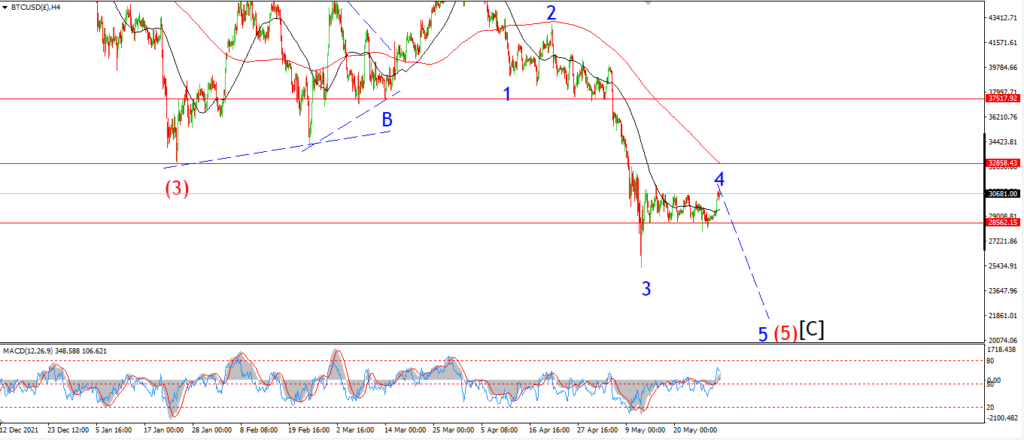
….
FTSE 100.
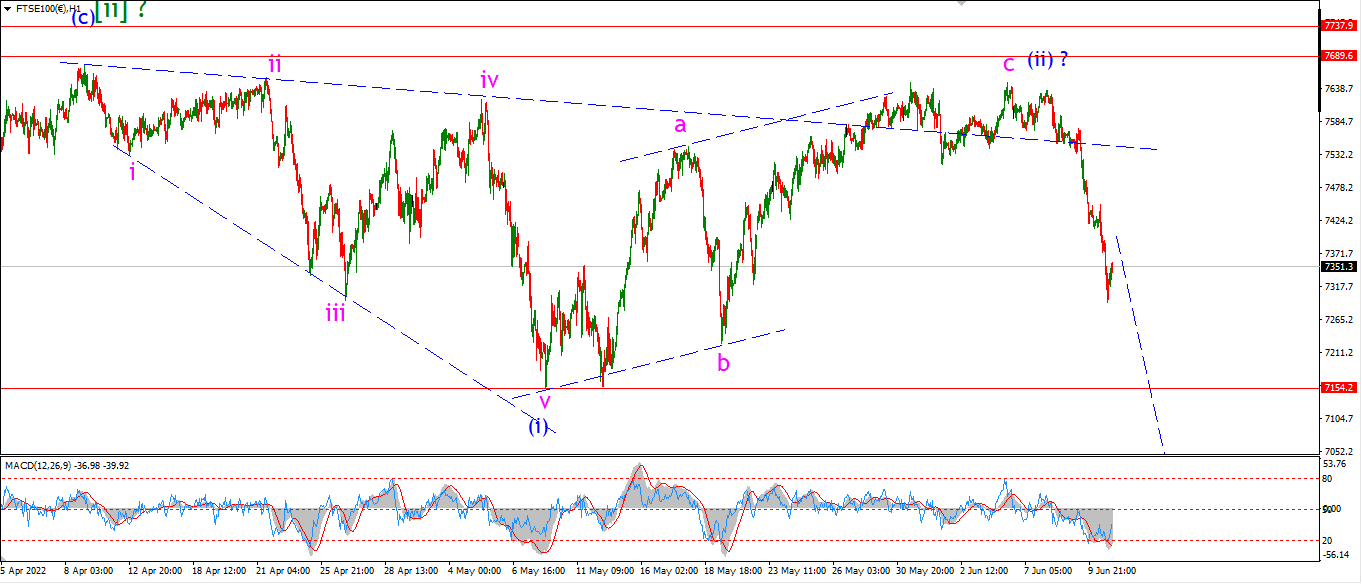
FTSE 100 1hr.
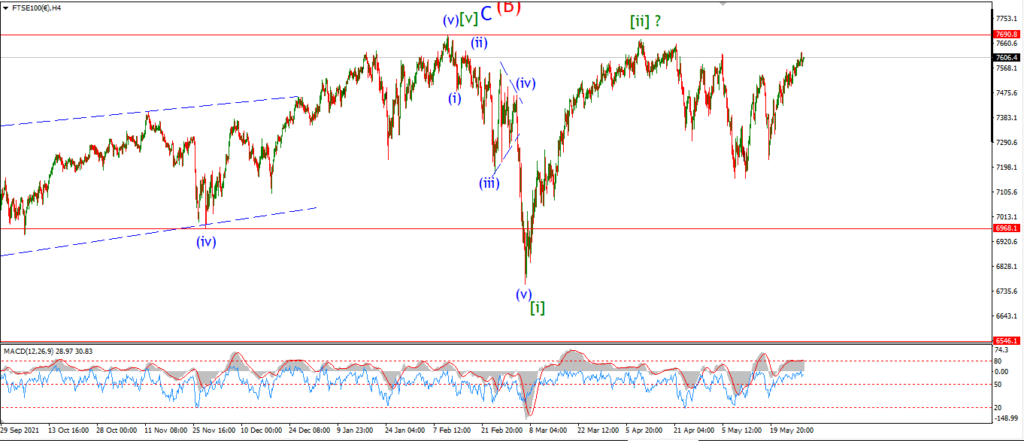
FTSE 100 4hr.

FTSE 100 daily.
….
DAX.
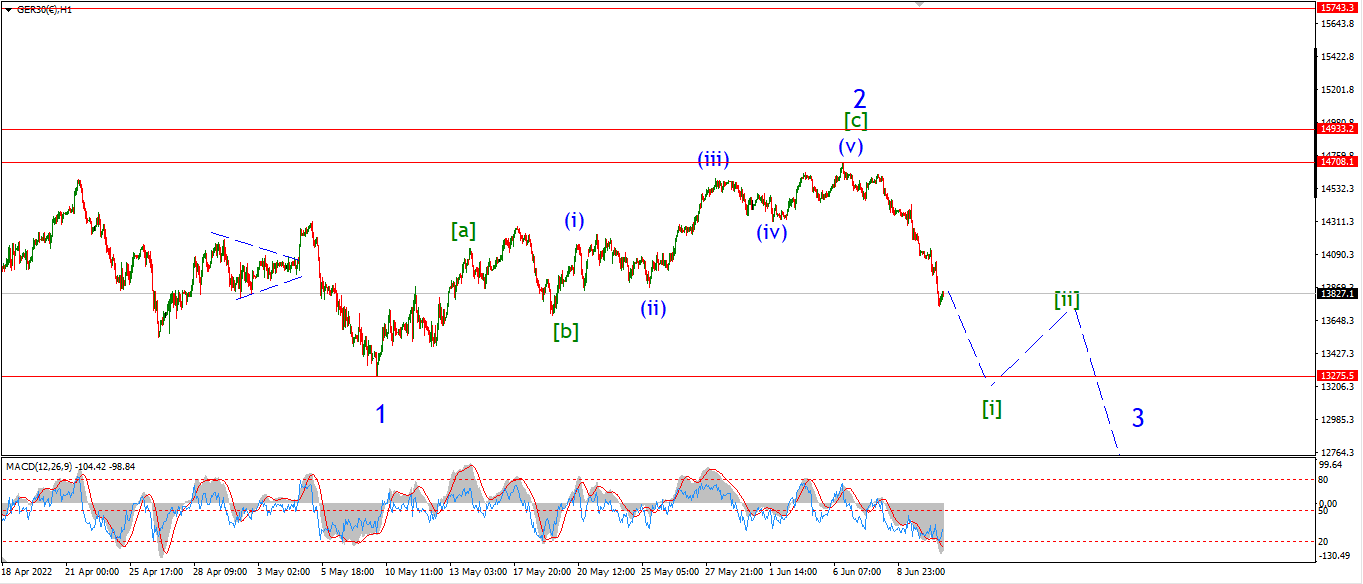
DAX 1hr
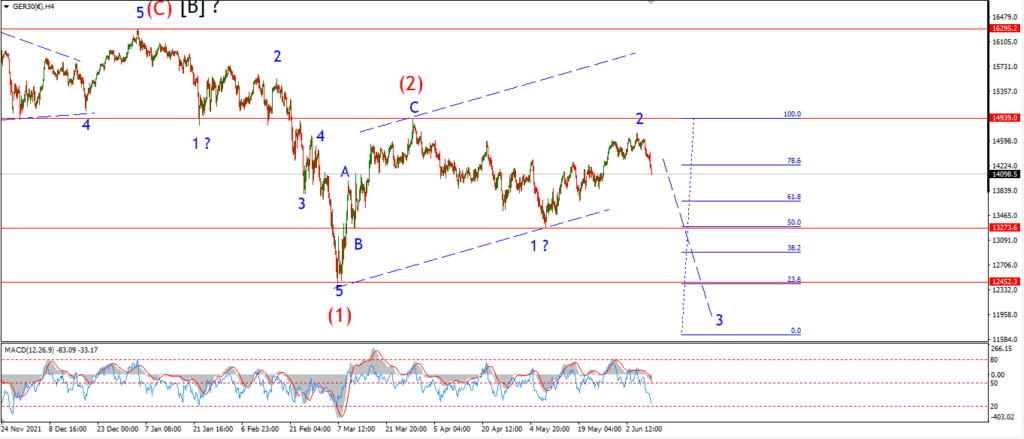
DAX 4hr

DAX daily.
….
NASDAQ 100.
NASDAQ 1hr
NASDAQ 4hr.
NASDAQ daily.
….