
Good evening to you folks, and the Lord’s blessings to you all tonight.
The recession has started, but will not be recognized until much later!
Target Crashes After Cutting Profit Outlook For 2nd Time In Three Weeks Due To Excess Inventory
Shocking Consumer Credit Numbers: Everyone Maxing Out Their Credit Card Ahead Of The Recession
On with the show!
EURUSD.
EURUSD 1hr.
EURUSD 4hr.

EURUSD daily.
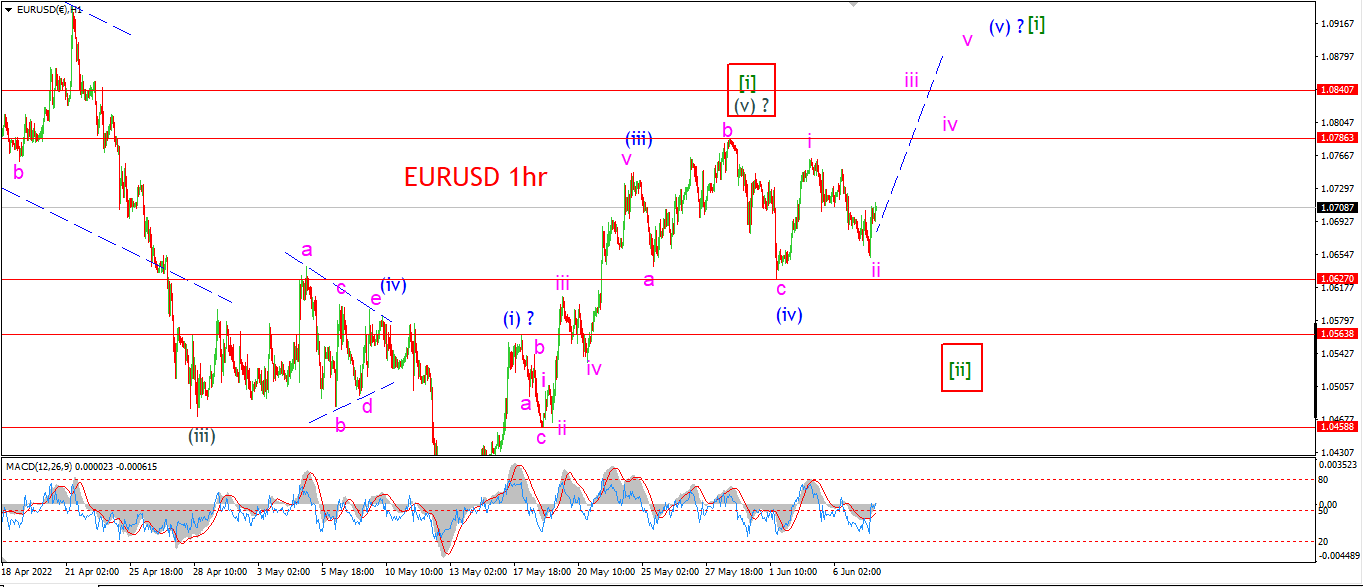
Well another close call here for EURUSD but the price continues to hold above the wave (iv) low at 1.0627.
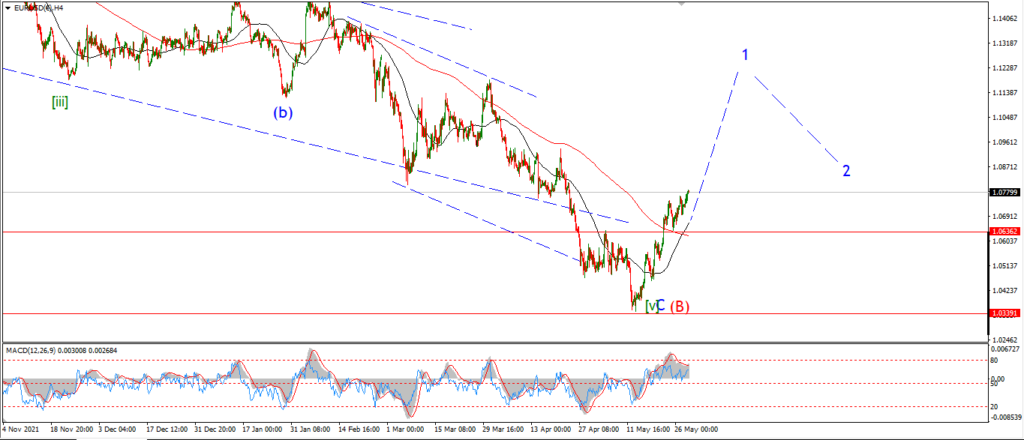
The idea of a rally in wave ‘iii’ of (V) is still on the cards after a spike higher off the session low.
So I am looking for that third wave rally to get going tomorrow and break above the wave ‘b’ high at 1.0786 again to confirm the count.
Tomorrow;
Watch for wave (v) to continue higher and wave ‘iii’ of (v) to break to a new high above 1.0786.
GBPUSD
GBPUSD 1hr.
GBPUSD 4hr.

GBPUSD daily.
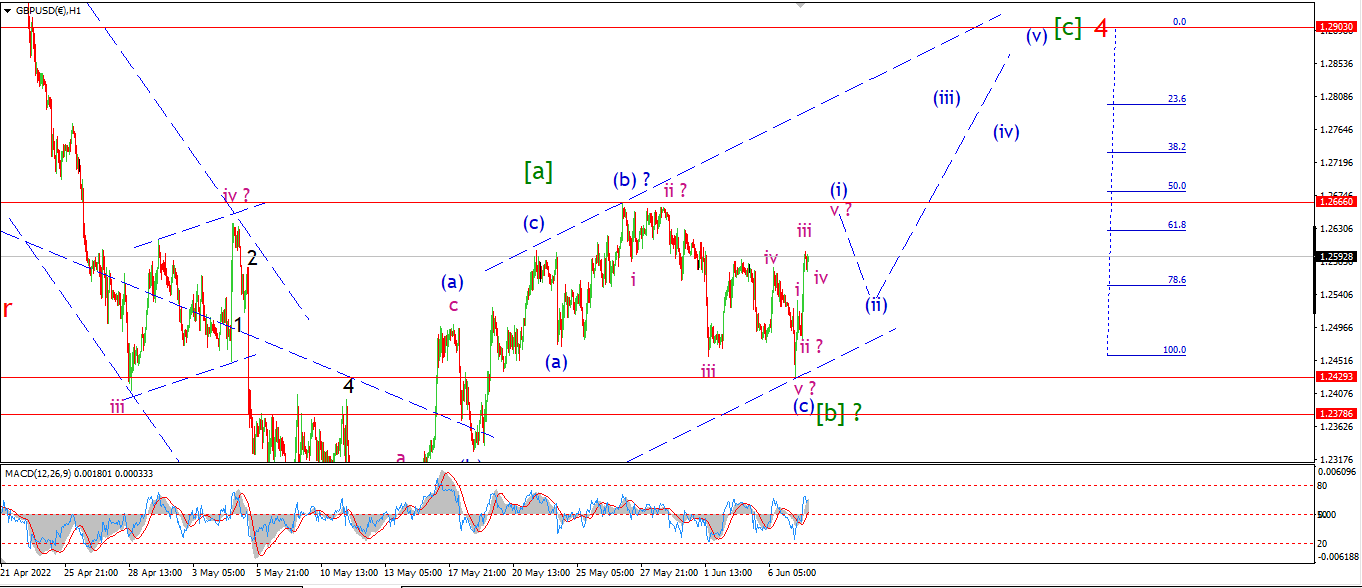
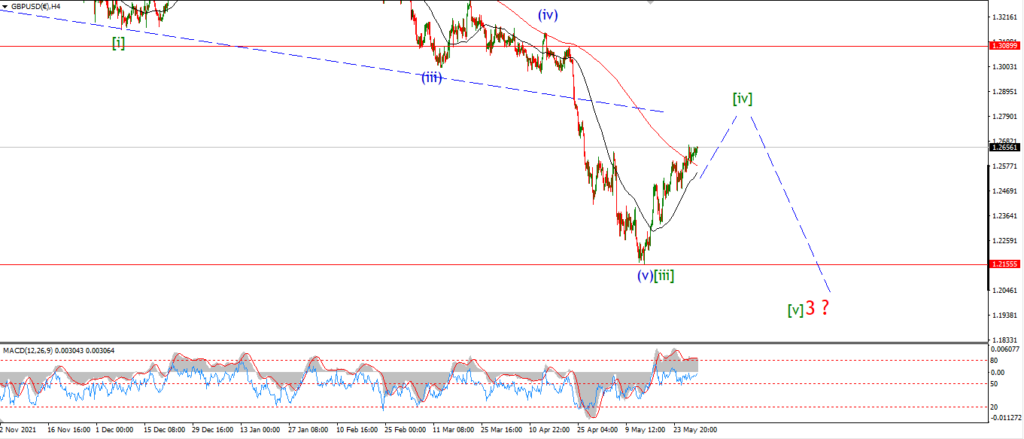
The price has again made another attempt at a break out into wave [c] of ‘4’ today.
Cable broke to a new low early today which invalidated the previous count,
but this evening we have an impulsive rally in place off that low.
So wave (i) of [c] is back in play again.
Tomorrow;
Watch for wave (i) to complete five waves up to break the wave (b) high at 1.2666.
Todays low at 1.2429 must hold.
USDJPY.
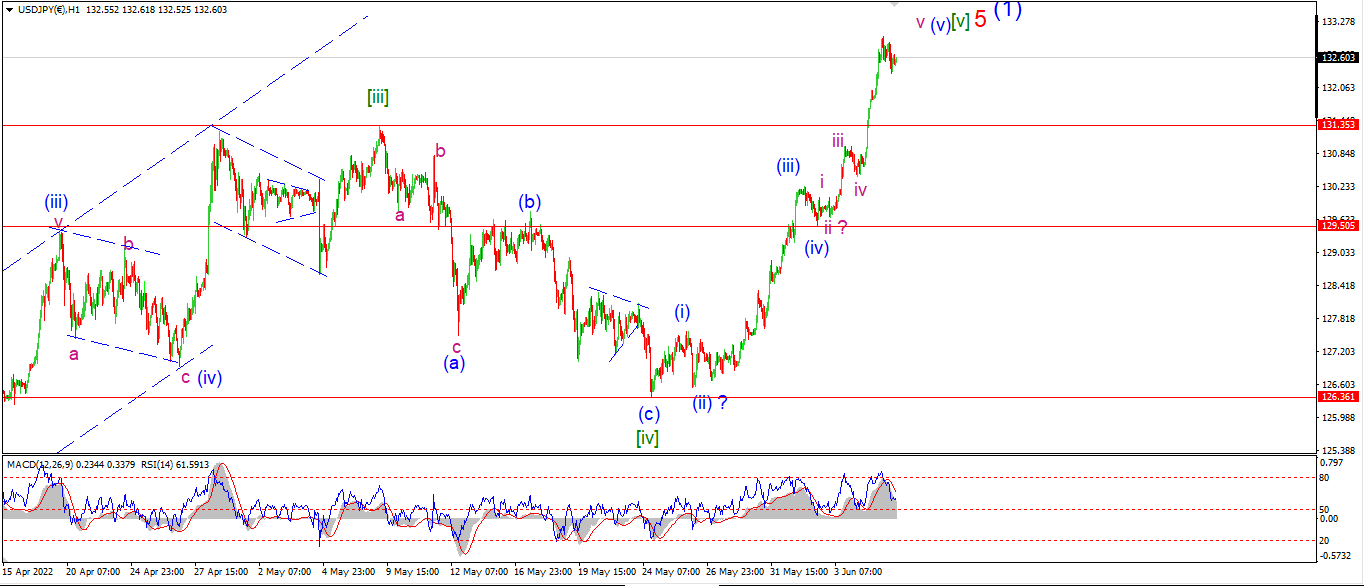
USDJPY 1hr.
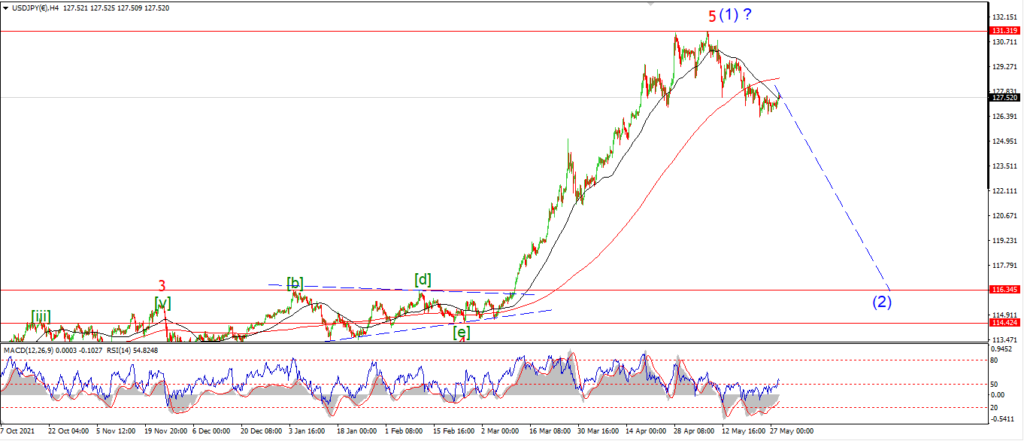
USDJPY 4hr.
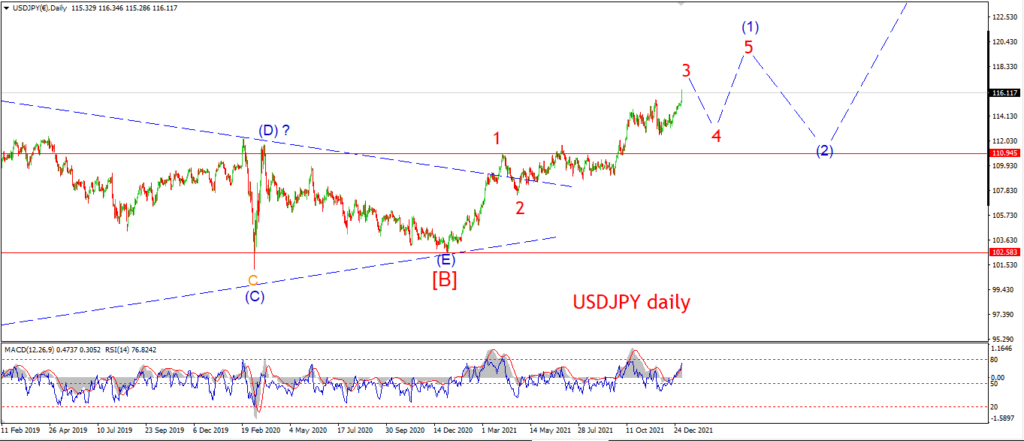
USDJPY daily.
USDJPY defies gravity again today as the price has barely shifted off 20yr highs.
It is hard to believe that 18mths ago this pair was trading at 102,
and all the talk was about the inevitable break of 100 again.
The top in wave (1) that I am looking for does not have any major resistance to target.
So I am trying to follow the internal pattern as best I can in order to pinpoint where this pattern might exhaust itself.
On the hourly chart that final fifth wave does seem to be filled out.
But there is no reaction lower yet to signal the beginning of a reversal pattern.
Tomorrow;
Only a break back below 130.00 again will signal the possible beginning of wave (2).
DOW JONES.
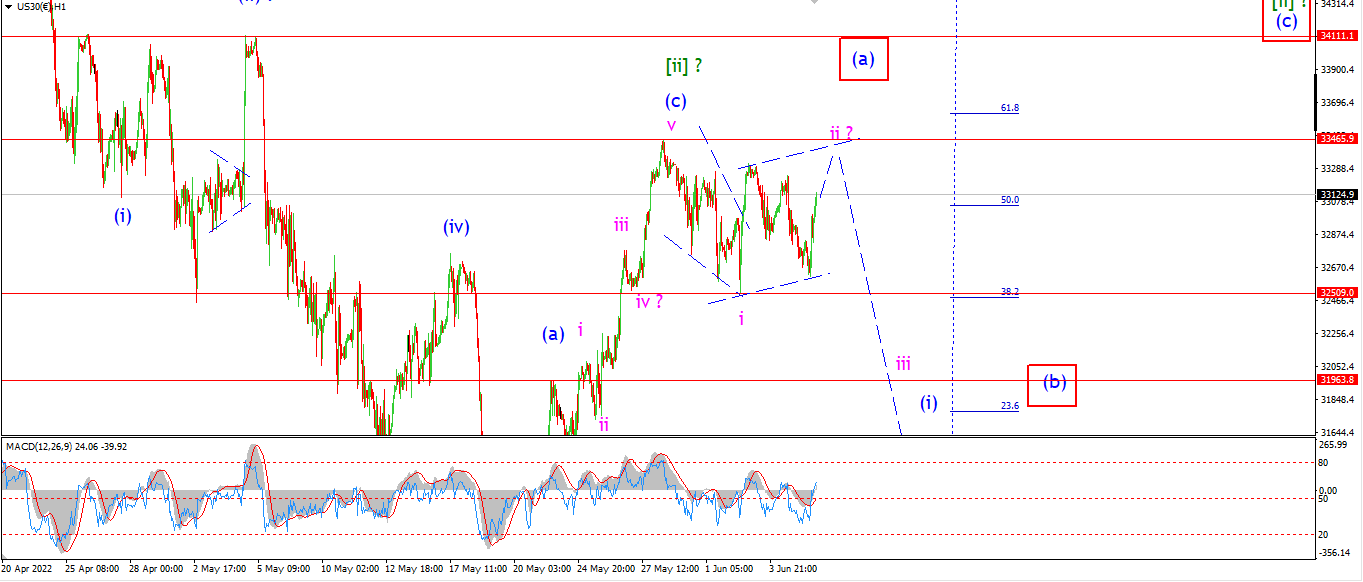
DOW 1hr.
DOW 4hr
DOW daily.
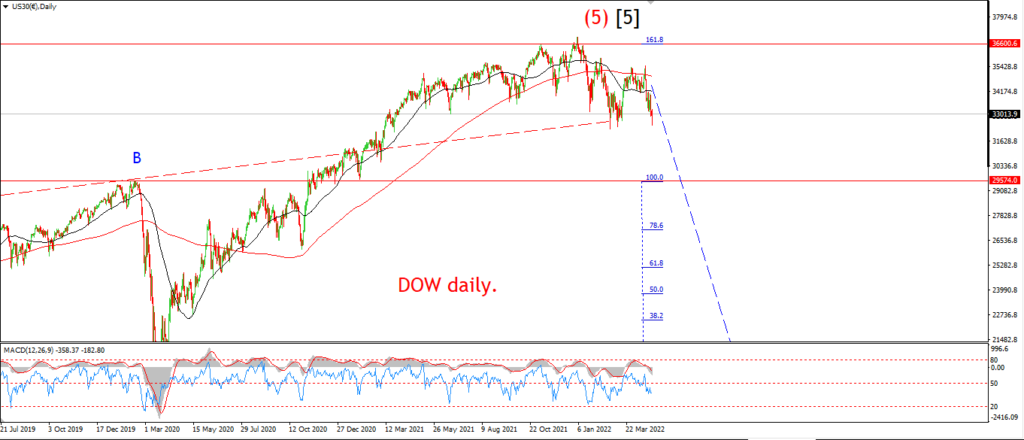
No trapdoor moment yet at least!
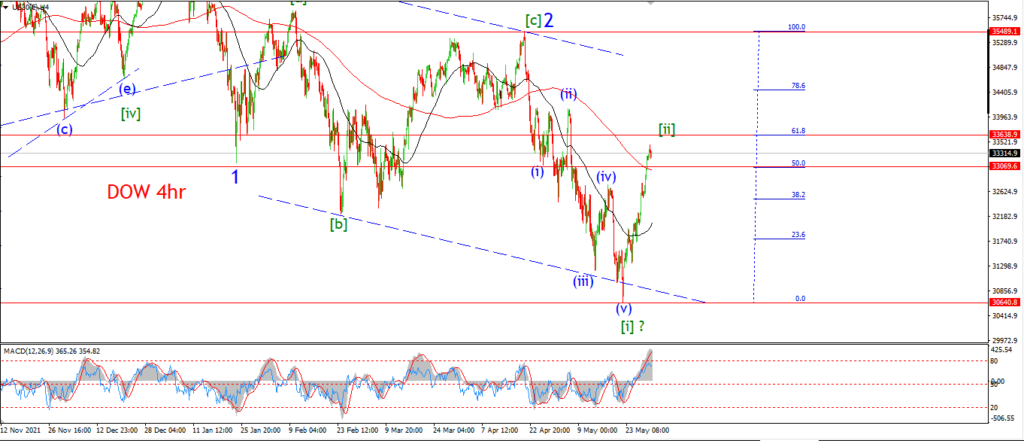
The rally today has opened up the possibility of a zigzag correction higher in wave ‘ii’ of (i).
That gives us a leading diagonal decline in wave ‘i’,
and a correction in wave ‘ii’ as shown.
Wave ‘ii’ must not break above the wave [ii] high at 33272 cash.
That may be a tall order for this market because the margin for error on that wave ‘ii’ top is very tight.
Wave ‘ii’ will have to complete three waves up below that level
and then reverse again immediately for this count to remain valid.
The only viable alternate count that I can see here involves a much larger zigzag correction in wave [ii] that will most likely take the rest of June to complete.
If the market breaks to a new high above that wave [ii] high shown,
then I will have to consider that alternate wave [ii] count as valid.
Tomorrow;
Watch for wave ‘ii’ pink to complete this correction with a break of 33310.
And then reverse lower to break 32500 again and confirm wave ‘iii’ of (i).
GOLD
GOLD 1hr.
GOLD 4hr.
GOLD daily.
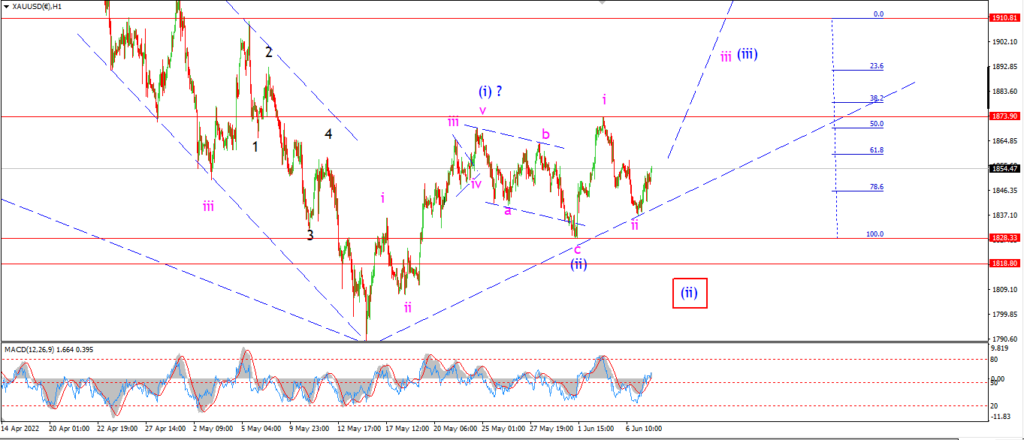
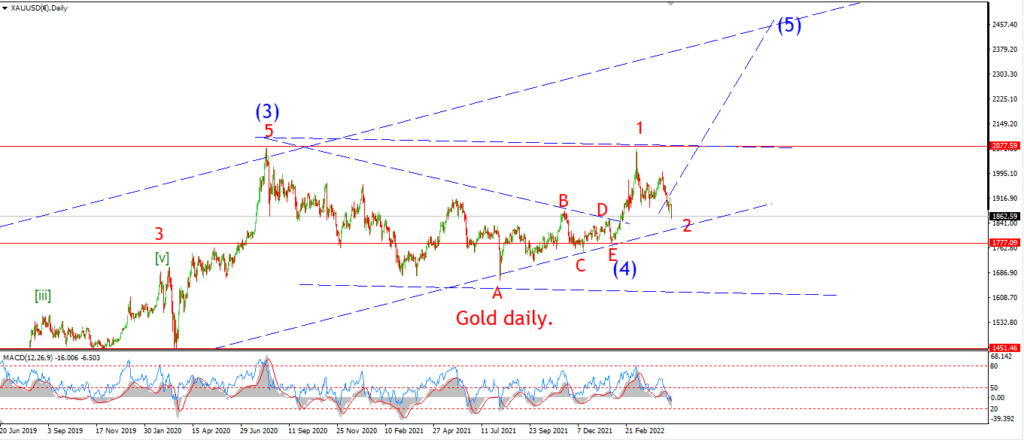
Gold is holding above that 1828 this evening with a reasonable margin so far.
I am hopeful that wave ‘ii’ is now complete at Monday low,
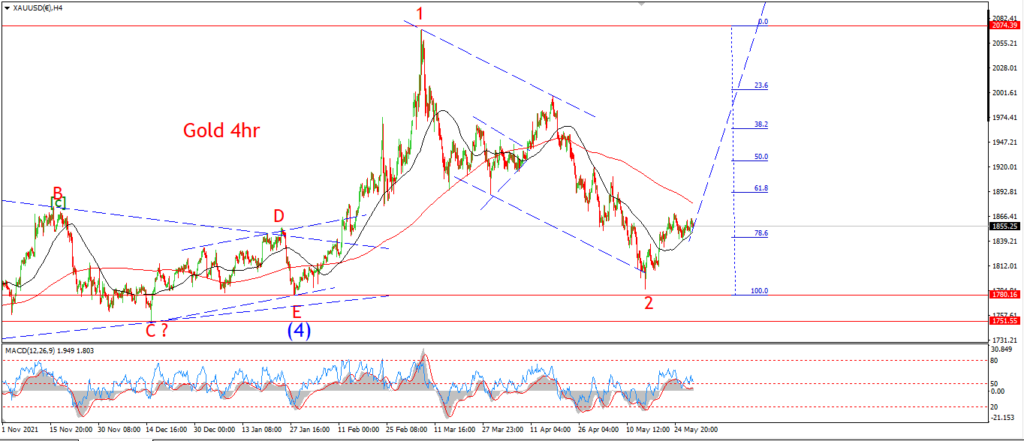
and wave ‘iii’ of (iii) can now begin a sustained rally back above 1950 again.
That size of rally is required now in order to validate wave (iii) of [i],
anything smaller will not be good enough to fit as a third of a third rally.
The minimum target for wave (iii) lies at 1910 again,
where wave (iii) and wave (i) reach equality.
Tomorrow;
Watch for wave ‘ii’ to hold above 1828.
Wave ‘iii’ will be confirmed with a break of 1873.
CRUDE OIL.
CRUDE OIL 1hr.
CRUDE OIL 4hr.
CRUDE OIL daily.
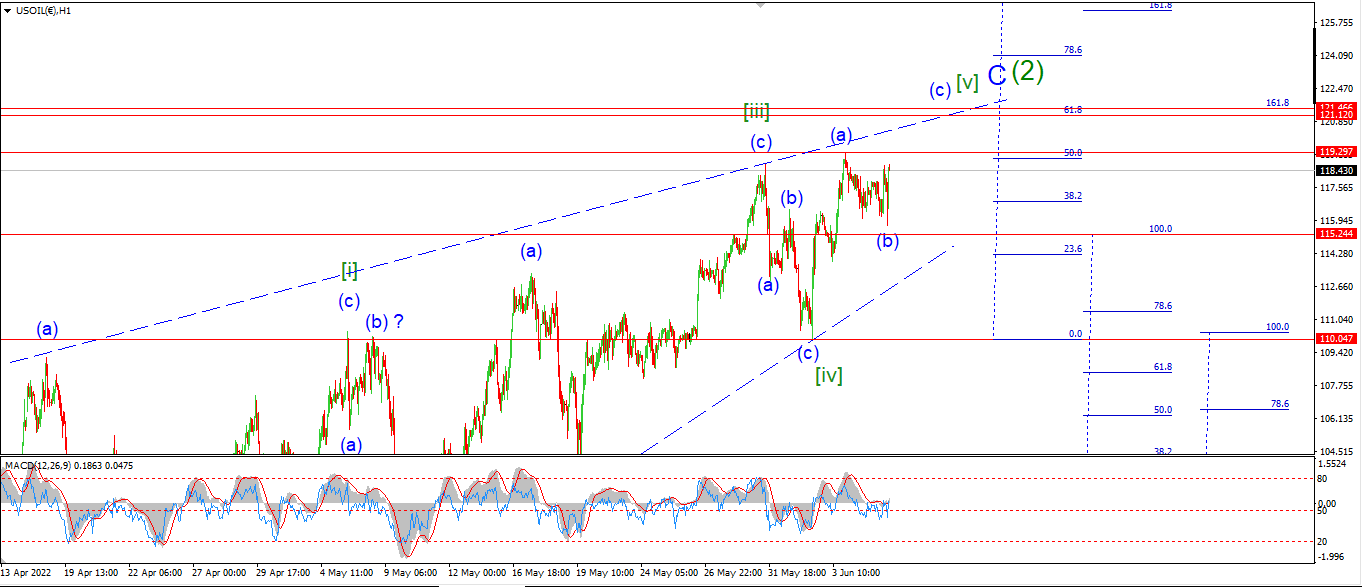
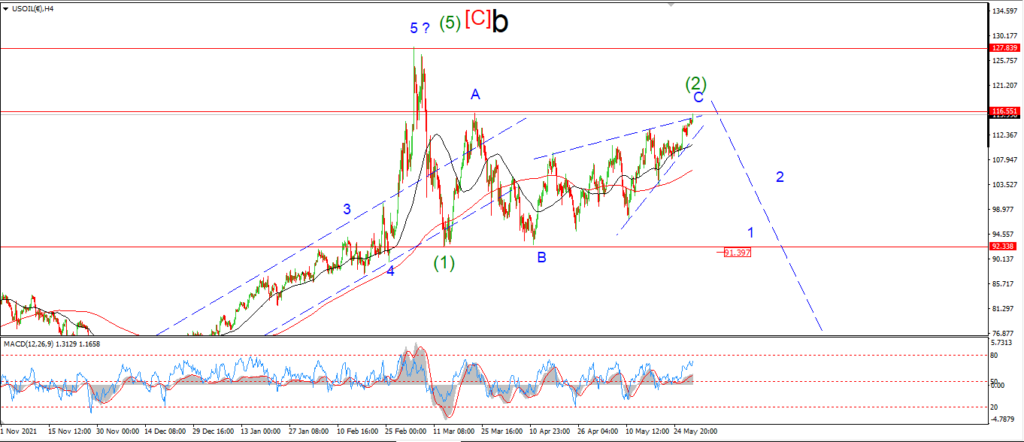
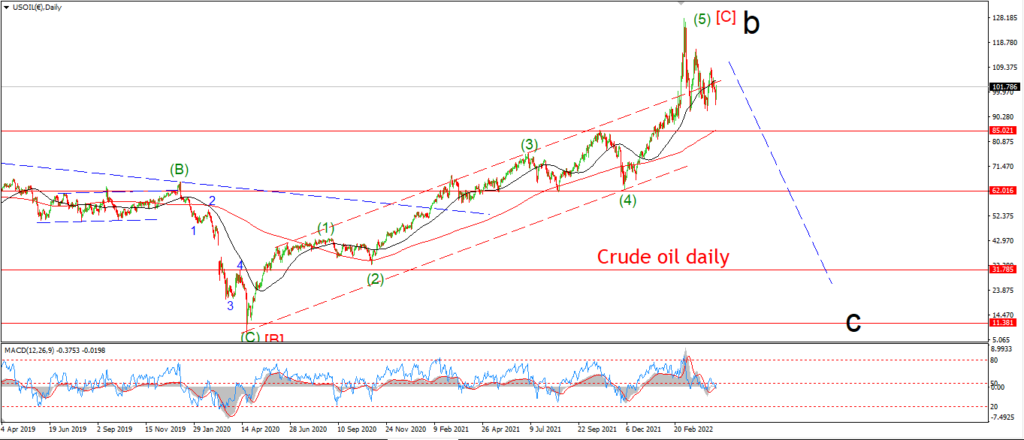
I am starting to see a Fibonacci target cluster form for wave ‘C’ of (2) now.
This method involves projecting the Fibonacci grid of the wave [i] rally at the corrective lows of wave [ii] and wave [iv] to give us a series of levels to watch for a top.
Wave [iii] topped out after breaking above the 100% level of wave [i].
Wave [iv] corrected back to the wave [i] low again.
Wave (v) has already hit the 50% level of the wave [i] rally,
but it seems the pattern is going to break to a new high.
And that is where the cluster of target come in.
119.30 marks the current high of wave (a) of [v].
121.12 marks the 62% level of wave [i] projected off the wave [iv] low.
121.46 marks the 162% extension of wave [i] projected off the beginning of wave [i].
That gives about a $2 target range for wave (c) of [v] of ‘C’ to hit and then I will look for a top in wave (2) again.
Lets see how the price reacts to that target area tomorrow.
S&P 500.
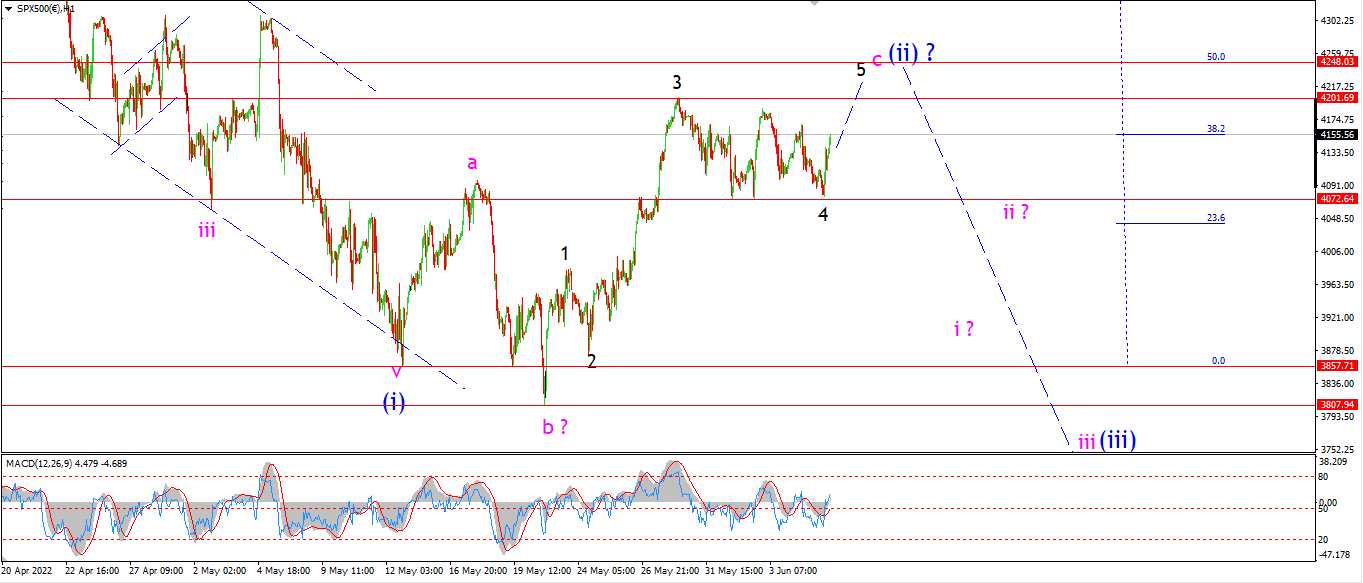
S&P 500 1hr
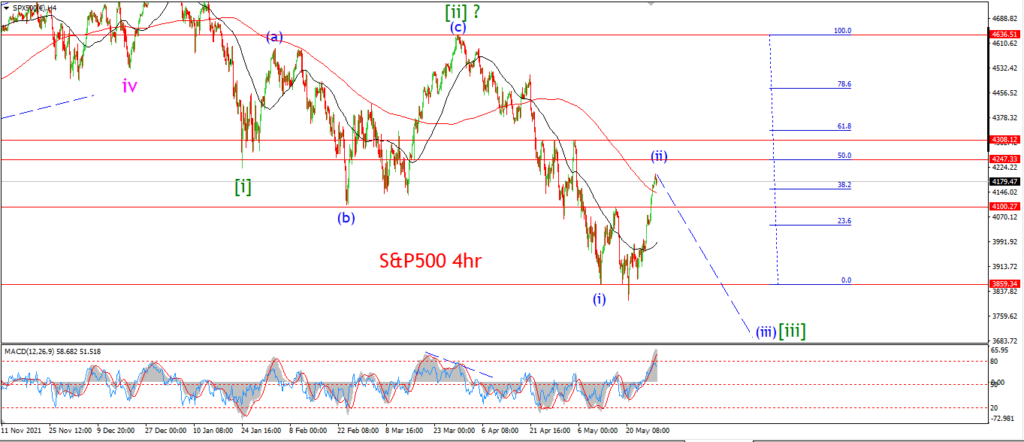
S&P 500 4hr
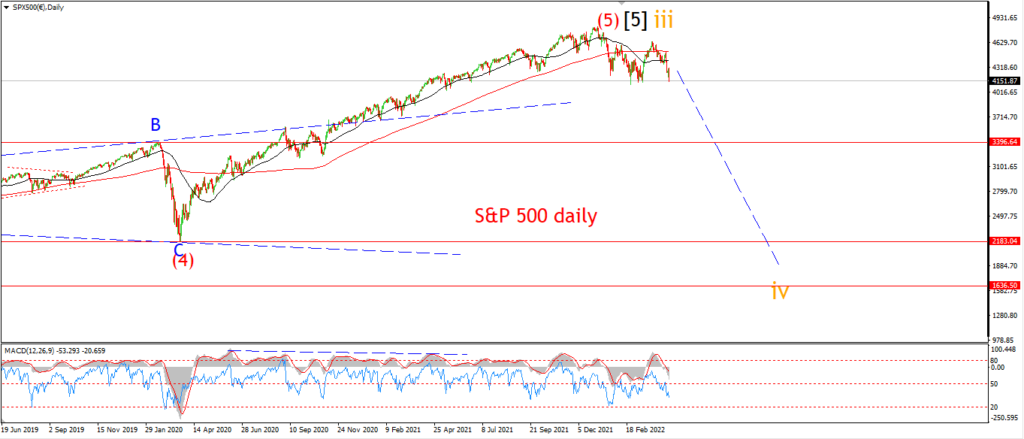
S&P 500 daily.
The market seems intent on making a new high for this rally above 4200 again.
It is now very hard to make the bearish argument for this pattern after the rally this evening.
If this new count for wave ‘c’ is correct,
then the recent correction marks wave ‘4’ of ‘c’.
With wave ‘5’ of ‘c’ of (ii) left to top out this whole correction in wave (ii).
Tomorrow;
Watch for wave ‘5’ to top out a five wave rally in wave ‘c’ by tomorrow evening.
I would still like to see the next leg down into wave (iii) of [iii] begin this week.
SILVER.
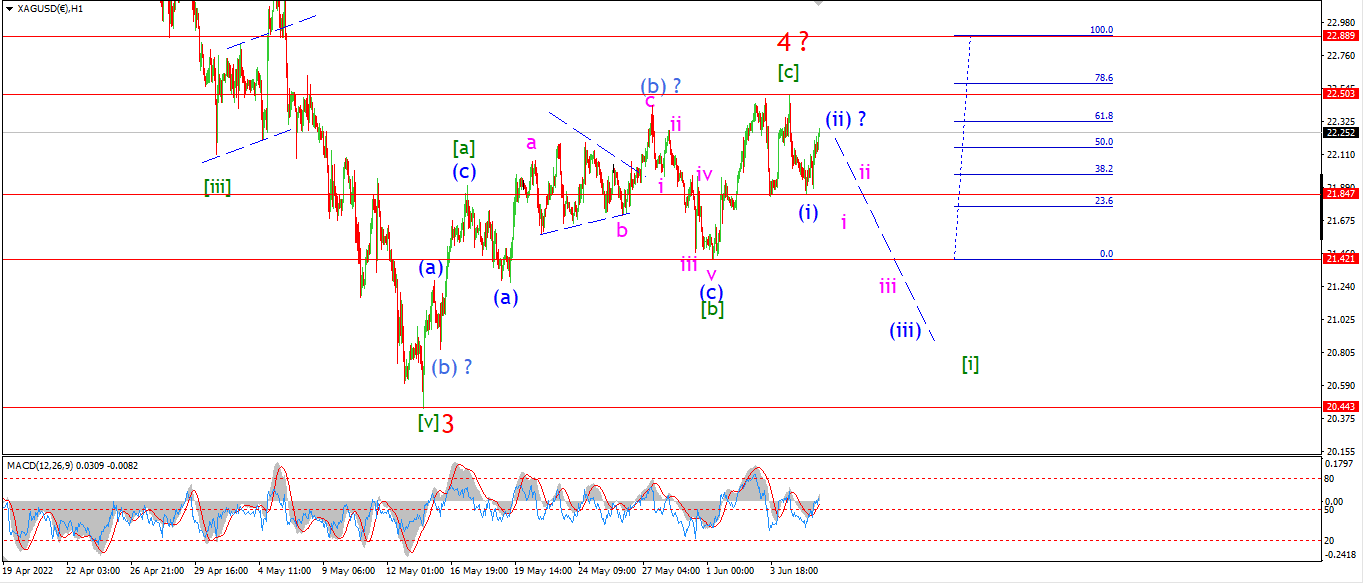
SILVER 1hr
SILVER 4hr.
SILVER daily.
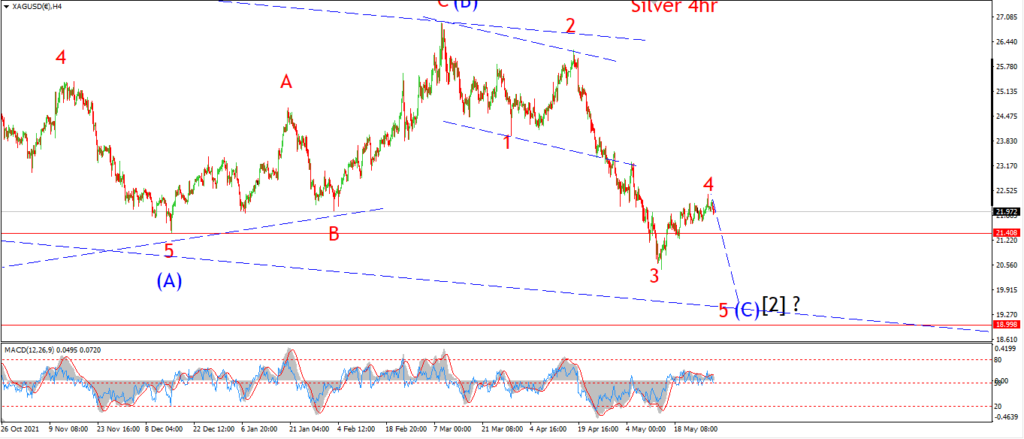
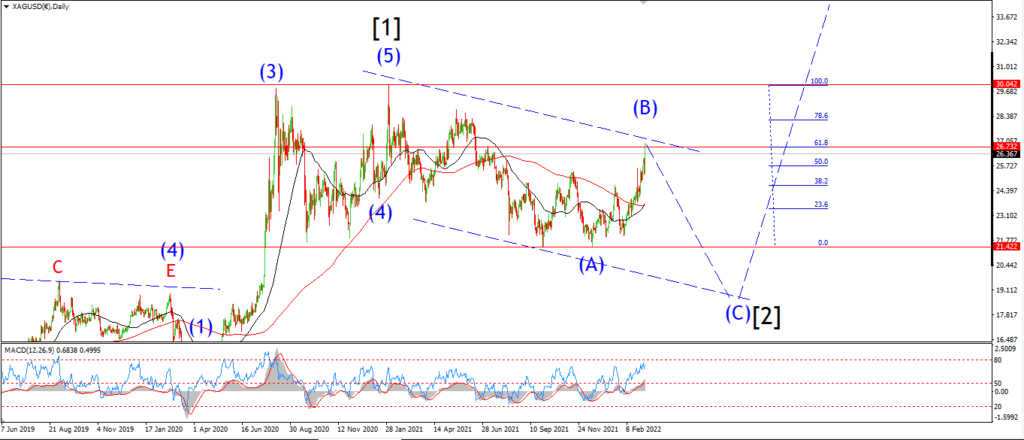
The action in silver today is viewed as a correction higher in wave (ii) of [i].
This rally must now stop and fall again into wave (iii) of [i]tomorrow for this wave count to remain valid.
A break of the wave [b] low at 21.42 again will favor this bearish count for sure.
Tomorrow;
Watch for wave (iii) to begin pretty quickly tomorrow.
a break of 21.80 again will signal wave ‘i’ of (iii) is underway.
BITCOIN
BITCOIN 1hr.
BITCOIN 4hr.

BITCOIN daily.
….
FTSE 100.
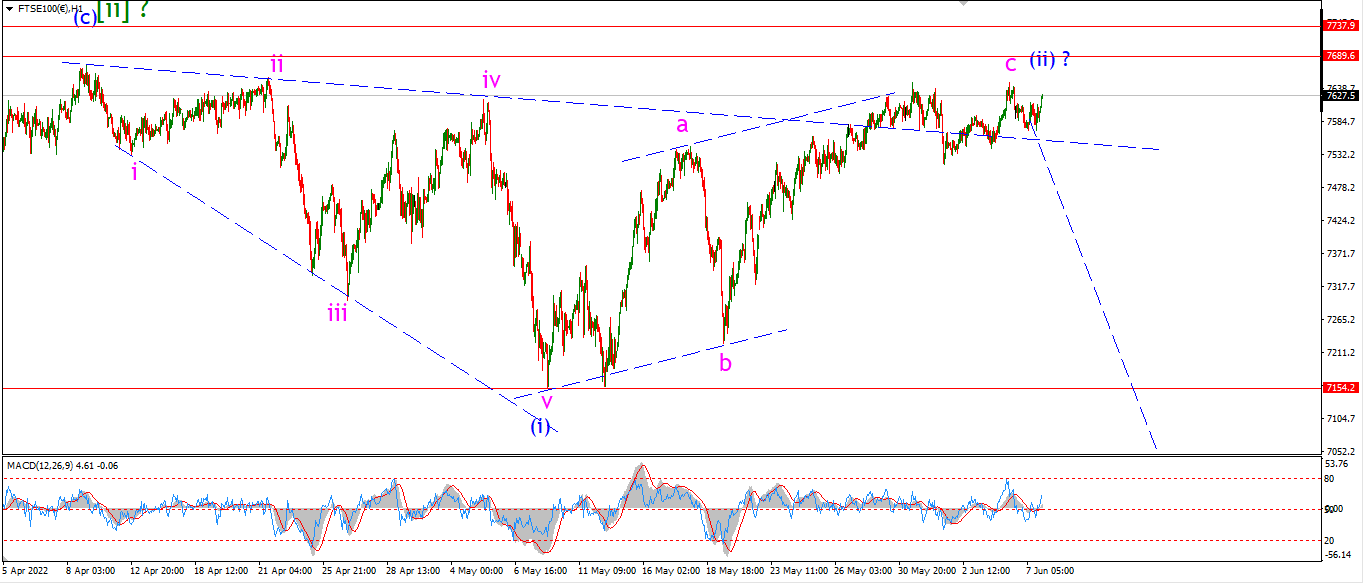
FTSE 100 1hr.
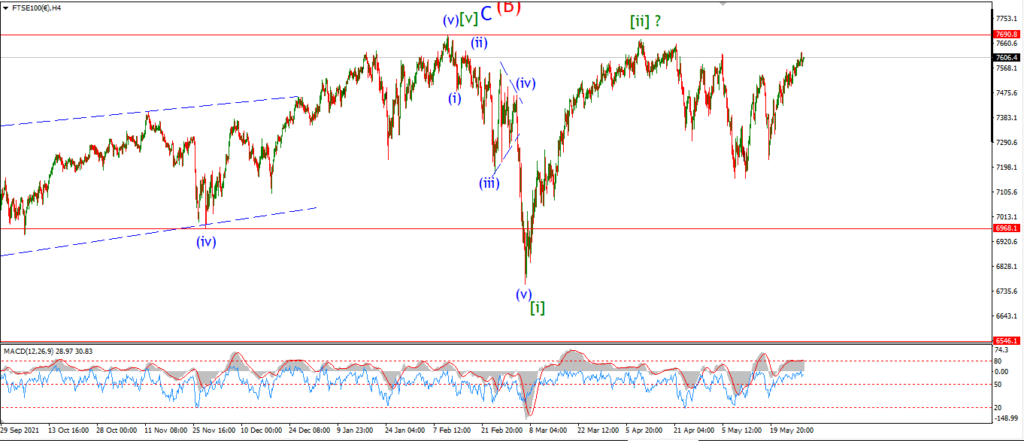
FTSE 100 4hr.

FTSE 100 daily.
….
DAX.
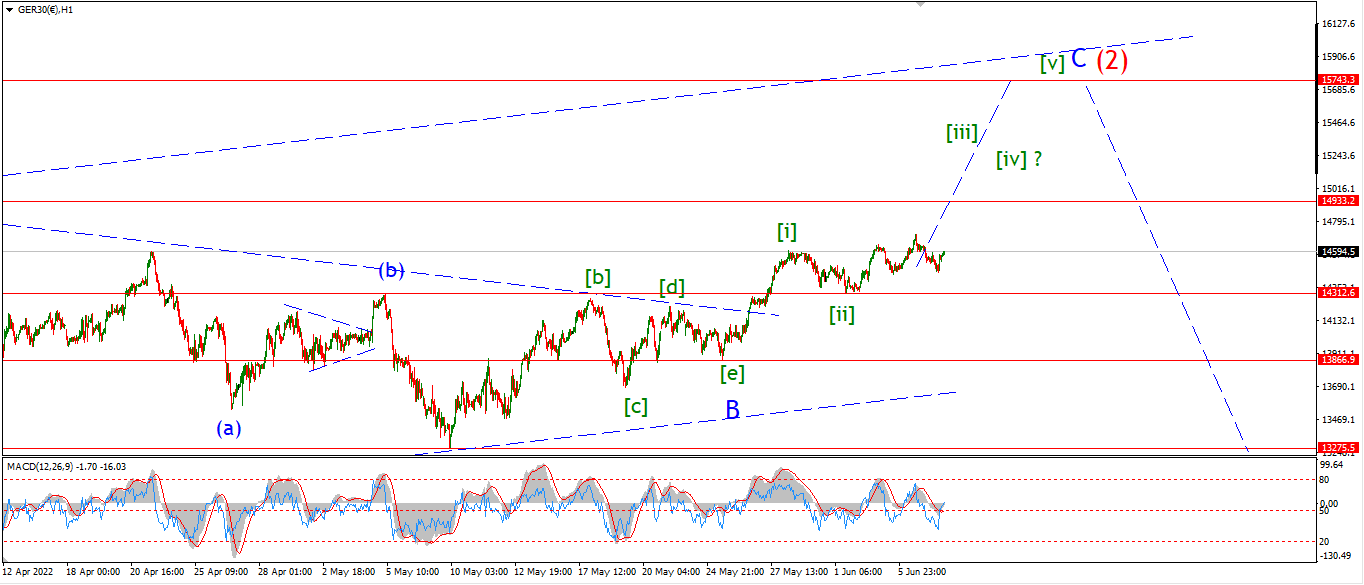
DAX 1hr
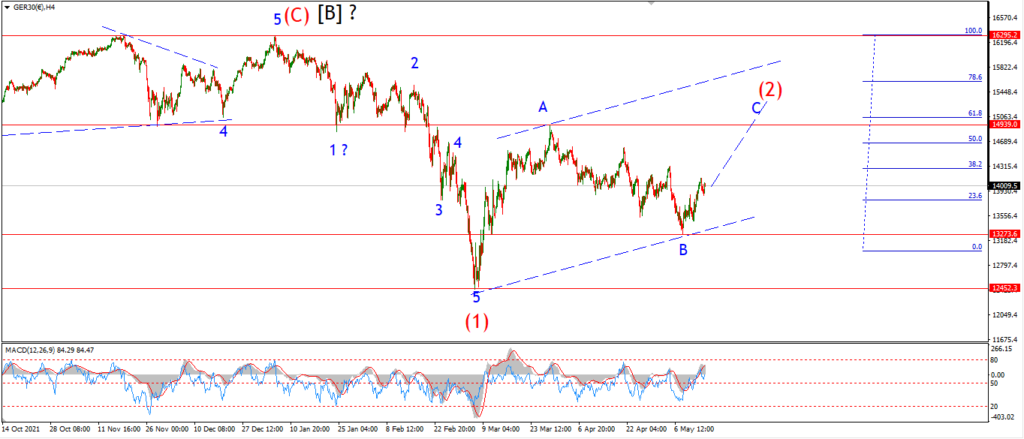
DAX 4hr

DAX daily.
….
NASDAQ 100.
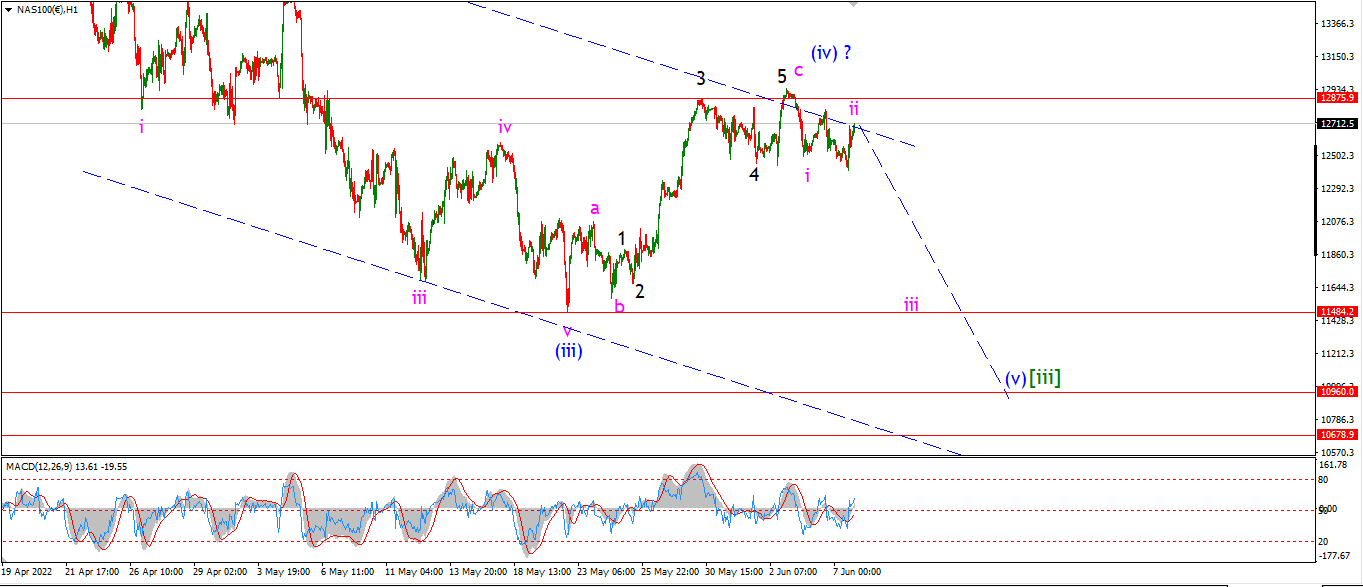
NASDAQ 1hr
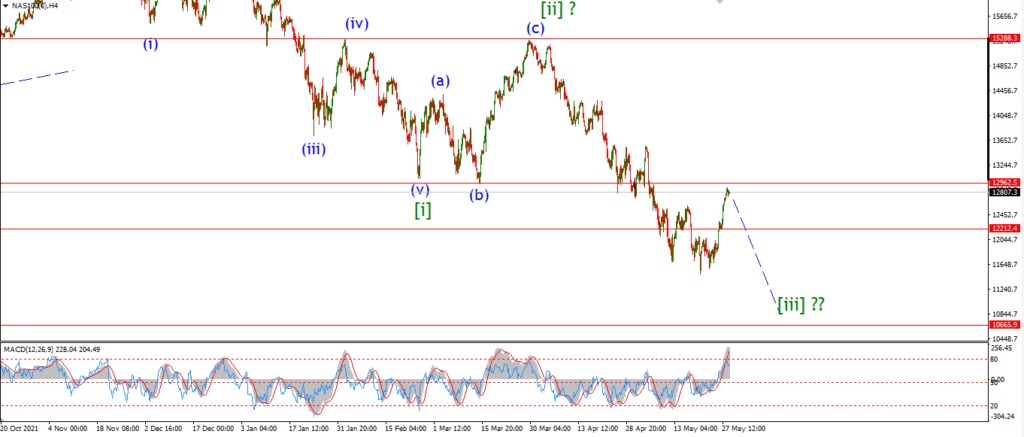
NASDAQ 4hr.
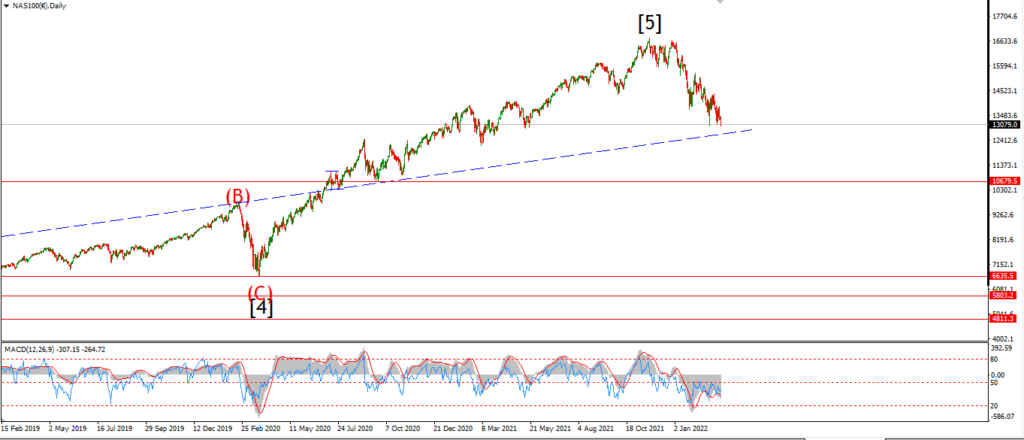
NASDAQ daily.
….