
Good evening to you all folks, and the Lord’s blessings to you all tonight.
I did not realize that it was a public holiday in the U.S today, probably because I don’t live there!
Because of that, the markets in general were very thin on volume and the action is muted to say the least.
So there is very little to comment on in terms of the development of the patterns today to be honest.
I suppose we can call this chart update a primer for the week ahead.
EURUSD.
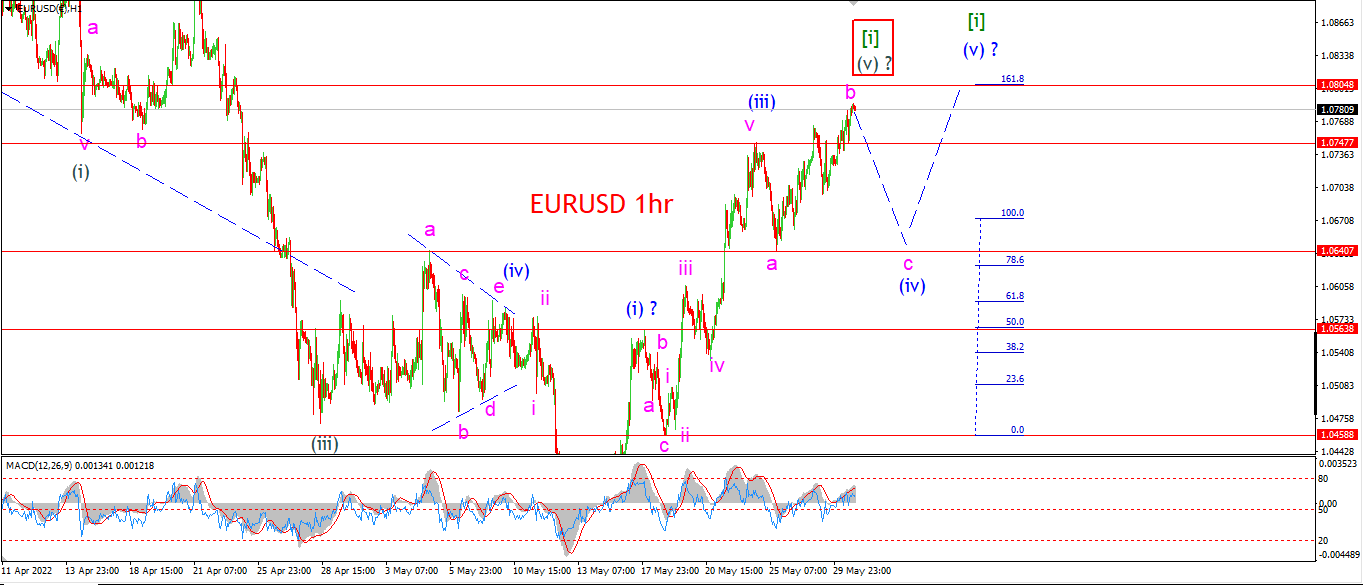
EURUSD 1hr.
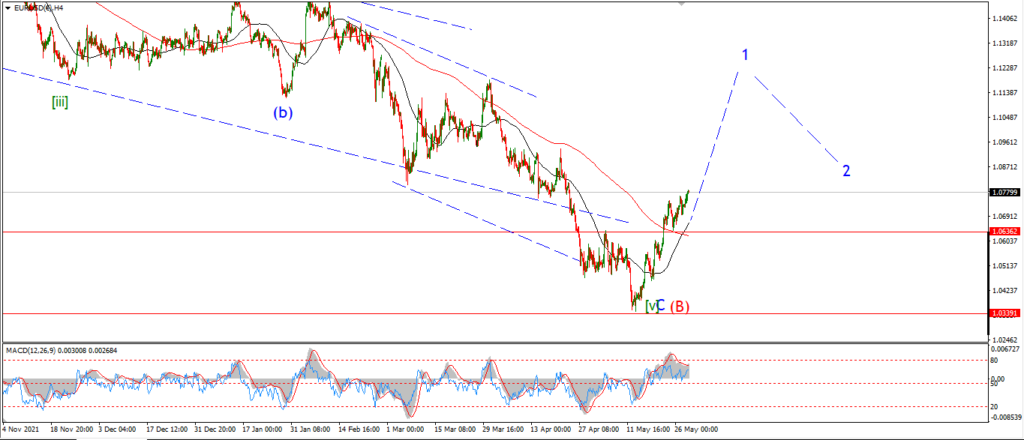
EURUSD 4hr.

EURUSD daily.
There is an argument to be made that this new top is actually wave ‘b’ of an expanded flat correction in wave (iv).
The internal pattern of wave ‘b’ is definitely corrective looking.
So I do expect wave ‘c’ to take the price lower tomorrow and break 1.0640 when complete.
GBPUSD
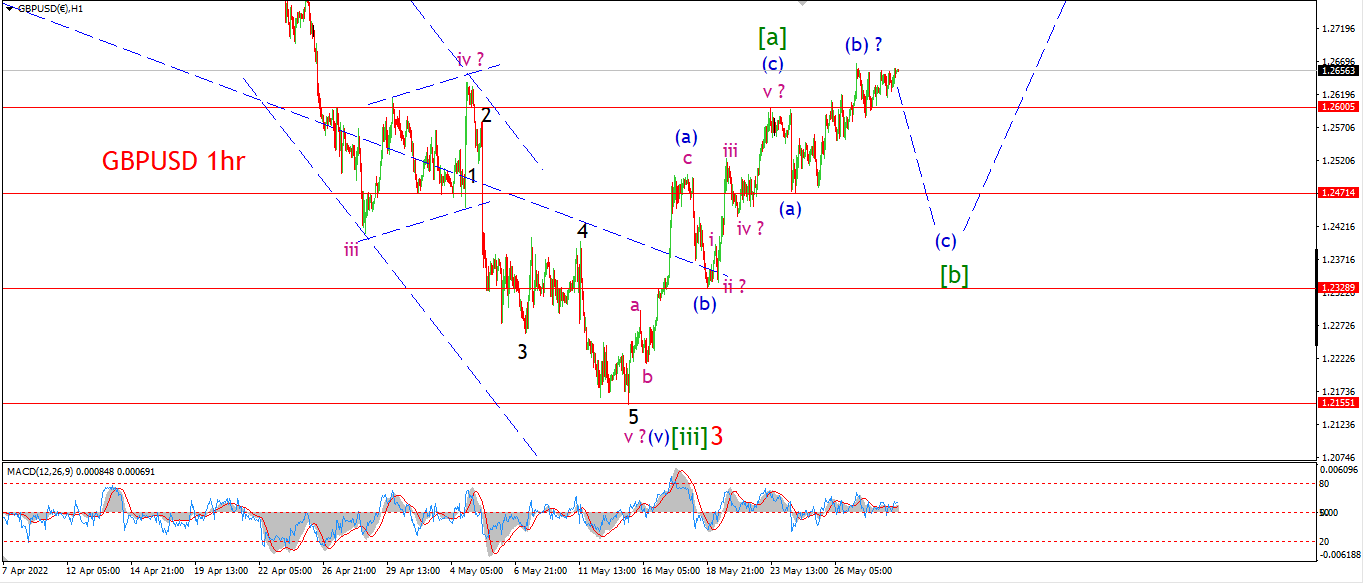
GBPUSD 1hr.
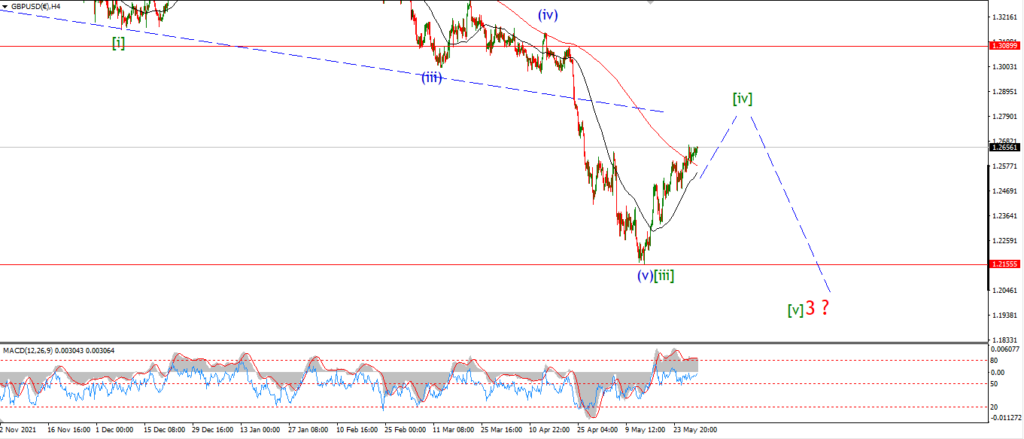
GBPUSD 4hr.

GBPUSD daily.
I am suspicious of the action in cable also.
This new high does not have the characteristics of a new impulsive move.
Rahter it is more like an expanded flat wave (b) of [b] as shown.
It is hard to say if wave (b) is done here yet,
but much like EURUSD,
I suspect wave (c) will fall beck below the wave (a) low at 1.2471 over the coming days.
USDJPY.
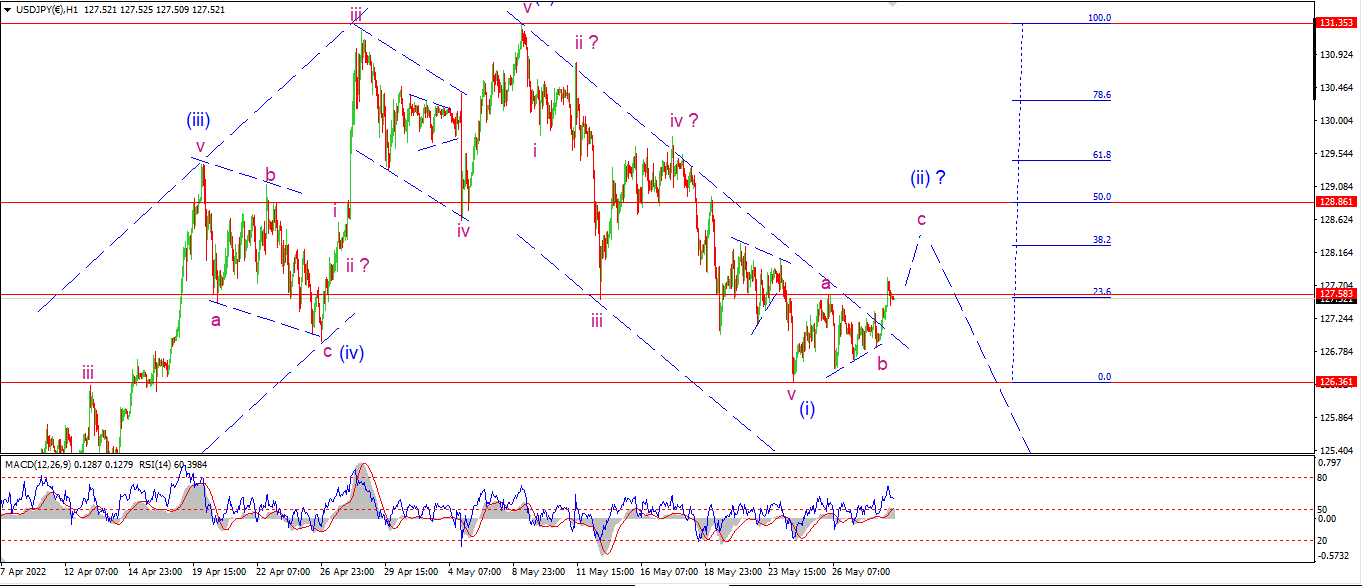
USDJPY 1hr.
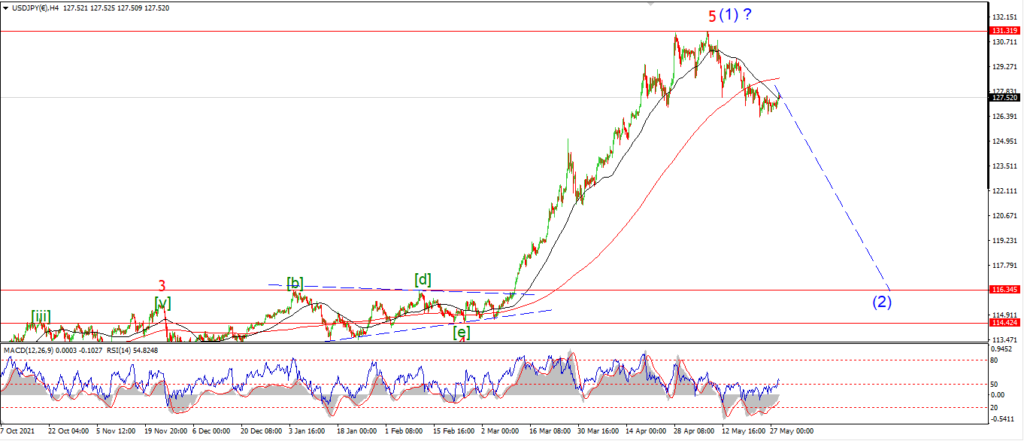
USDJPY 4hr.
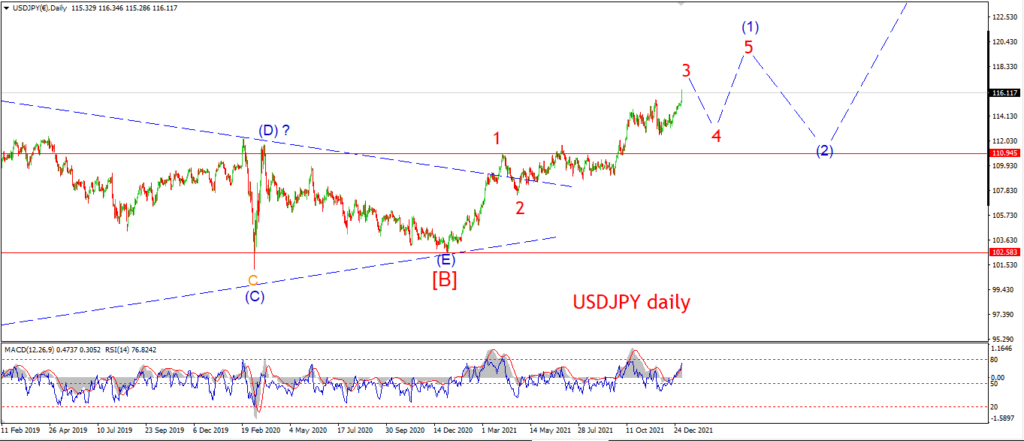
USDJPY daily.
USDJPY did rise out above that wave ‘a’ top at 127.58 today.
This action has achieved the minimum level for wave ‘c’ of (ii).
But if this a second wave correction as shown,
then we would usually see a correction towards the 50% retracement area.
So wave (ii) is still a little shallow for my liking.
Wave ‘c’ should continue higher towards 128.90 for the next few sessions.
DOW JONES.
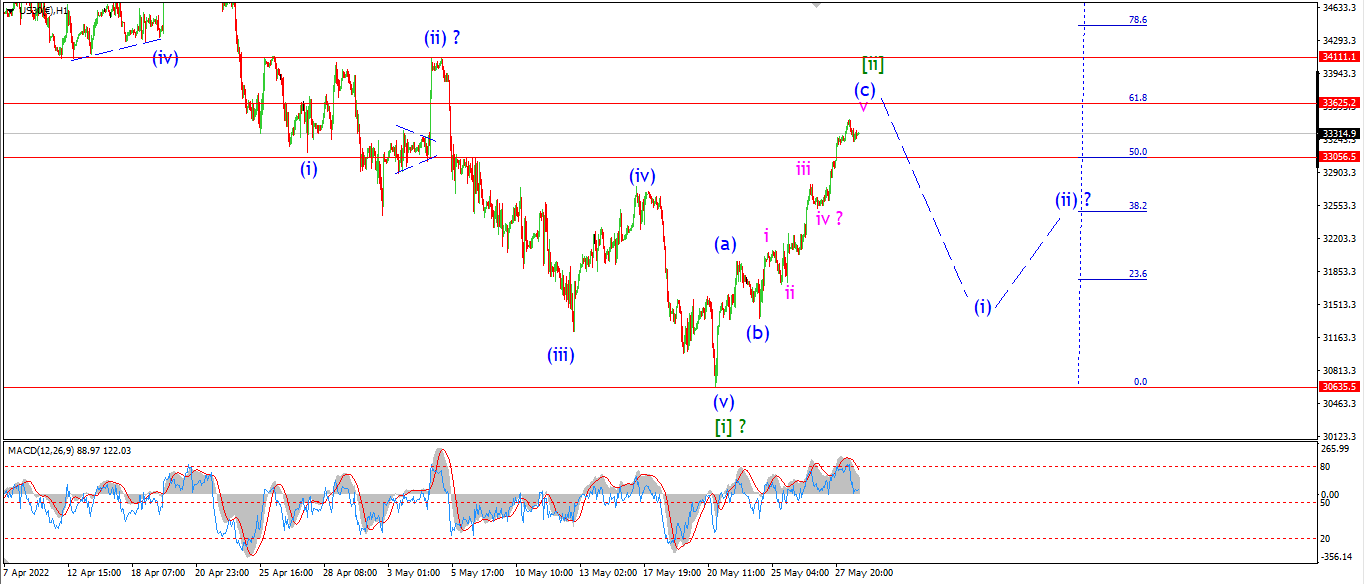
DOW 1hr.
DOW 4hr
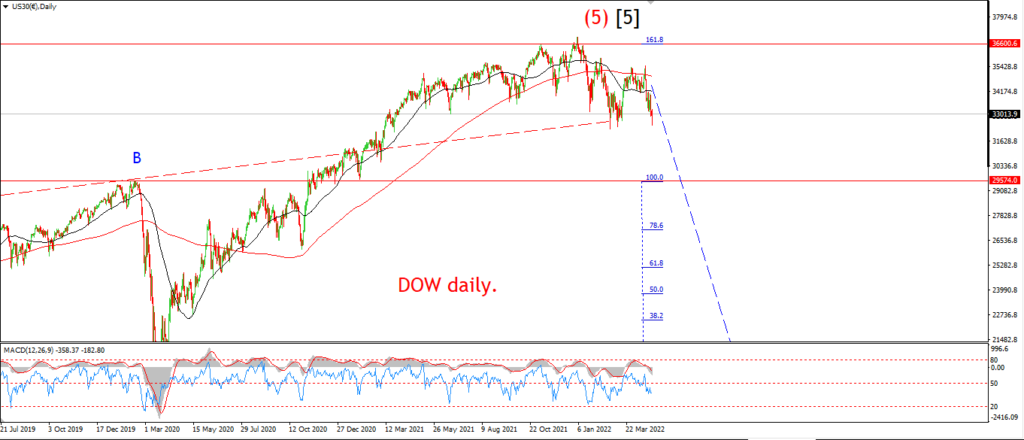
DOW daily.
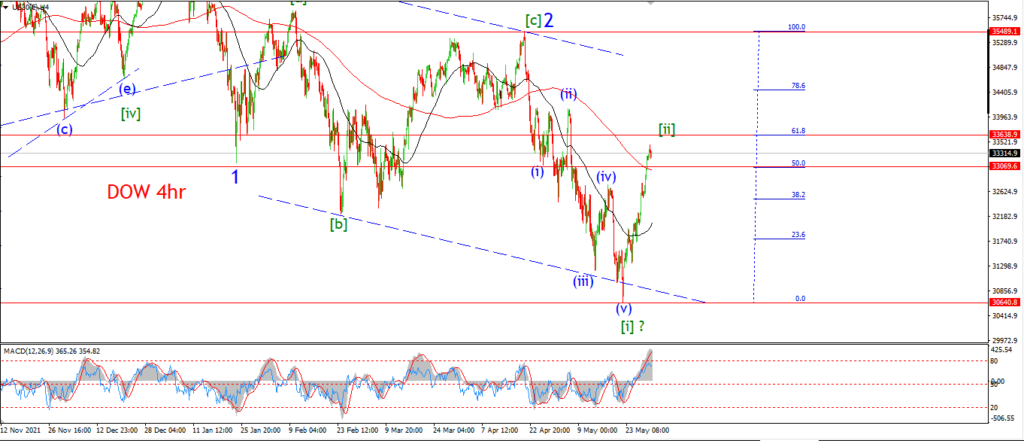
I have updated the count in the dow today to show that alternate wave [i] and [ii] scenario.
Take a look at the 4hr chart to see what I am thinking.
The rally last week was fierce for sure,
but I view this as a bear market rally in a second wave.
And if we are honest,
the fastest and most fierce rallies always happen in bear markets!
So from that point of view at least,
this rally fits the picture.
The rally has taken the market back between the 50% and 62% retracement levels now,
so we are right in the territory where a reversal lower should begin in wave [iii].
Watch for the initial spike lower to begin tomorrow in wave (i) of [iii].
GOLD
GOLD 1hr.
GOLD 4hr.
GOLD daily.
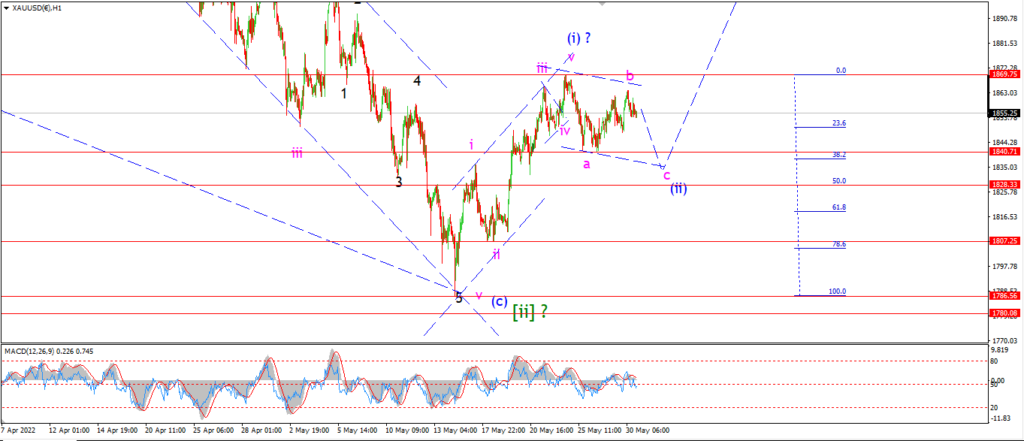
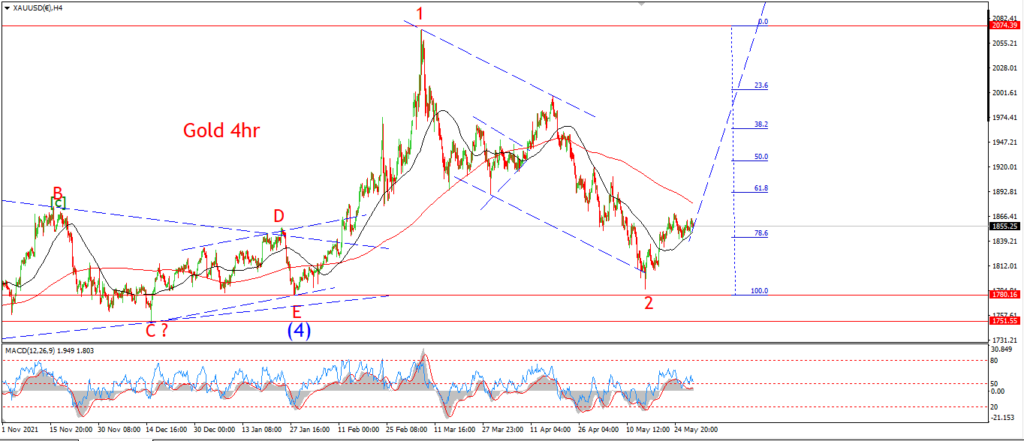
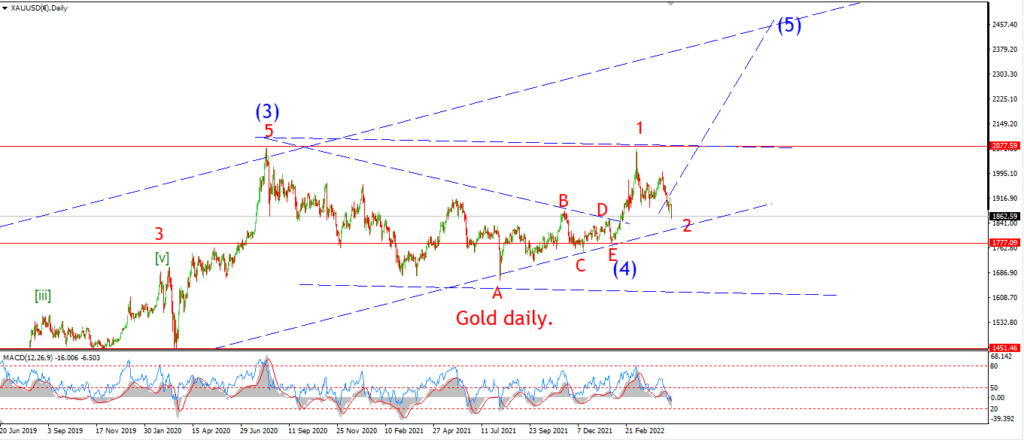
Gold is stuck in a second wave correction here,
and I expect this correction to close out this week with a clear higher low at wave (ii).
1828 marks the 50% retracement of wave (i),
so that level is an ideal target for wave (ii) to end.
Wave ‘c’ of (ii) must break 1840 at a minimum.
CRUDE OIL.
CRUDE OIL 1hr.
CRUDE OIL 4hr.
CRUDE OIL daily.
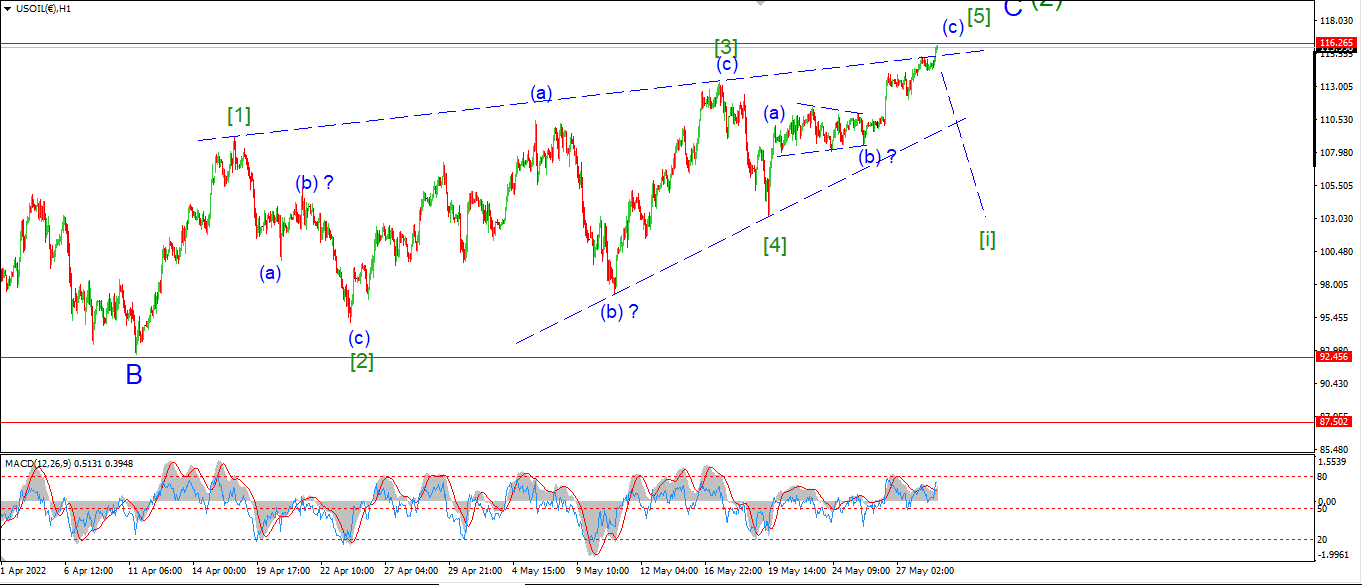
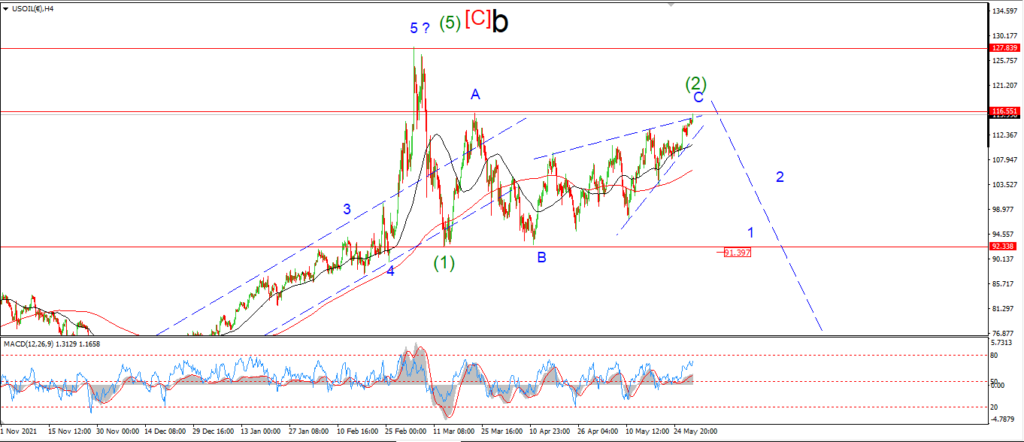
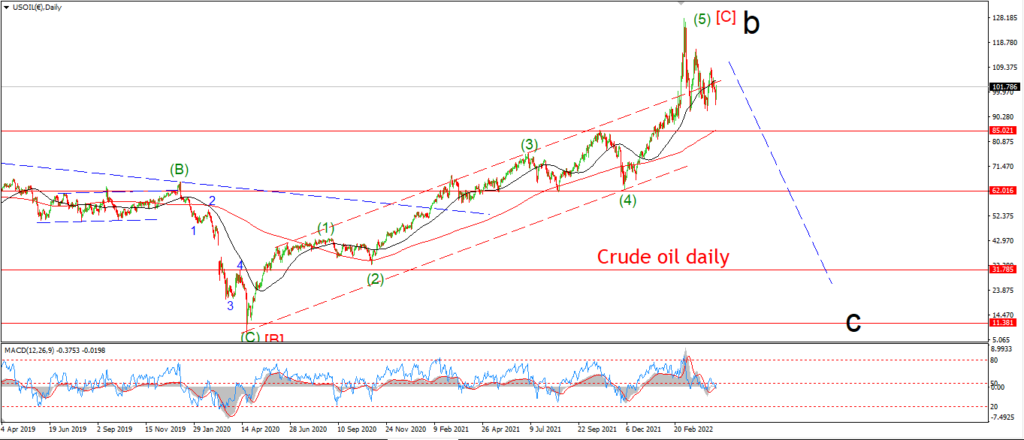
Crude has almost broken that invalidation line at 116.26 today and with that I have switched to that alternate count this evening.
It is a similar count but the action is labelled at one degree higher than last week.
So this ending diagonal rise in happening in wave ‘C’ of (2).
And the pattern in wave ‘C’ is pretty close to complete here with wave [5] of ‘C’ now showing a clear three wave internal structure.
All that we need now is an impulsive move lower to signal wave [i] down is underway.
And that is what I will be looking for today.
S&P 500.
S&P 500 1hr
S&P 500 4hr
S&P 500 daily.
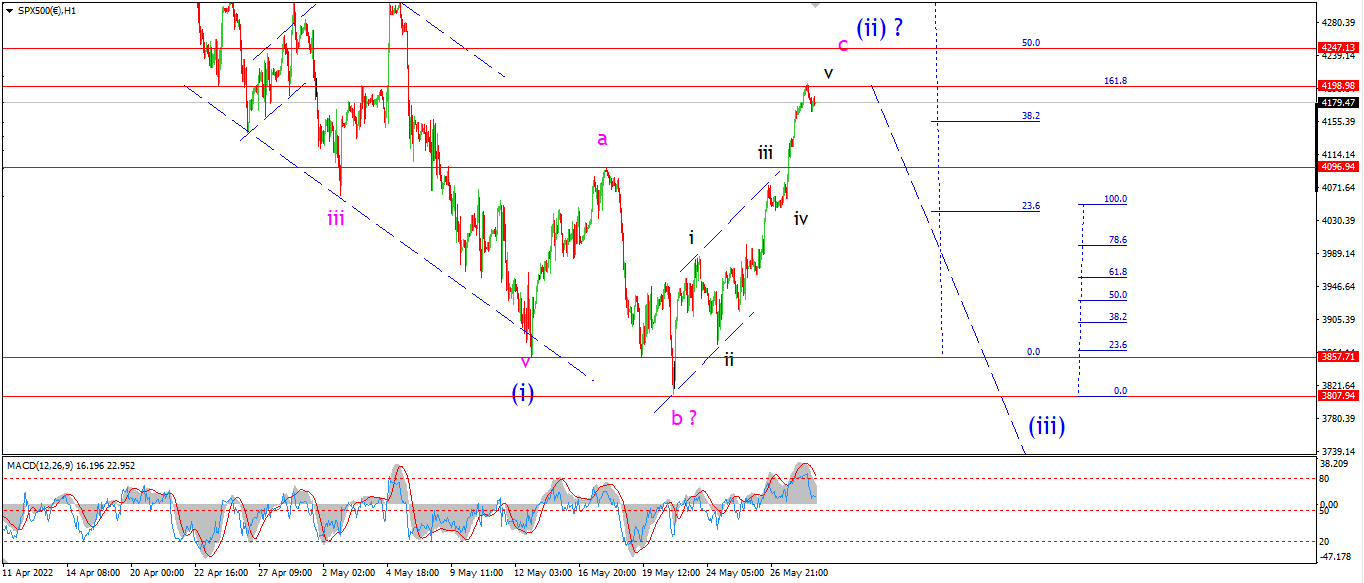
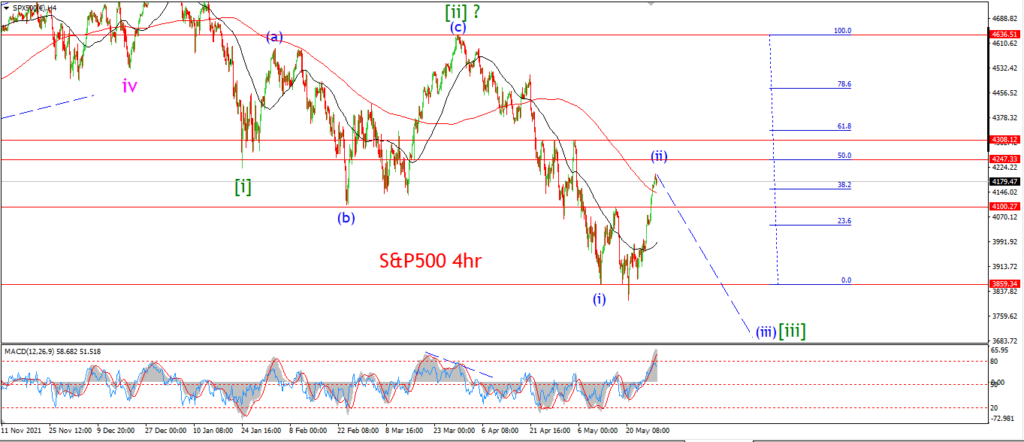
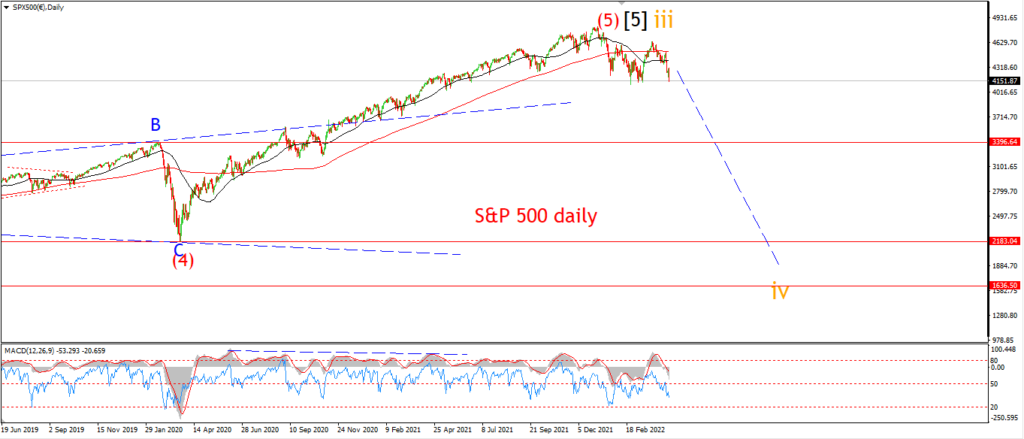
I think this rally has gone far enough in the S&P!
The expanded flat correction pattern is now in place for wave (ii).
And wave ‘c’ of (ii) has a completed five wave internal pattern.
Wave ‘c’ has reached the 162% extension of wave ‘a’,
and the market is close to hitting the 50% retracement level of wave (i).
All things considered,
we should see a reversal begin off nearby highs into wave [iii] down.
A break of the wave ‘a’ high again at 4096 will the first sign that wave ‘i’ of (iii) has begun.
SILVER.
SILVER 1hr
SILVER 4hr.
SILVER daily.
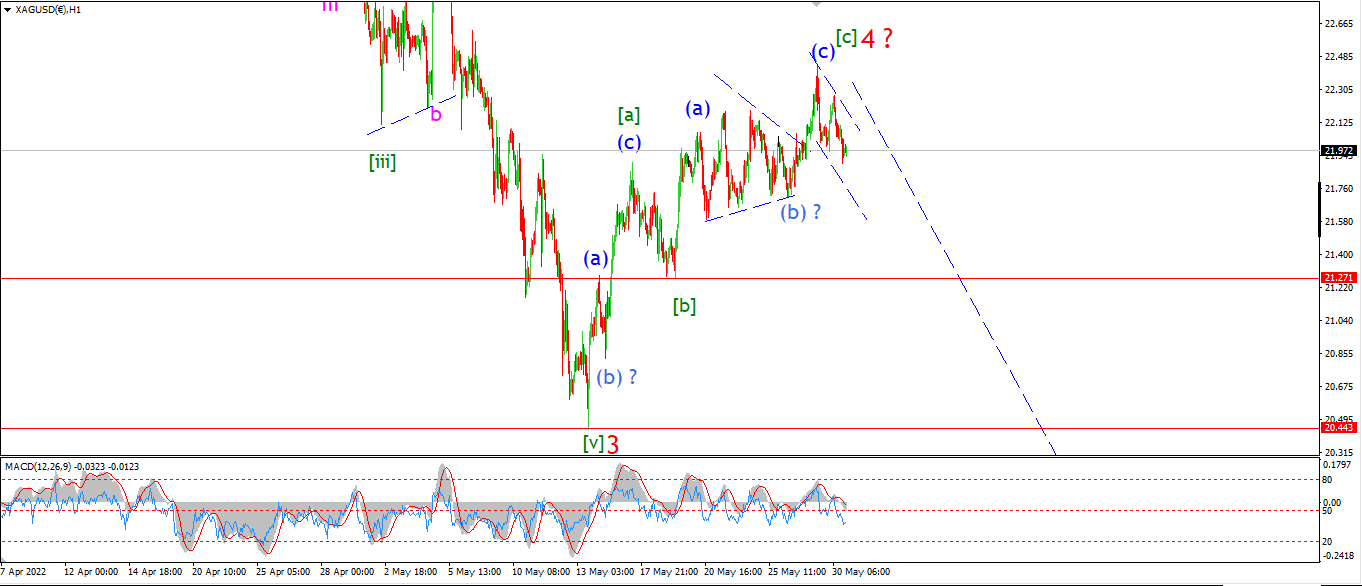
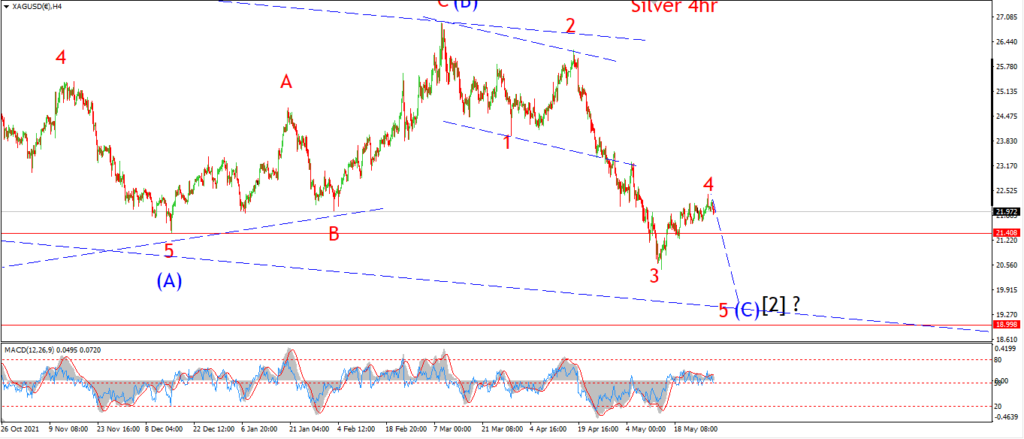
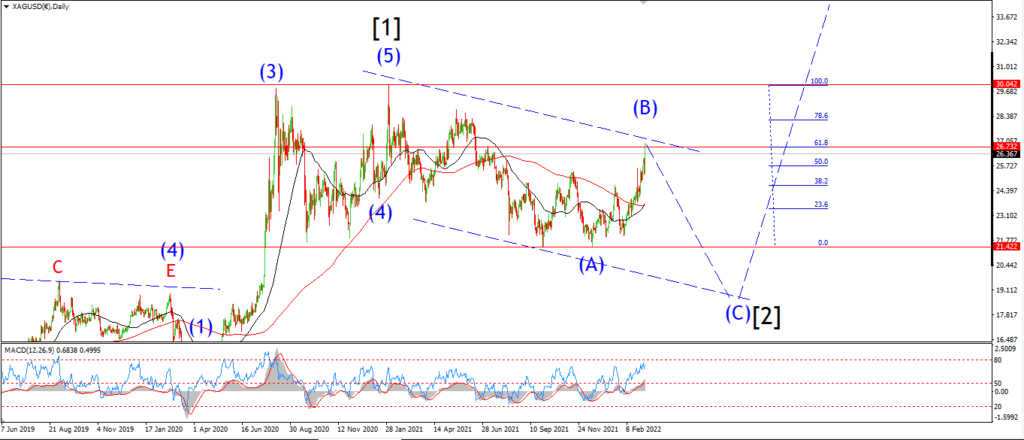
Silver has only created a three wave decline off the wave ‘4’ high.
So I need to see a larger five wave pattern lower to break the wave [b] low to signal wave [i] of ‘5’ has begun.
Wave [b] lies at 21.27,
so that level is key in terms of signaling the beginning of wave ‘5’ down.
Lets see if wave [i] of ‘5’ can trace out a five wave decline this week.
BITCOIN
BITCOIN 1hr.
BITCOIN 4hr.

BITCOIN daily.
….
FTSE 100.
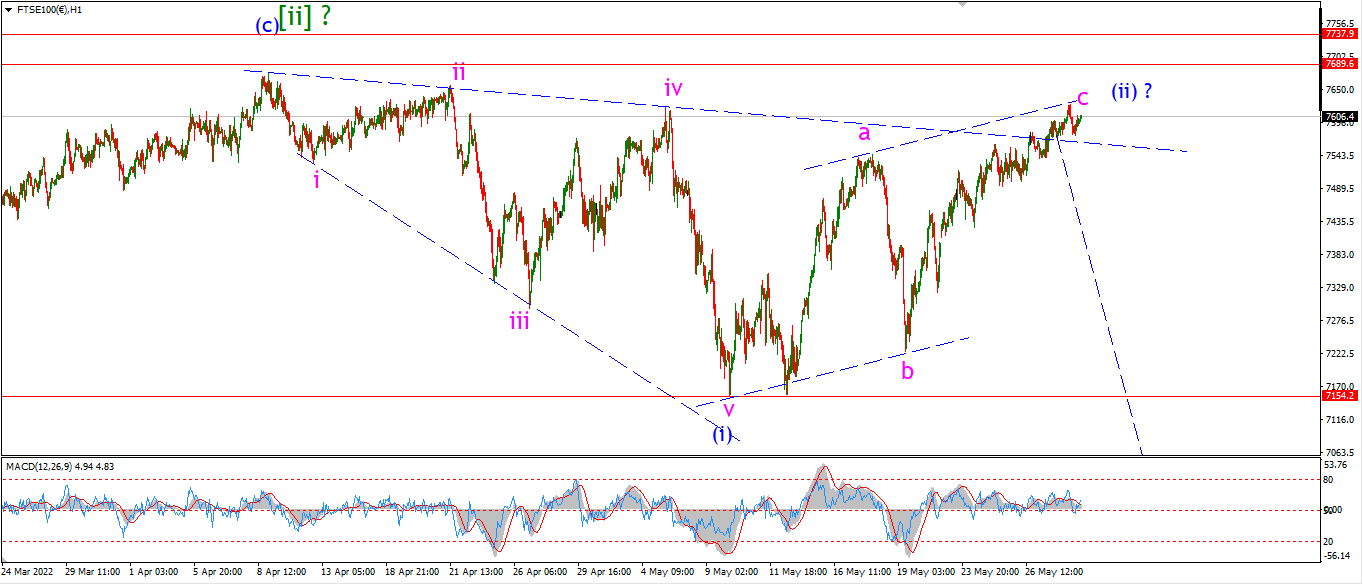
FTSE 100 1hr.
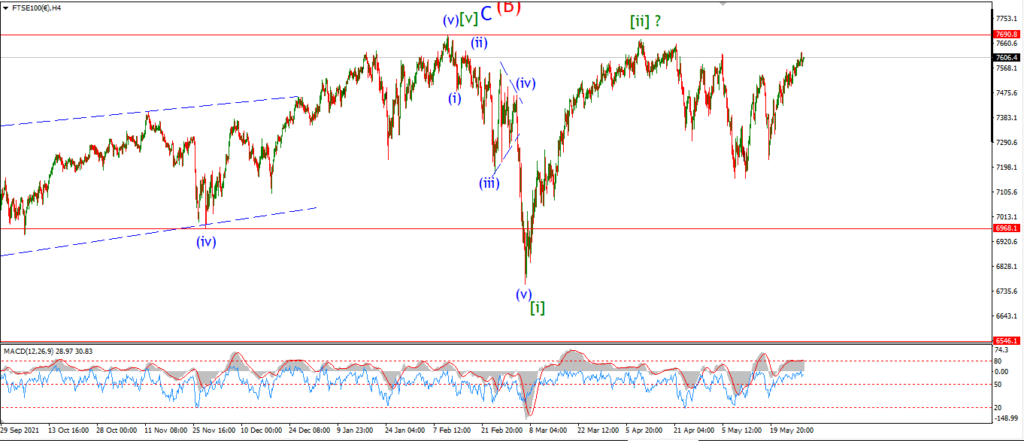
FTSE 100 4hr.

FTSE 100 daily.
….
DAX.
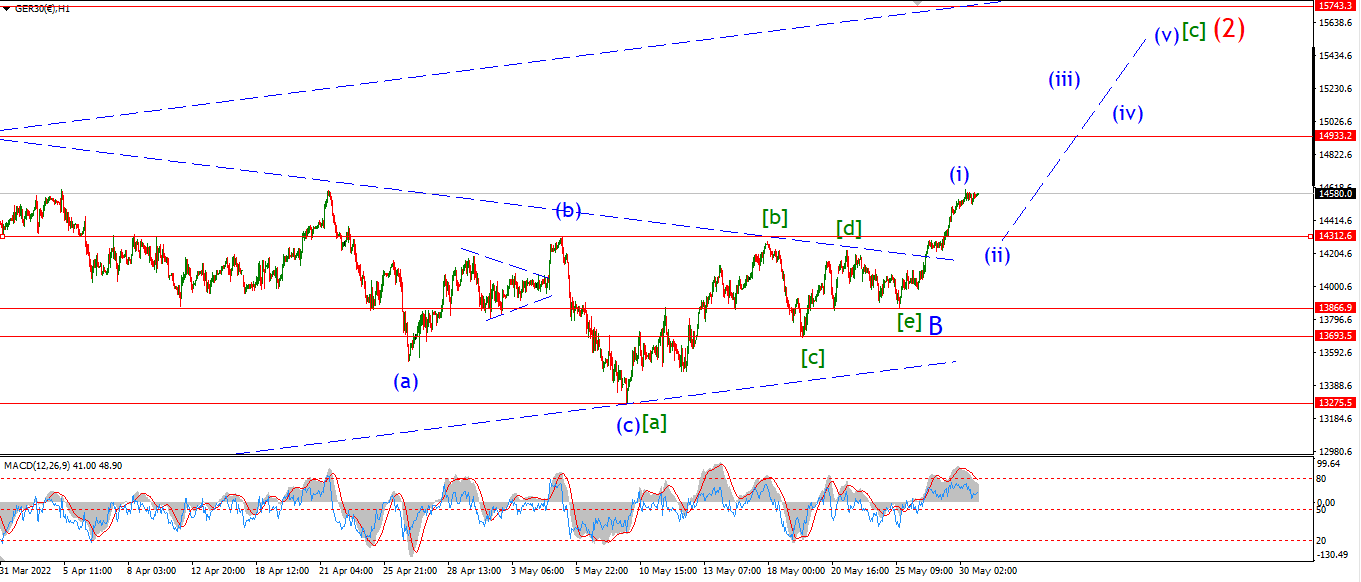
DAX 1hr
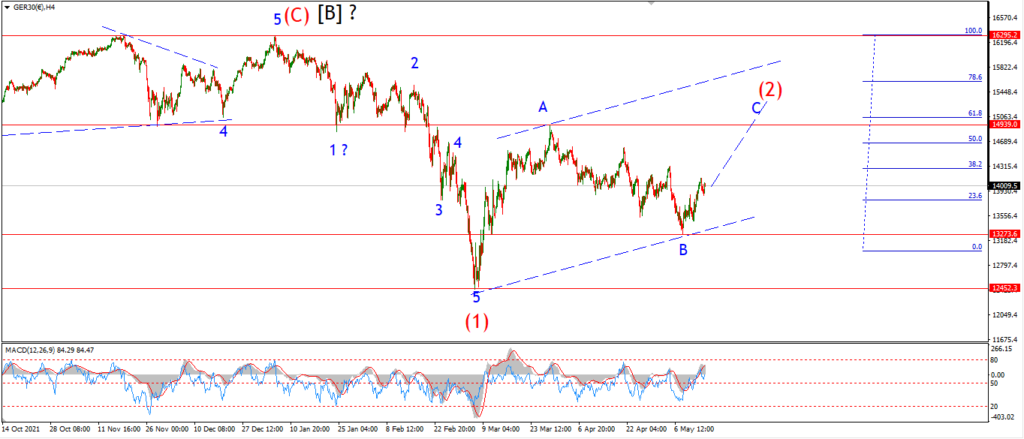
DAX 4hr

DAX daily.
….
NASDAQ 100.
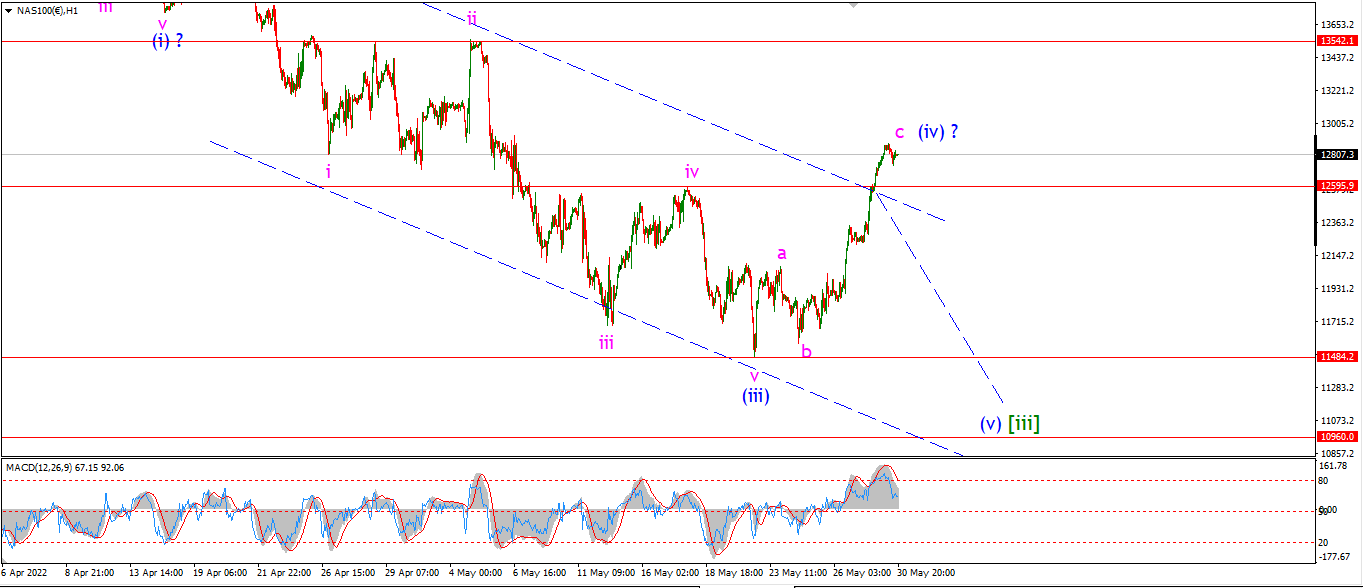
NASDAQ 1hr
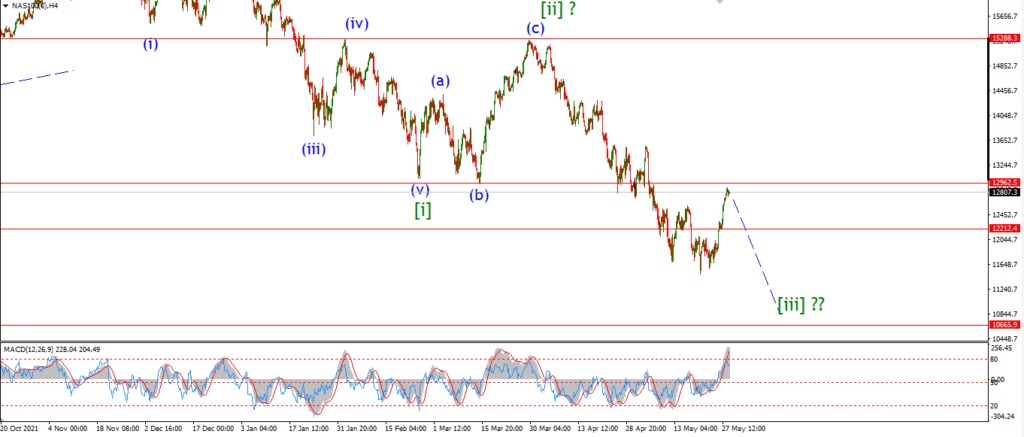
NASDAQ 4hr.
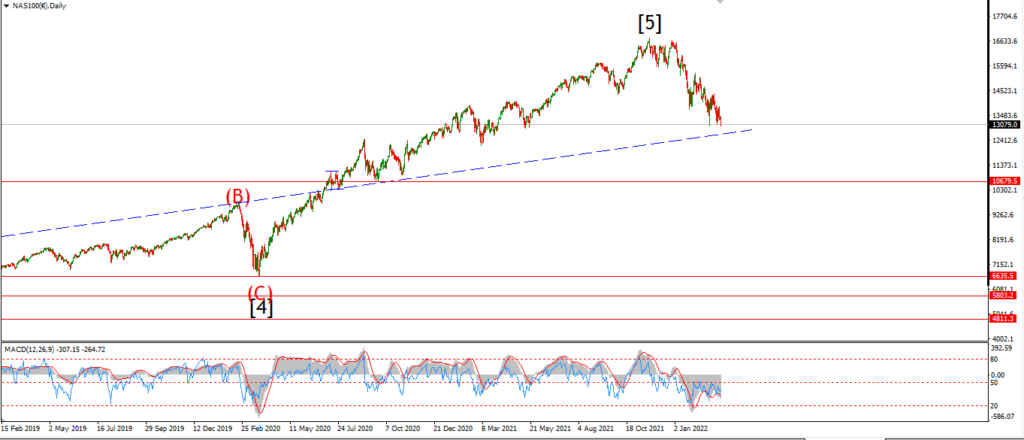
NASDAQ daily.
….