
Good evening to you all,
the Lord’s blessings to you all tonight.
If you are interested in a deeper historical look into the Russo/Ukraine issue and the connections to the western powers, here is a good interview with Alex Thompson that I just finished listening to.
EURUSD.
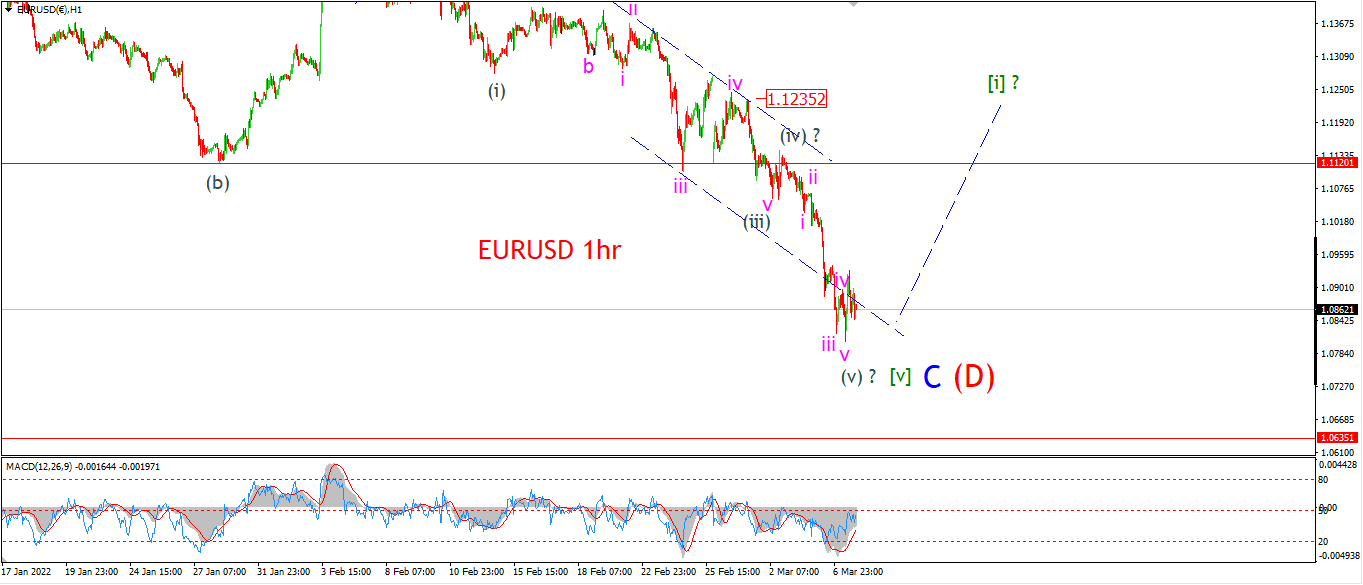
EURUSD 1hr.
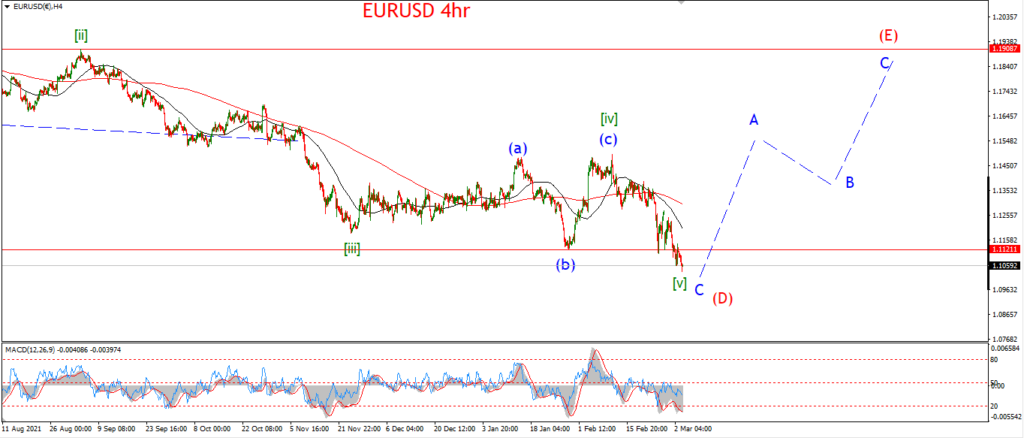
EURUSD 4hr.
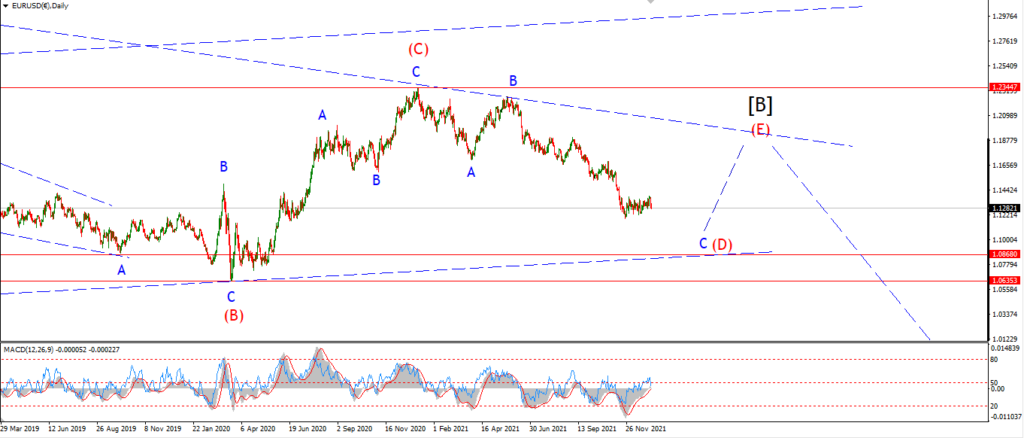
EURUSD daily.
I am now getting a bit skittish regarding my overall triangle idea in EURUSD.
I am tracking this low of wave (D) for a long while now,
and it is critical that this wave completes above the wave (C) low at 1.0635.
That level is in view now,
and I did not think we would get this low to be honest.
But here we are.
There is a nice five wave pattern now complete in wave (v) of [v] at todays low.
This fifth wave has extended far enough for my liking.
And I do want to see the first leg up in wave [i] of ‘A’ to begin immediately.
Tomorrow;
Watch for wave [i] to make a clear break off the lows and run back above 1.10 again to signal that wave (D) is finally finished.
GBPUSD
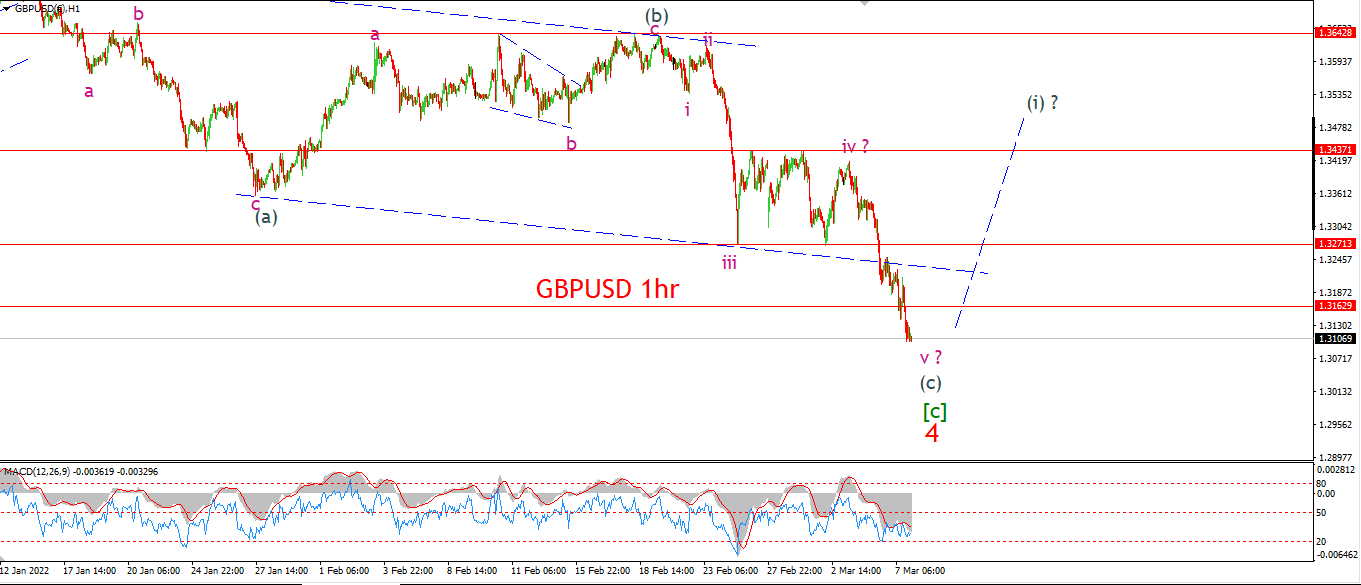
GBPUSD 1hr.
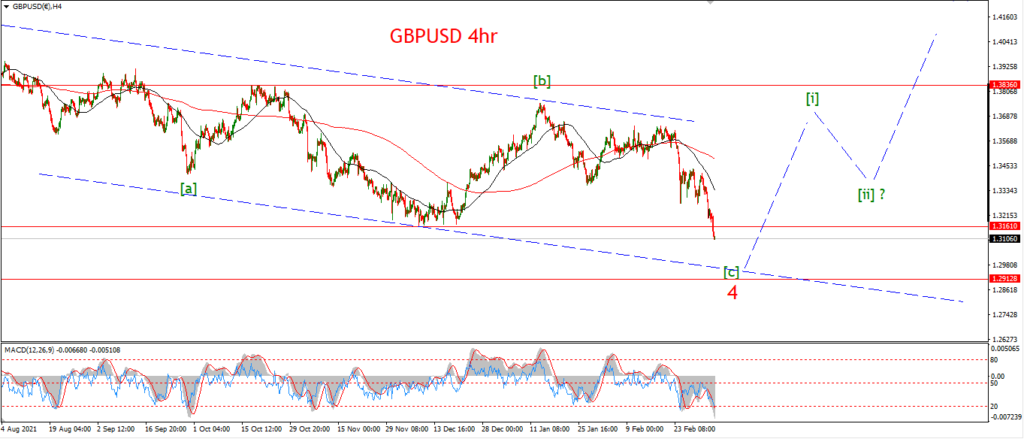
GBPUSD 4hr.
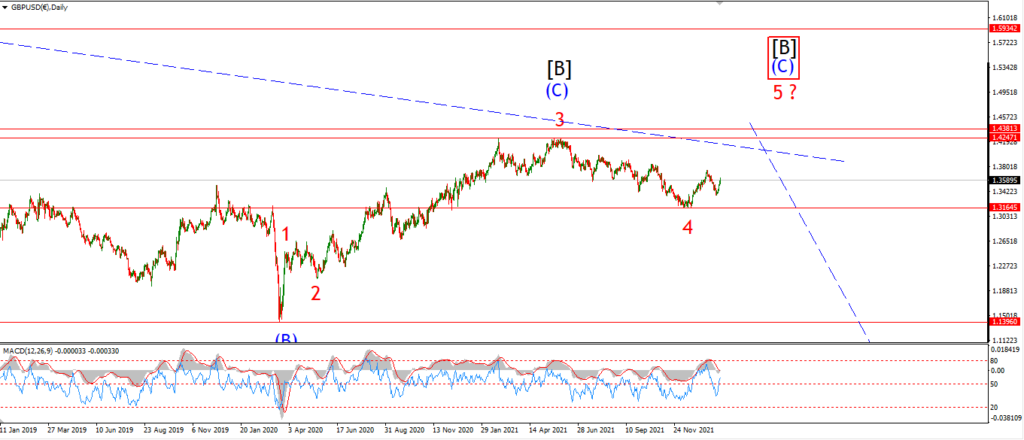
GBPUSD daily.
Todays low has broken the invalidation level for the previous count in wave ‘4’.
The [i] [ii] idea to begin a rally into wave ‘5’ was the previous idea.
and now I have to go back to the drawing board for wave ‘4’ red as you can see.
The 4hr chart;
I am not clear yet what the best interpretation for wave ‘4’ red is.
It is possible that we have a triple combination wave,
this involves a series of three ‘3’ waves to make up the larger correction in wave ‘4’.
At the moment this is the best fit pattern to work with.
I will tread softly from here for the next few days to see if we get some confirming price action in favor of that idea.
Tomorrow;
Lets see if wave ‘4’ does come to an end with a rally back above 1.33 again in wave ‘i’ of (i).
A break of 1.3450 again at the previous wave ‘iv’ high will be a strong signal that the rally into wave ‘5’ has begun.
USDJPY.
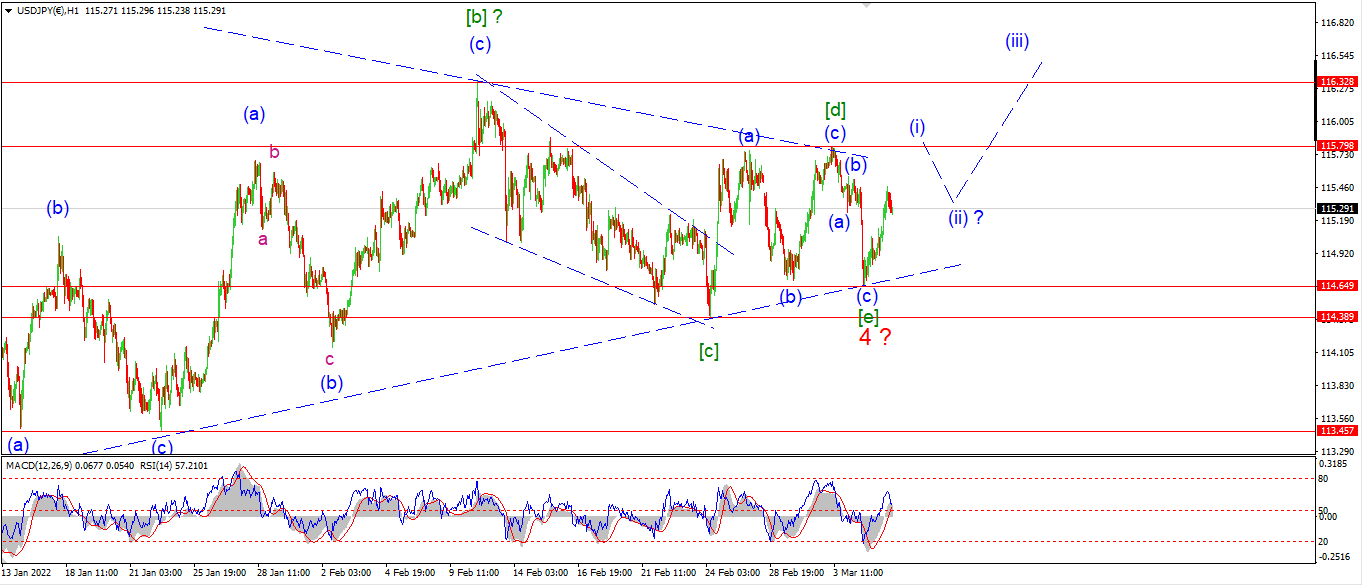
USDJPY 1hr.
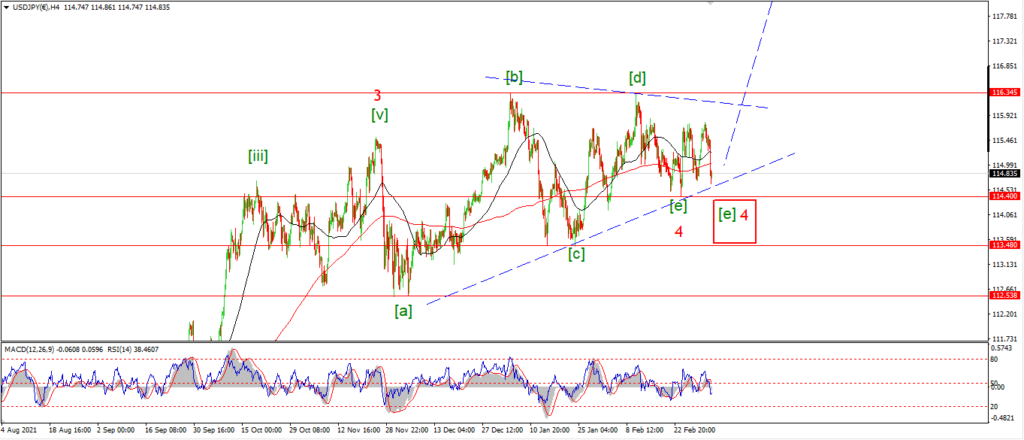
USDJPY 4hr.
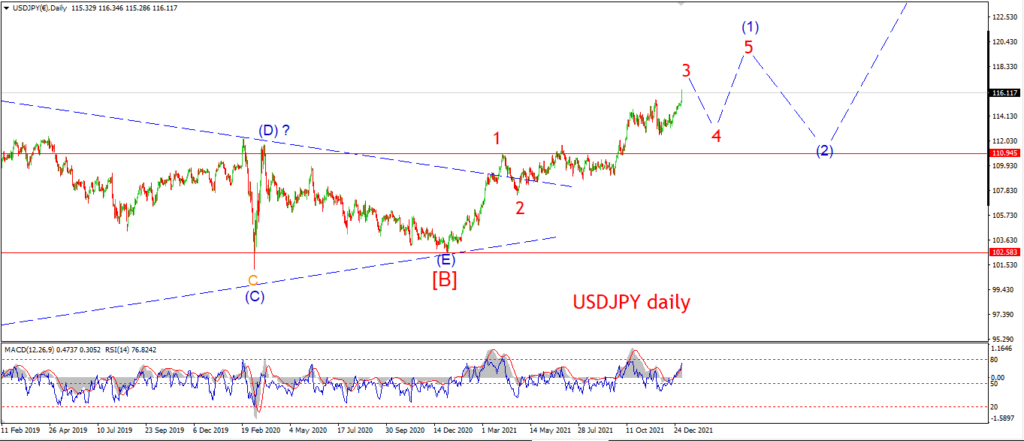
USDJPY daily.
USDJPY is at least tracking with the short term count this evening without any major revisions tonight.
The triangle in wave ‘4’ is still in play,
and the low of wave [e] of ‘4’ has formed a possible final low at 114.65.
that level must hold for this pattern to remain valid.
Tomorrow;
Watch for wave [e] to hold.
Wave (i) of [i] of ‘5’ must now rally back above the top wave [d] to signal that the correction in wave ‘4’ is in-fact over.
A bullish higher low from this point signal wave [i] of ‘5’ is beginning.
DOW JONES.
DOW 1hr.
DOW 4hr
DOW daily.
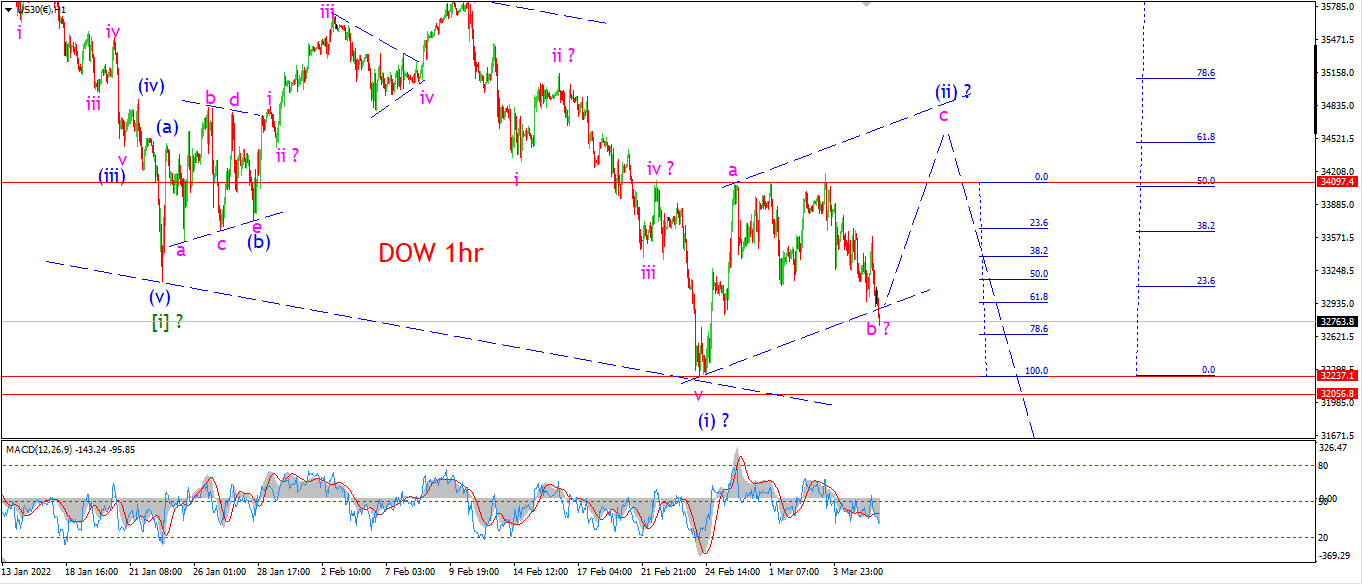
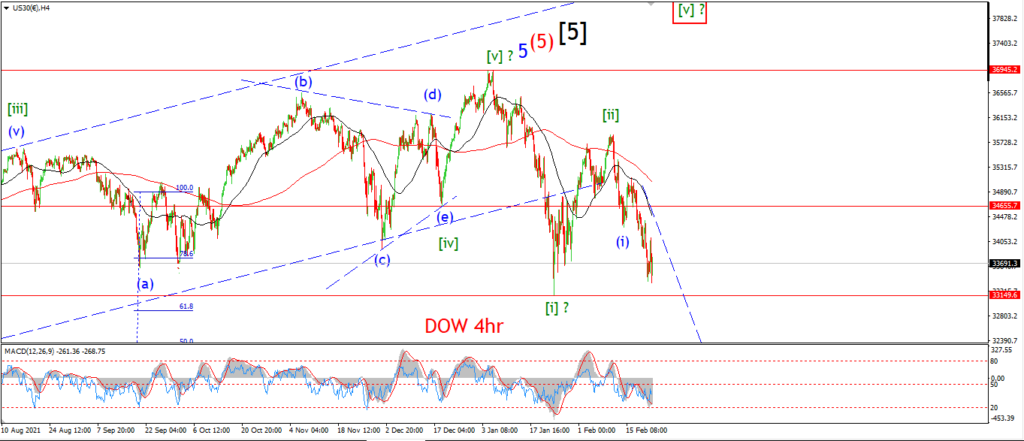
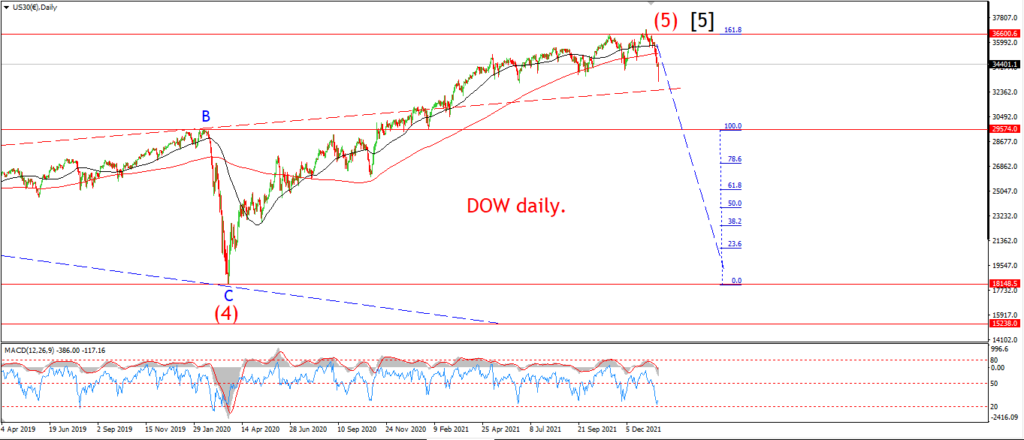
The action in the stock market is still pretty corrective in a possible wave ‘b’ of (ii) today.
At the moment, wave ‘b’ has retraced to the 62% level of the rally in wave ‘a’.
This should be enough to complete wave ‘b’ and begin a rally into wave ‘c’ over the coming days.
I am looking for this current wave (ii) correction to close out this week,
and then we should see wave (iii) down begin most likely by the end of the week.
So,
if this count is correct showing a series of 1,2 impulsive declines off the top,
then we are reaching a critical moment for the stock market,
as a third of a third decline is coming our way very soon according to this count.
Tomorrow;
Watch for wave ‘b’ to hit a low by tomorrow evening.
A spike rally back above 33500 again will signal wave ‘c’ is underway.
GOLD
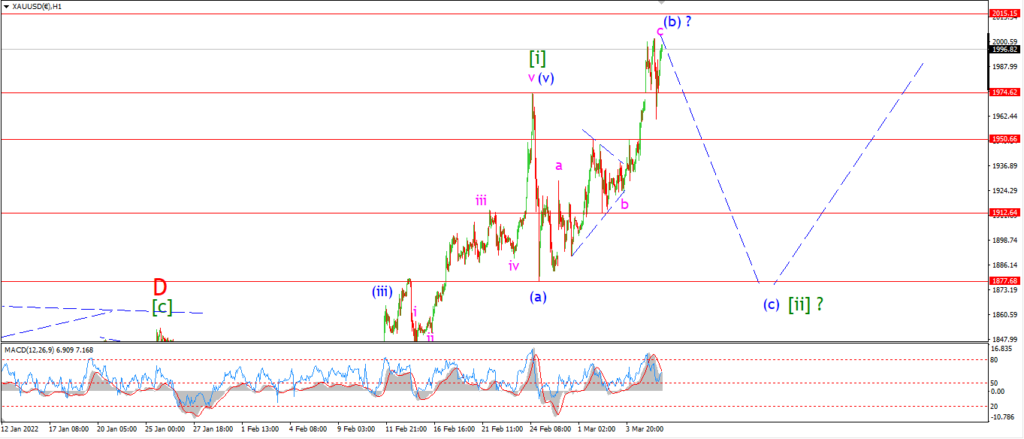
GOLD 1hr.
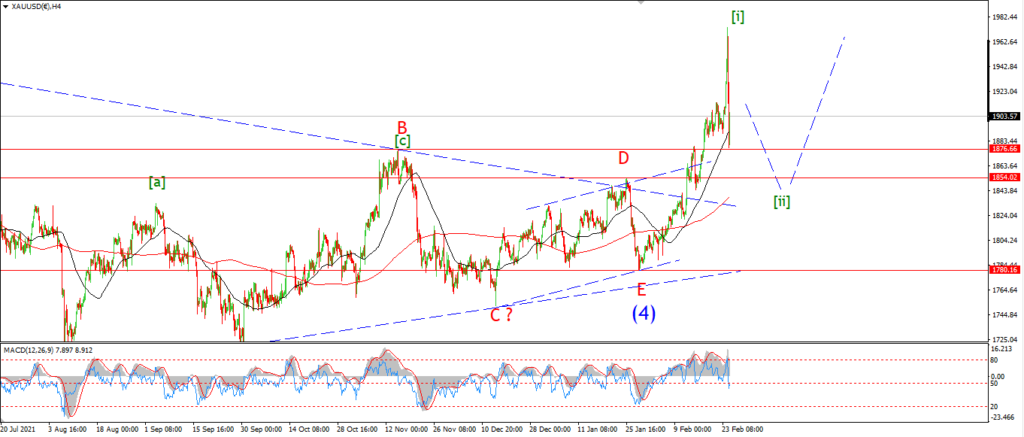
GOLD 4hr.
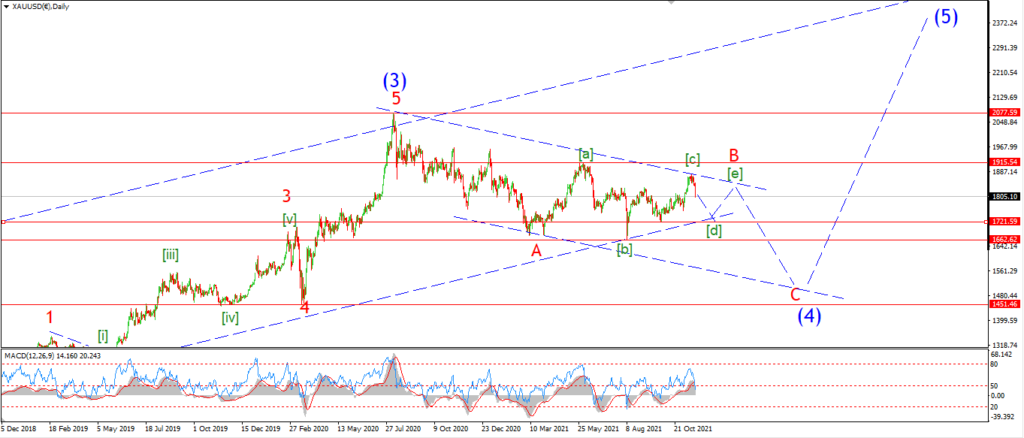
GOLD daily.
maybe I’m just being utterly obtuse and pig-headed at this point,
but I am still of the opinion that wave [ii] is not over even with this new high.
I can foresee a point over the next week or so where talks between Ukraine and Russia actually come up with a ceasefire,
at least I do hope so.
And if that happens,
then this rally will be sold like there is no tomorrow!
A three wave rise can easily be seen in wave (b) in my humble opinion.
and if that is correct,
we will see a five wave decline in wave (c) of [ii] to break below the 1877 level again.
That will complete my ideal scenario for wave [ii],
and then I will prepare for a longer term rally into wave [iii].
Tomorrow;
the price is holding a small lower high after dropping sharply this morning.
It remains to be seen if this is the beginning of wave (c) or not.
I am looking for wave (c) to at least begin this week,
but if we see another decline tomorrow,
that will indicate wave (c) is underway.
CRUDE OIL.
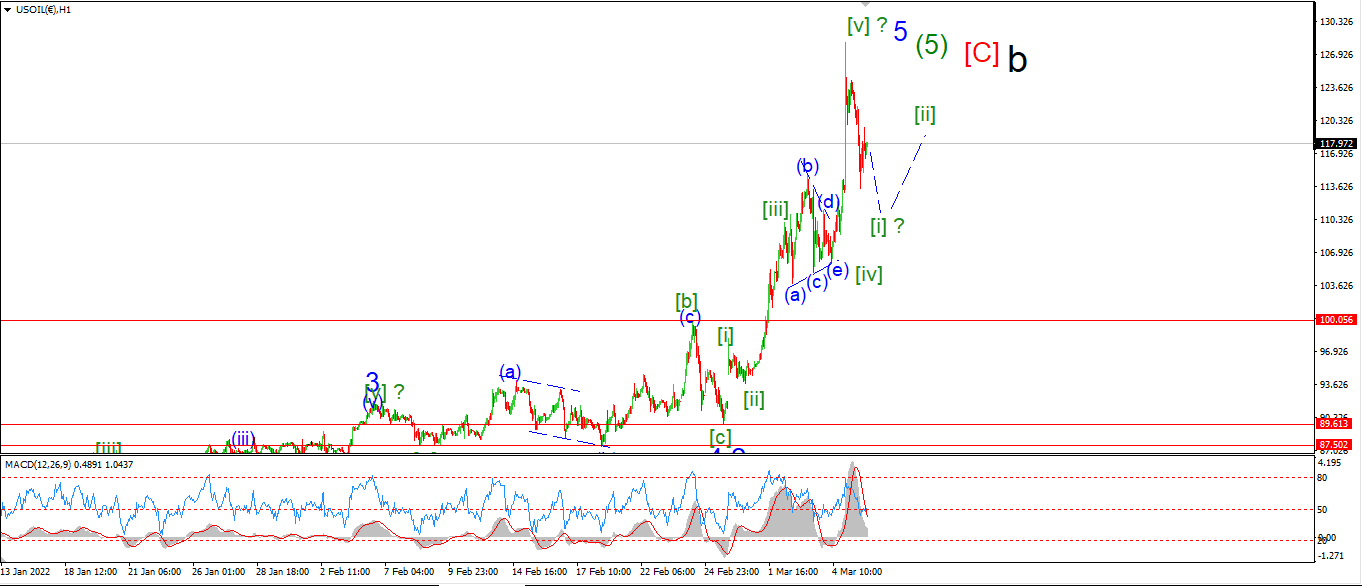
CRUDE OIL 1hr.
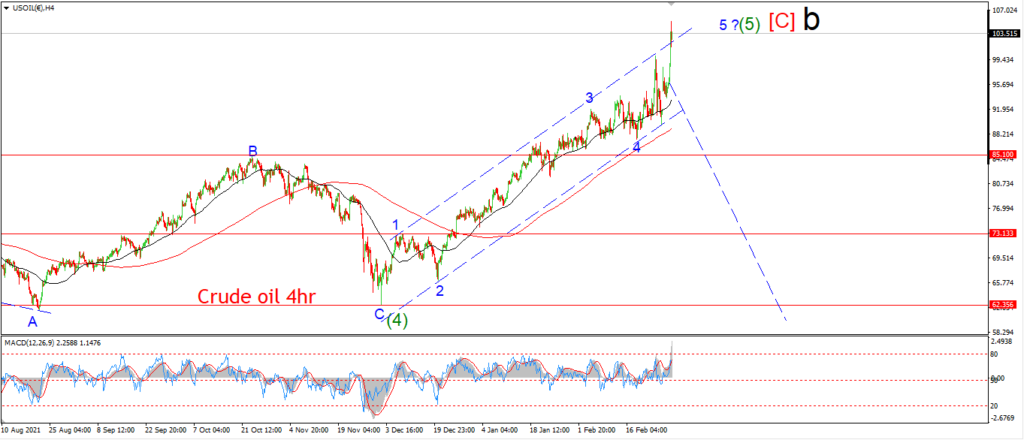
CRUDE OIL 4hr.

CRUDE OIL daily.
I first want to apologize to you all with my reading of the crude oil pattern of late.
I did not foresee the military buildup in Russia as breaking out into a war.
I think my less cynical / more hopeful better self got the better of my judgement on that one.
And on top of that I did not foresee an all out economic war being waged against Russia on the heels of that invasion.
So that’s two BIG fails on my part.
And obviously that has really ‘played puck’ with the wave count here in the short term.
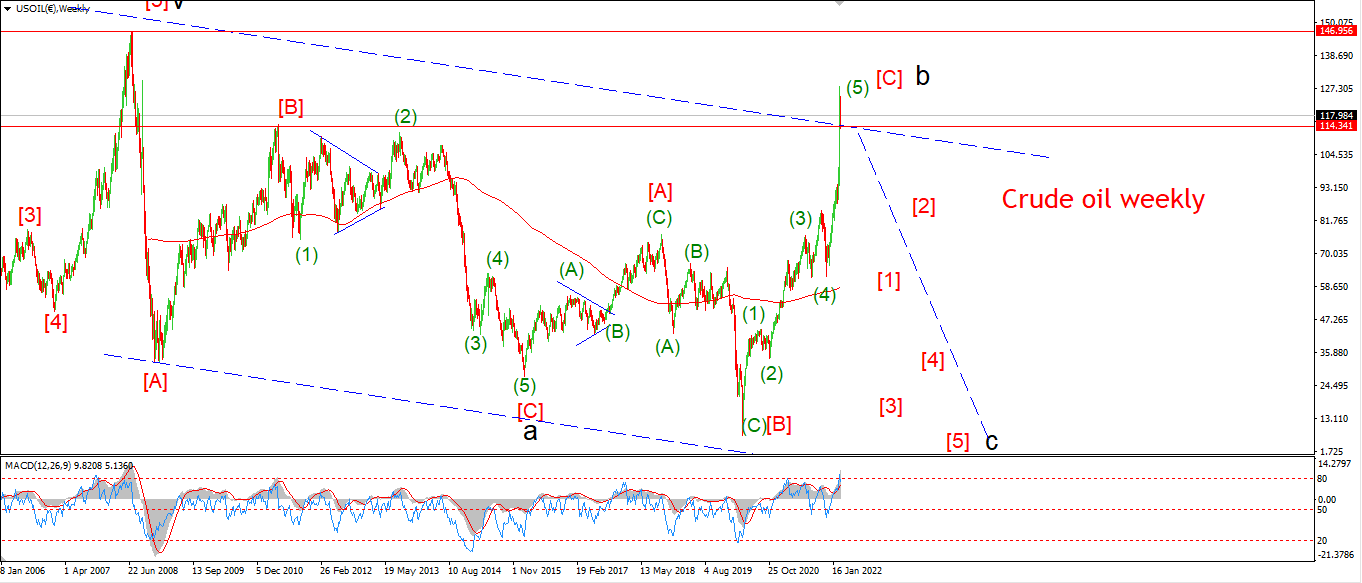
I have not abandoned the idea that we are still forming a very large degree wave ‘b’ top as shown.
And I have included the weekly chart above to illustrate that idea a little better tonight.
That is my base case scenario here.
And If I am correct about a burgeoning economic depression to build over the coming year,
then that fact alone will be enough to completely ruin the demand side argument for higher prices in everything,
not just oil and stocks etc.
With that said,
the market is off the highs of the session pretty substantially this evening.
And so far this is holding with only intermittent corrective spikes higher along the way today.
Tomorrow;
Lets see if we get a complete five wave pattern lower to signal a top is finally in for wave [C] of ‘b’.
S&P 500.
S&P 500 1hr
S&P 500 4hr
S&P 500 daily.
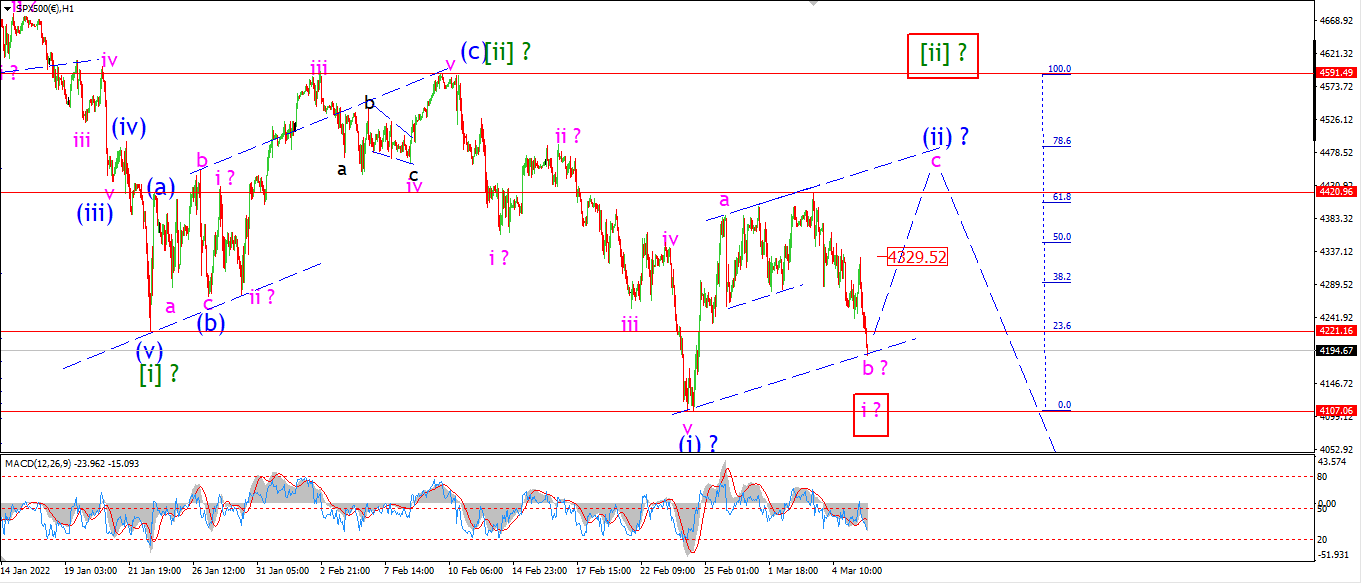
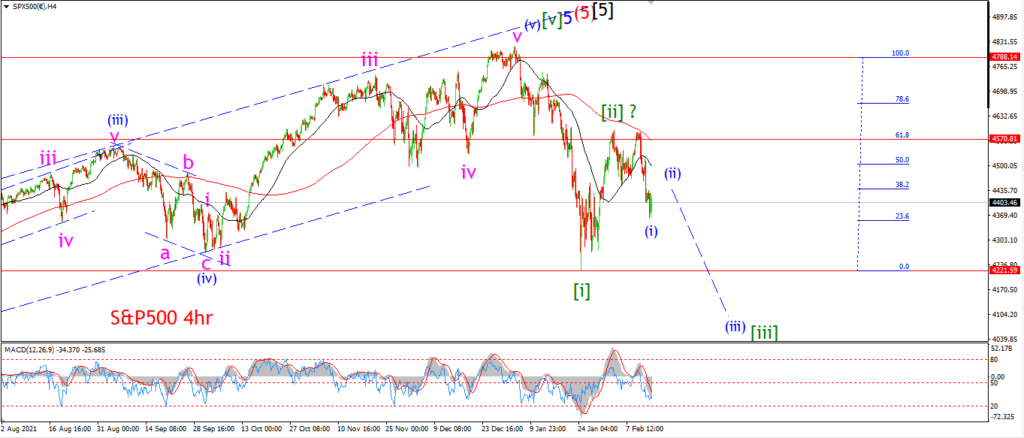
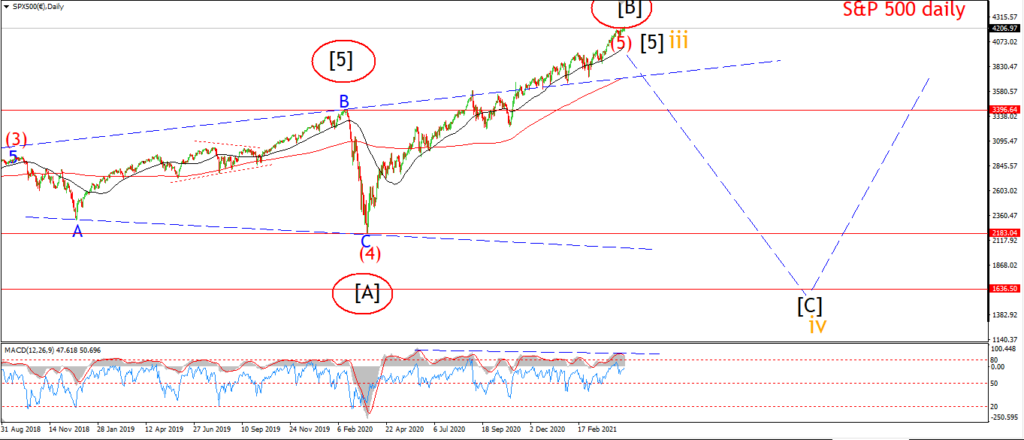
Overall I am sticking to the wave (ii) correction idea here.
But there may be a better bearish alternate count in the s&p than in the dow.
As the action off last weeks highs can viewed a little more impulsively than the structure in the dow.
It remains to be seen,
but if we do break 4100 again in the s&p I might be convinced that wave ‘i’ of (iii) is in play here.
Its still to early to tell,
but that is worth keeping in mind.
Tomorrow;
As for the main count.
Wave ‘b’ is still holding a higher low above 4107,
so we should see a higher low form in wave ‘b’ tomorrow.
Wave ‘c’ of (ii) will be confirmed with a break above 4330 again.
SILVER.
SILVER 1hr
SILVER 4hr.
SILVER daily.
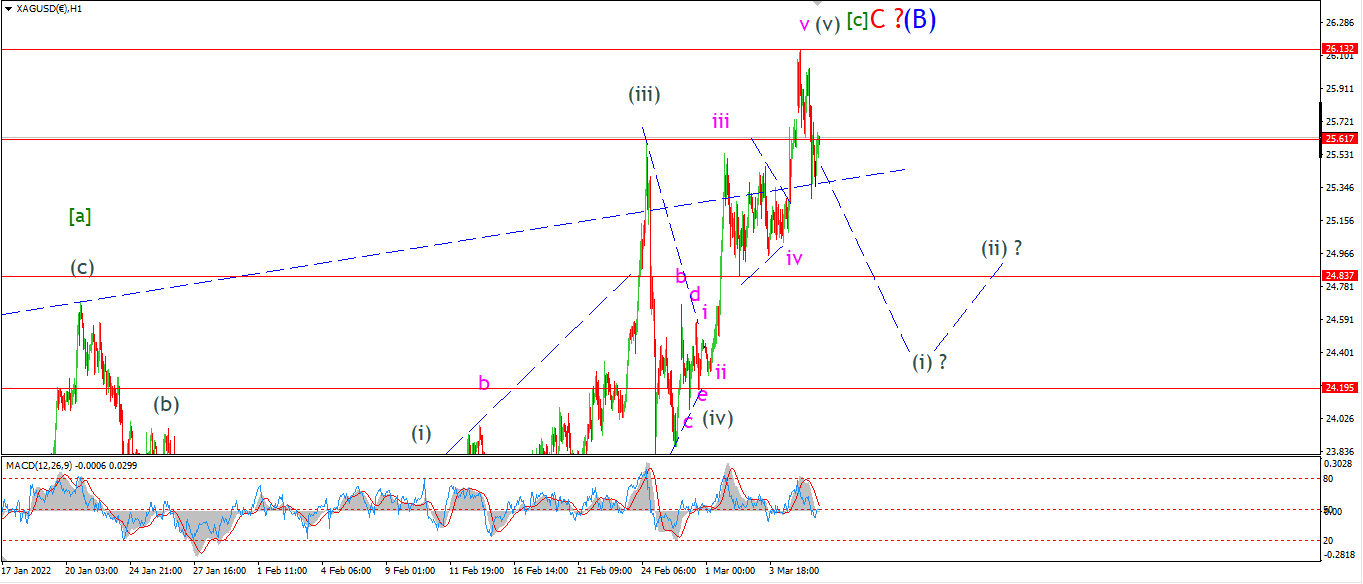
The decline off the top in silver is promising yet has not formed a five wave pattern down yet at least.
Ideally this week we will see a solid five wave pattern build off the highs to hit the price range of the previous wave (iv) low near 24.20 again.
That will setup for a lower high in wave (ii) early next week.
The price is holding just above the channel line now after that throw-over top in wave [c] of ‘C’ of (B).
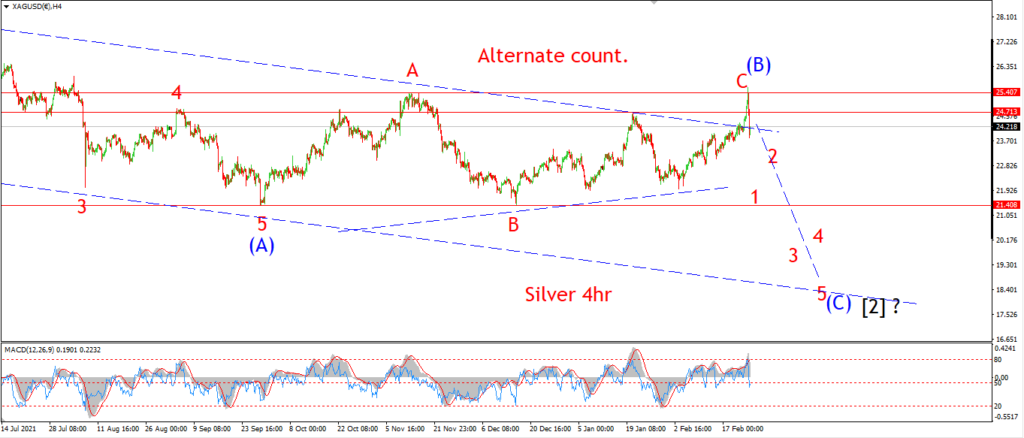
A five wave pattern off that high will signal the trend is turning again down into wave (C).
I know I have been long expecting this next decline to come,
but as long as the pattern is hinting that way,
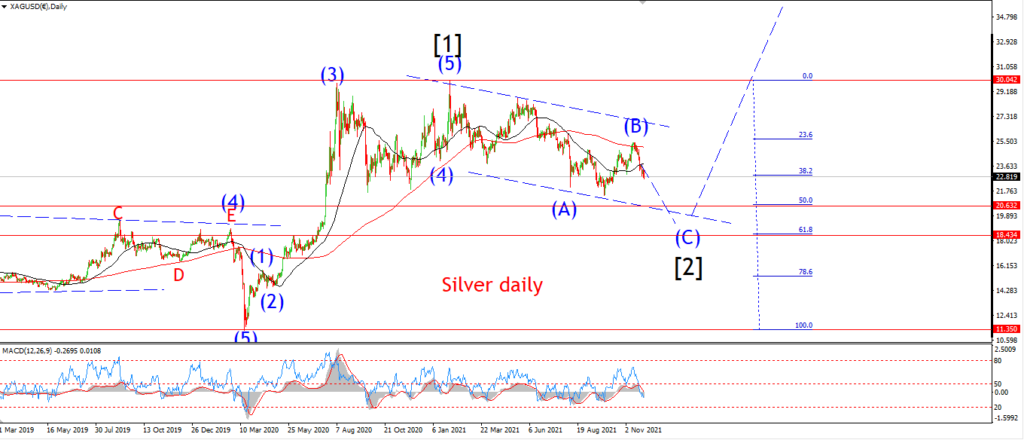
then I am pretty confident in that outcome to complete wave [2].
Tomorrow;
WAtch for wave (B) to hold over the next few sessions.
A five wave decline is critical now to build the case for a top in wave (B) and the next leg down into wave (C) this week.
BITCOIN
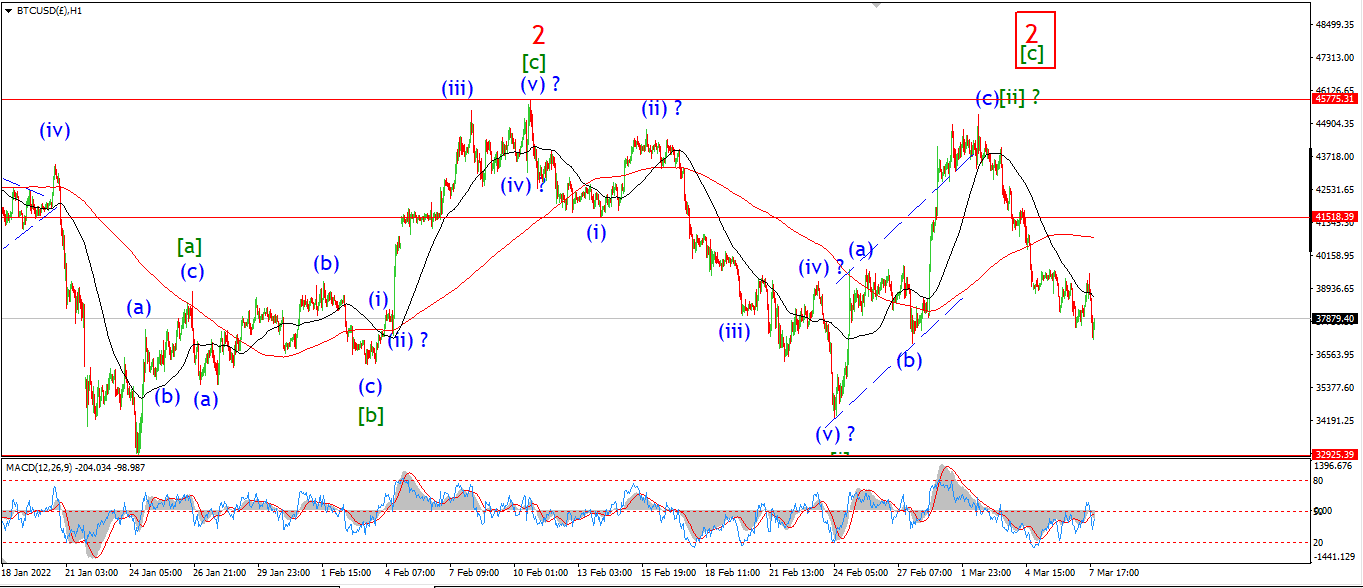
BITCOIN 1hr.
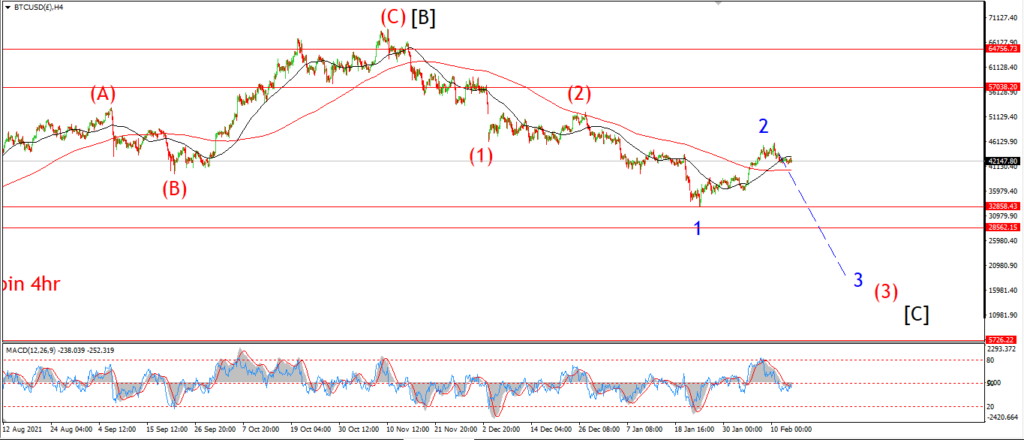
BITCOIN 4hr.

BITCOIN daily.
….
FTSE 100.
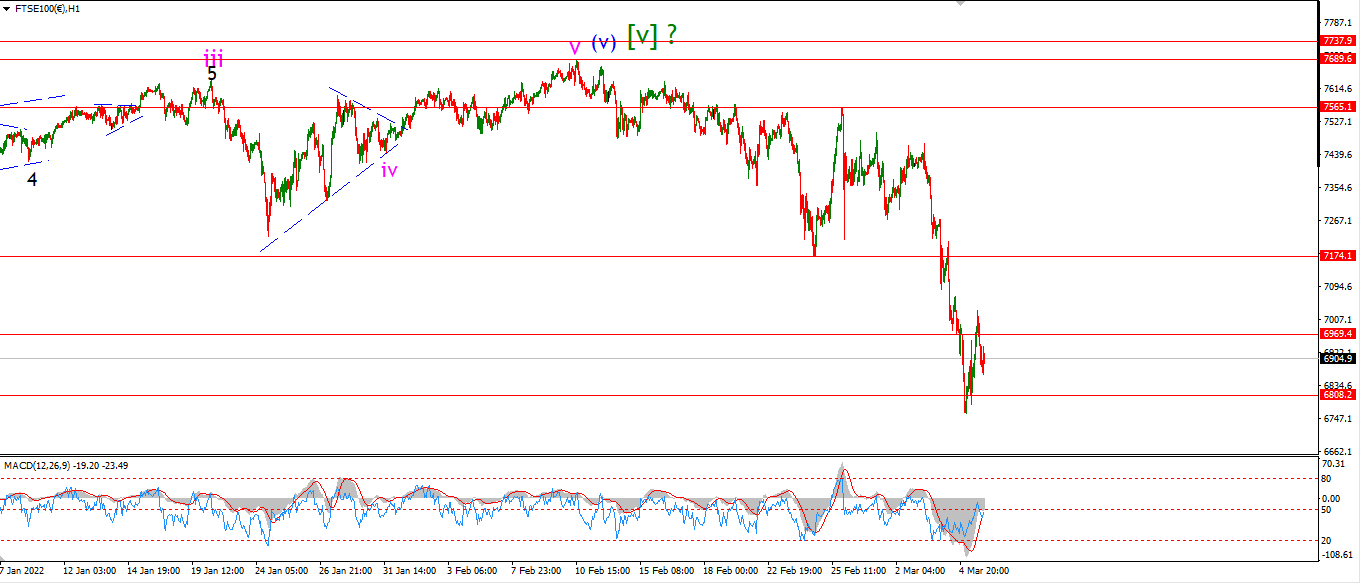
FTSE 100 1hr.
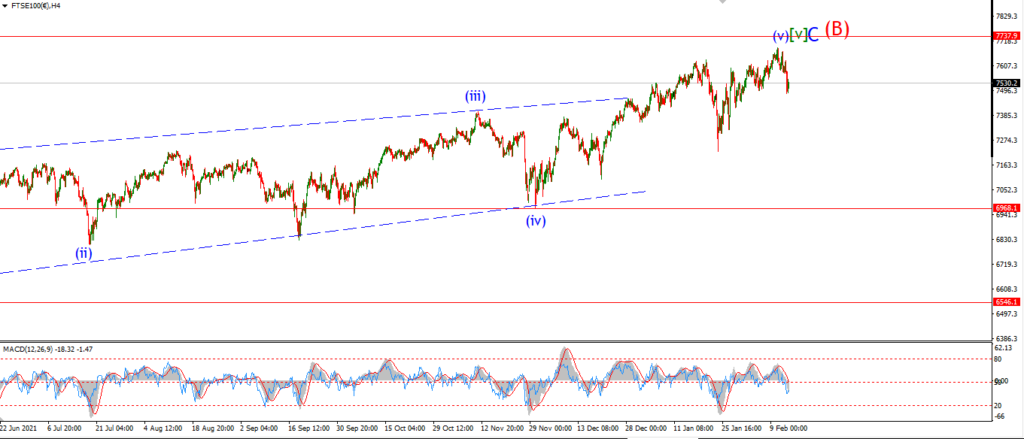
FTSE 100 4hr.

FTSE 100 daily.
….
DAX.
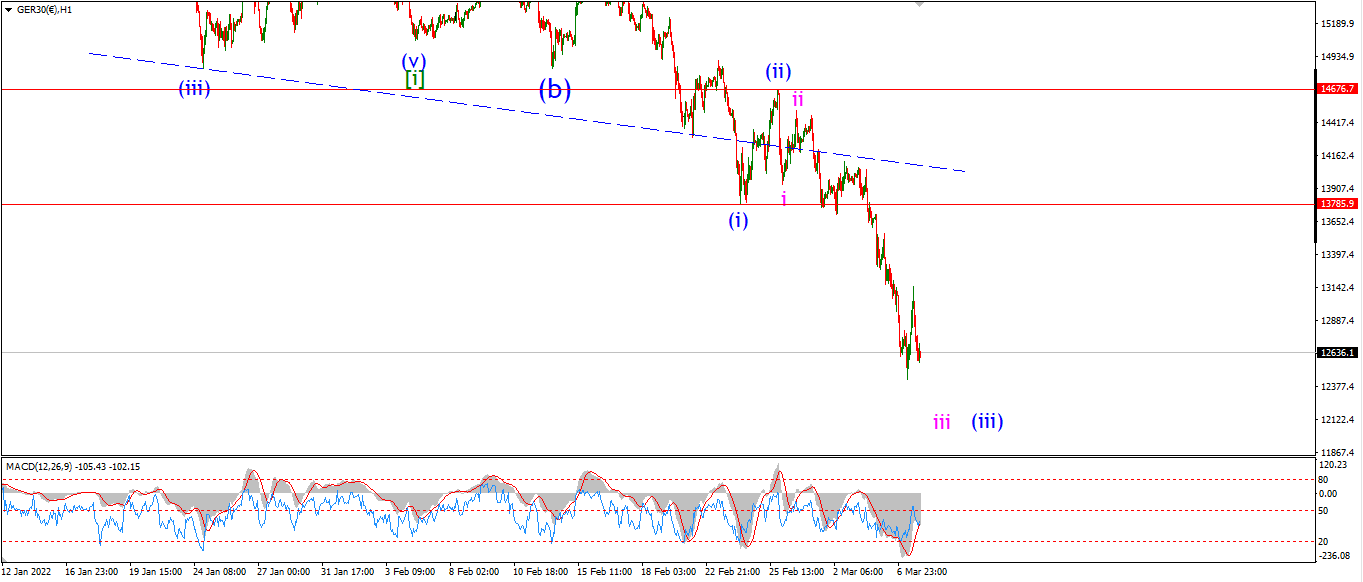
DAX 1hr
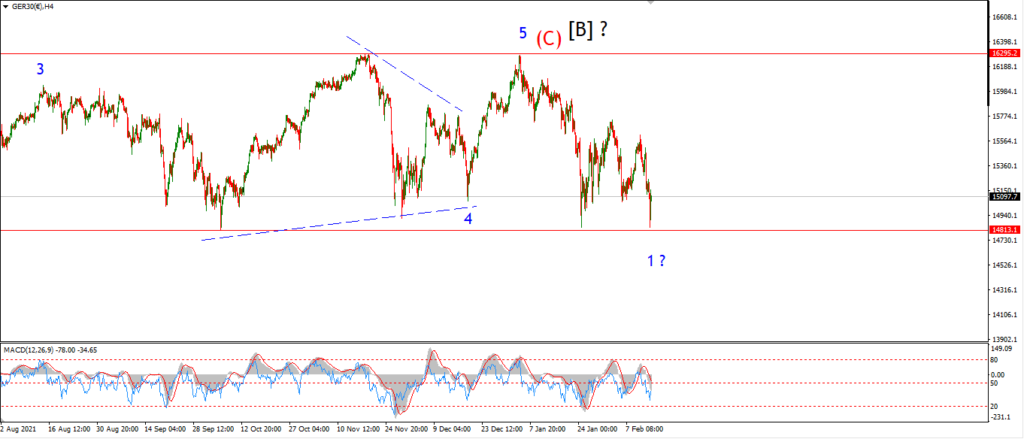
DAX 4hr
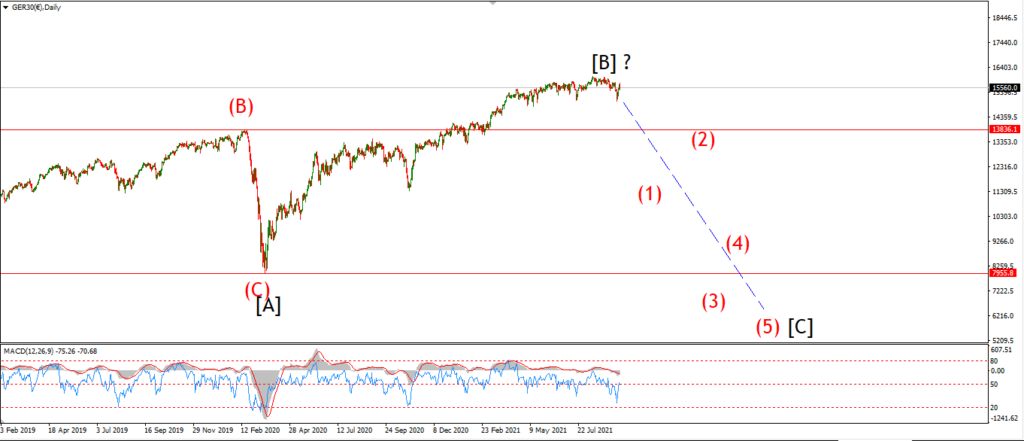
DAX daily.
….
NASDAQ 100.
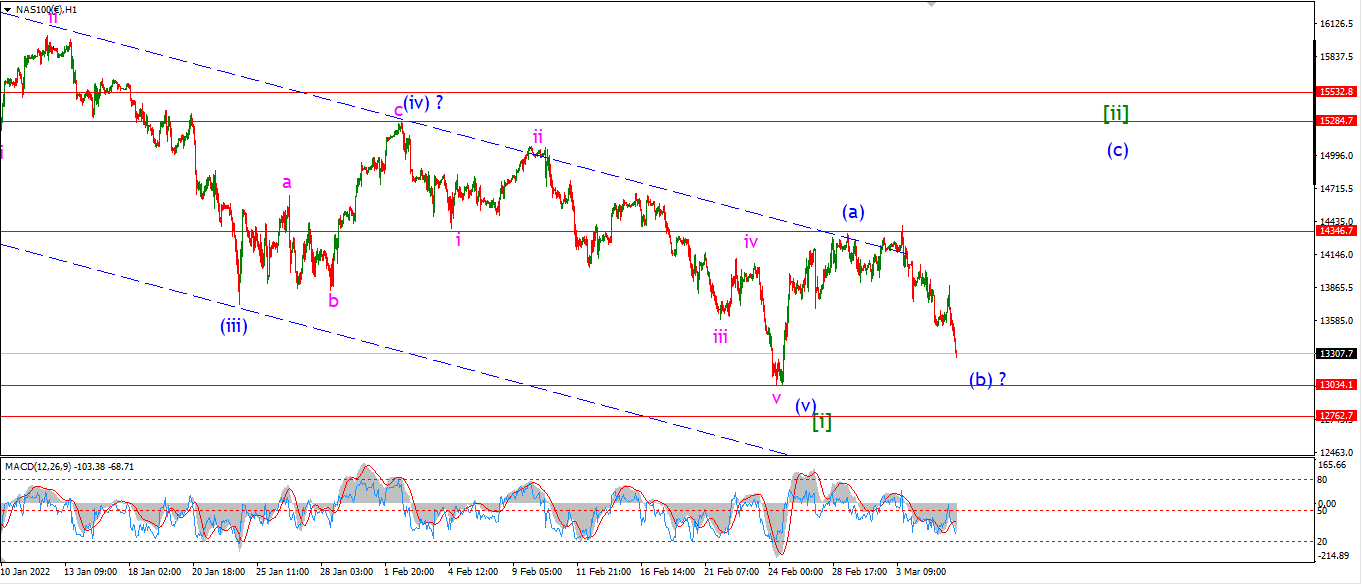
NASDAQ 1hr
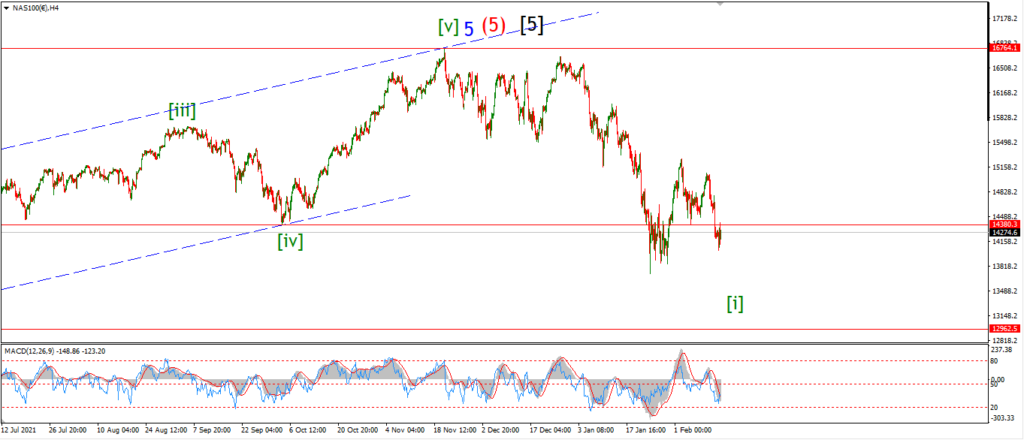
NASDAQ 4hr.
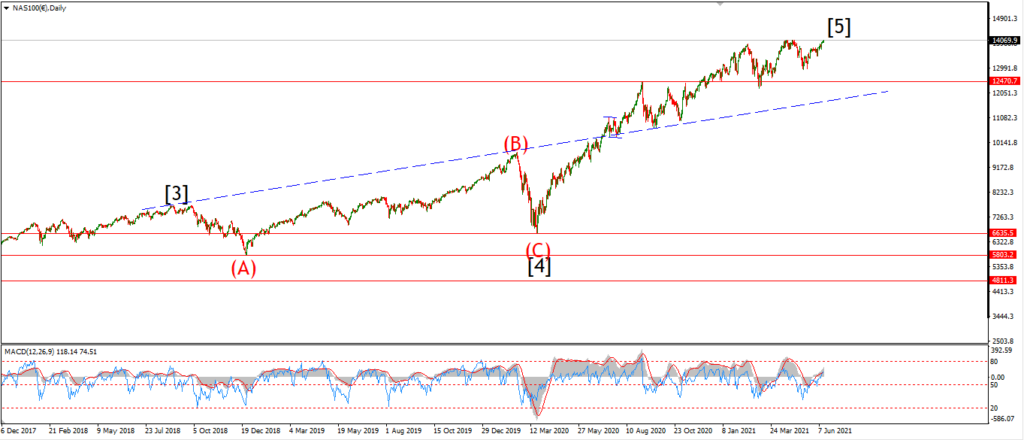
NASDAQ daily.
….