
Good evening to you all, and may the Lord bless you all tonight.
EURUSD.
EURUSD 1hr.
EURUSD 4hr.
EURUSD daily.
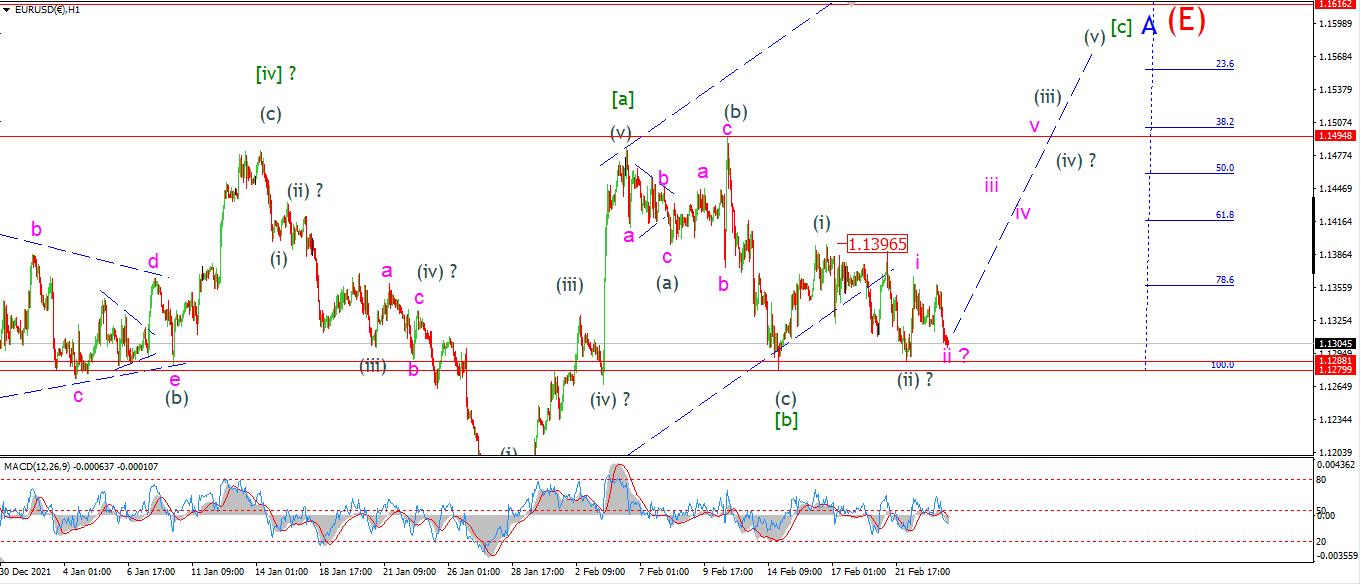
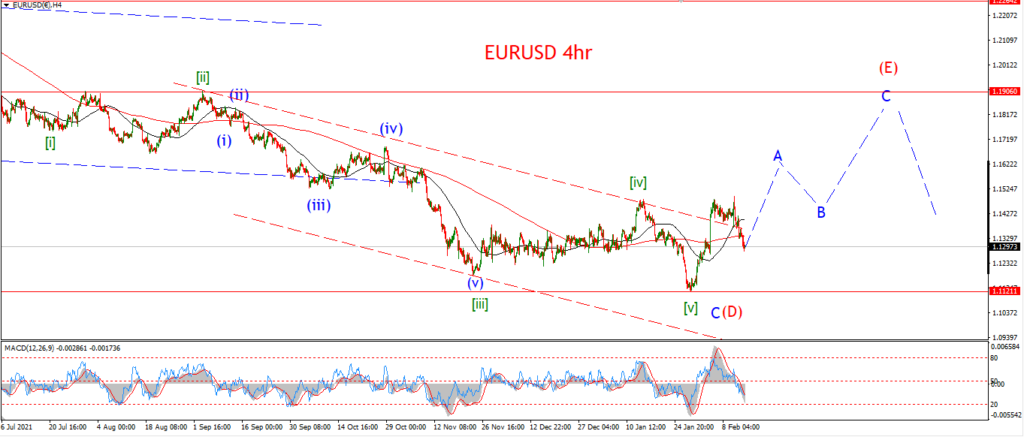
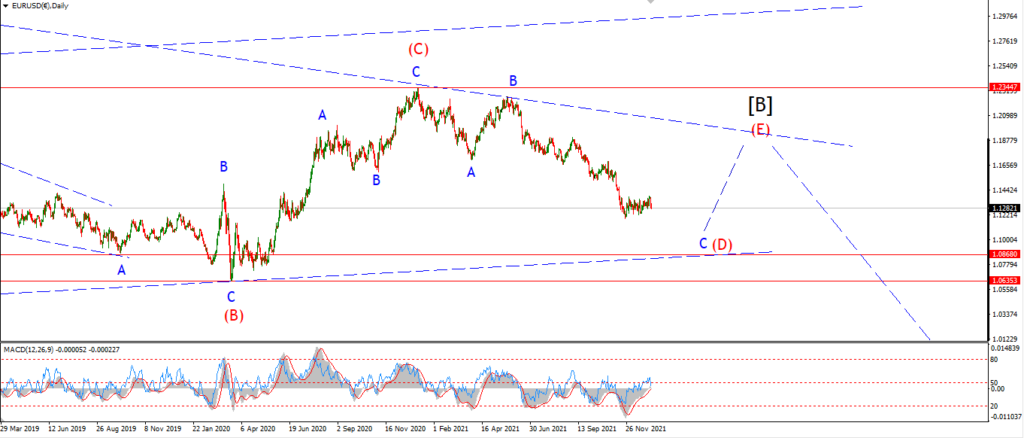
EURUSD is again hanging just above the lows of the week after another three wave drop today.
The short term count is pretty tight right now.
the price must hold above 1.1288 which is only 30 pips below the spot.
If that level holds tomorrow,
then I will be more confident with the idea that wave [c] is underway.
Tomorrow;
Watch for 1.1288 to hold and then a rally back above 1.1400 to confirm wave (iii) of [c] is underway.
GBPUSD
GBPUSD 1hr.
GBPUSD 4hr.
GBPUSD daily.
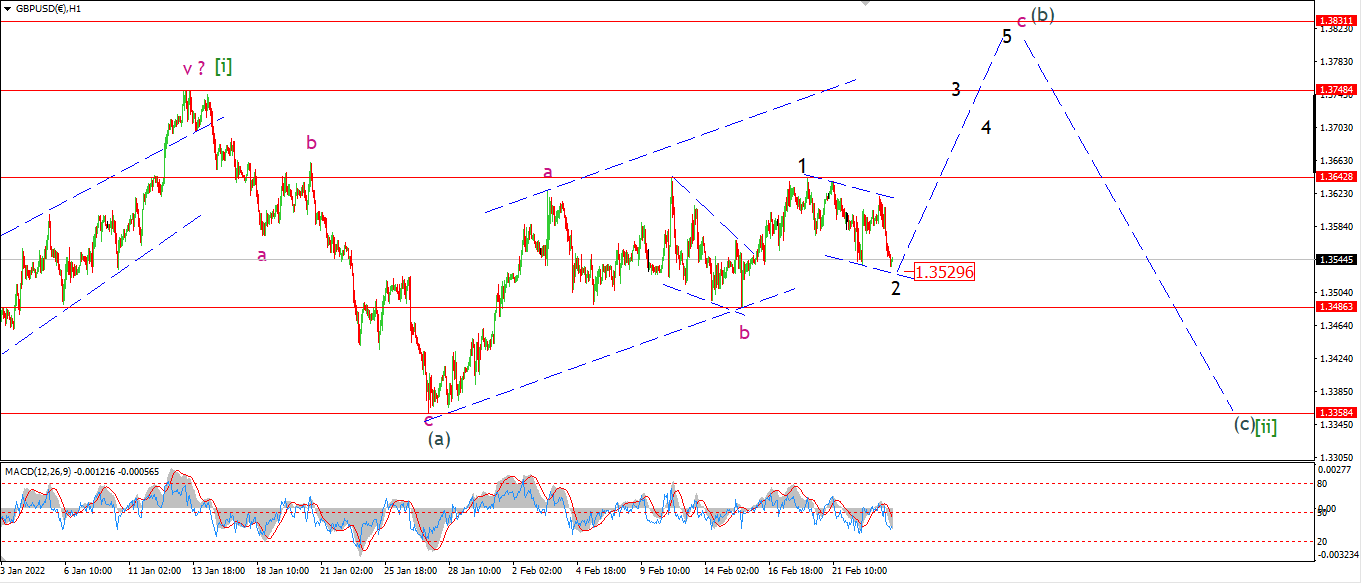
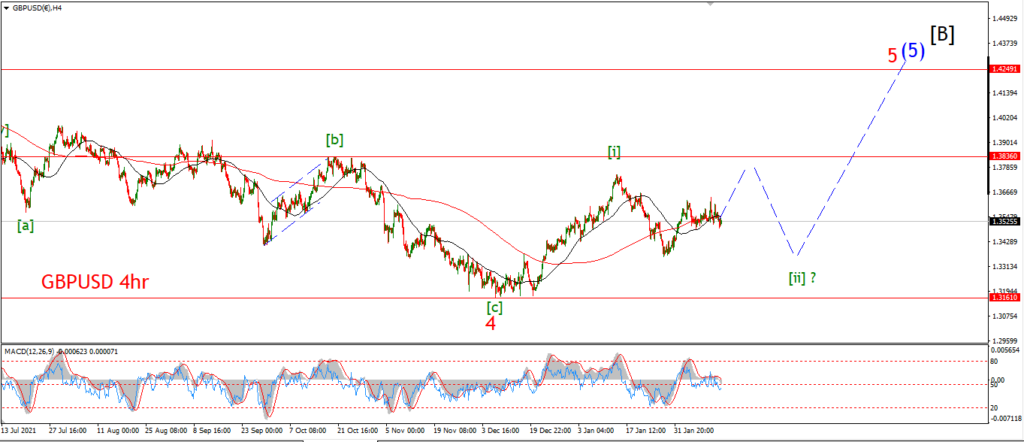
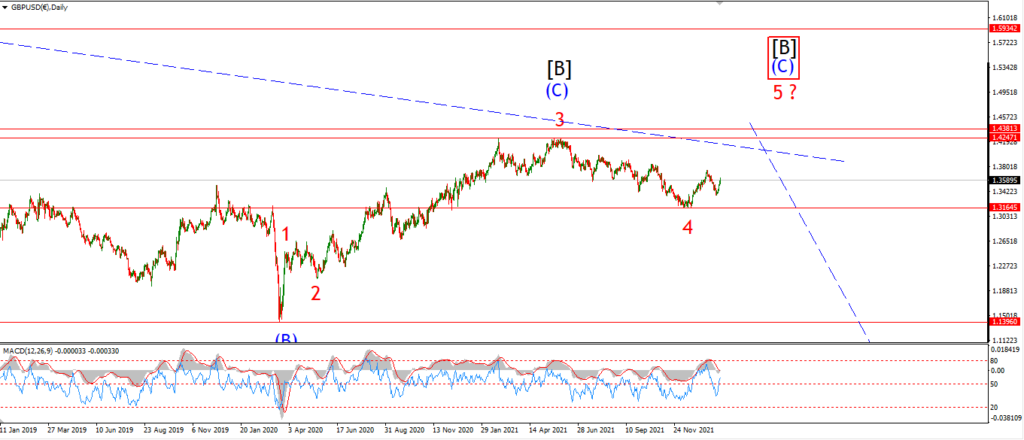
Another day stuck in a correction for cable too.
I can still read the decline into wave ‘2’ of ‘c’ as a flat correction at the moment.
This will require that wave ‘2’ of ‘c’ holds above 1.3486.
a break of that level will invalidate the count for wave ‘b’ and ‘c’.
Tomorrow;
Watch for wave ‘2’ to complete above 1.3486.
The small trend channel for wave ‘2’ will be filled at 1.3530,
so a rally off that level will signal wave ‘3’ of ‘c’ is underway.
USDJPY.
USDJPY 1hr.
USDJPY 4hr.
USDJPY daily.
There is very little luck coming my way in the USD crosses this week!
Maybe a looming ww3 might have something to do with it!
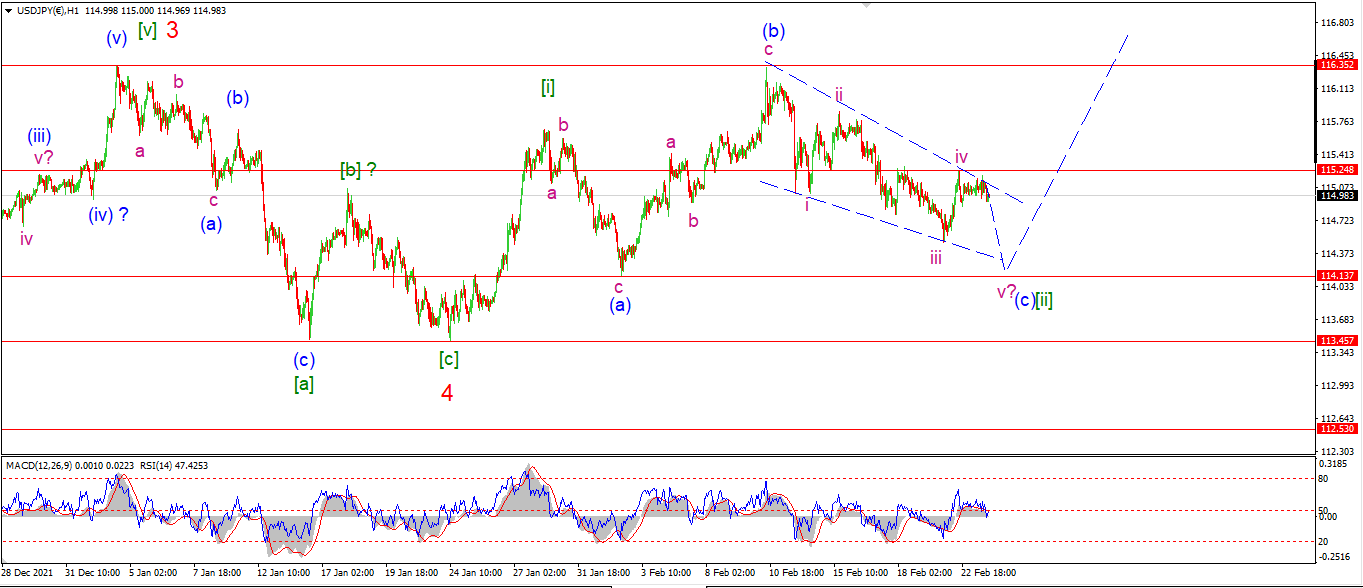
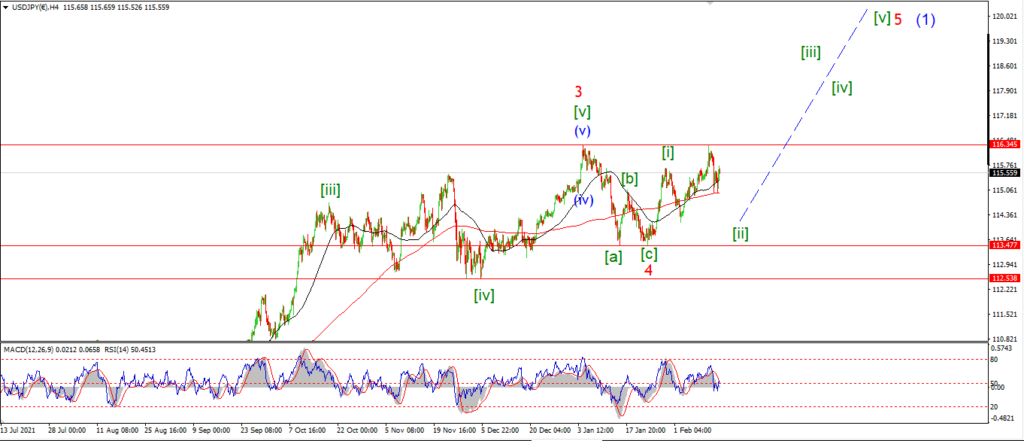
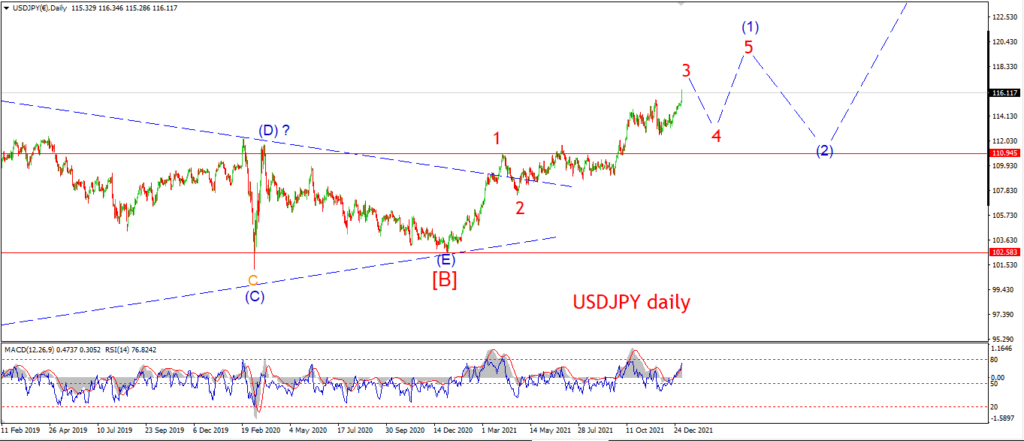
Wave (c) of [ii] is viewed as an ending diagonal at the moment.
A break of 114.13 is the ideal target for wave (c) to complete,
and once that happens I will immediately be looking higher again to begin wave (i) of [iii].
Tomorrow;
Watch for wave (c) to complete with a break of 114.13.
the low at 113.456 must hold.
Wave (i) of [iii] be confirmed with a rally above 116.35.
DOW JONES.
DOW 1hr.
DOW 4hr
DOW daily.
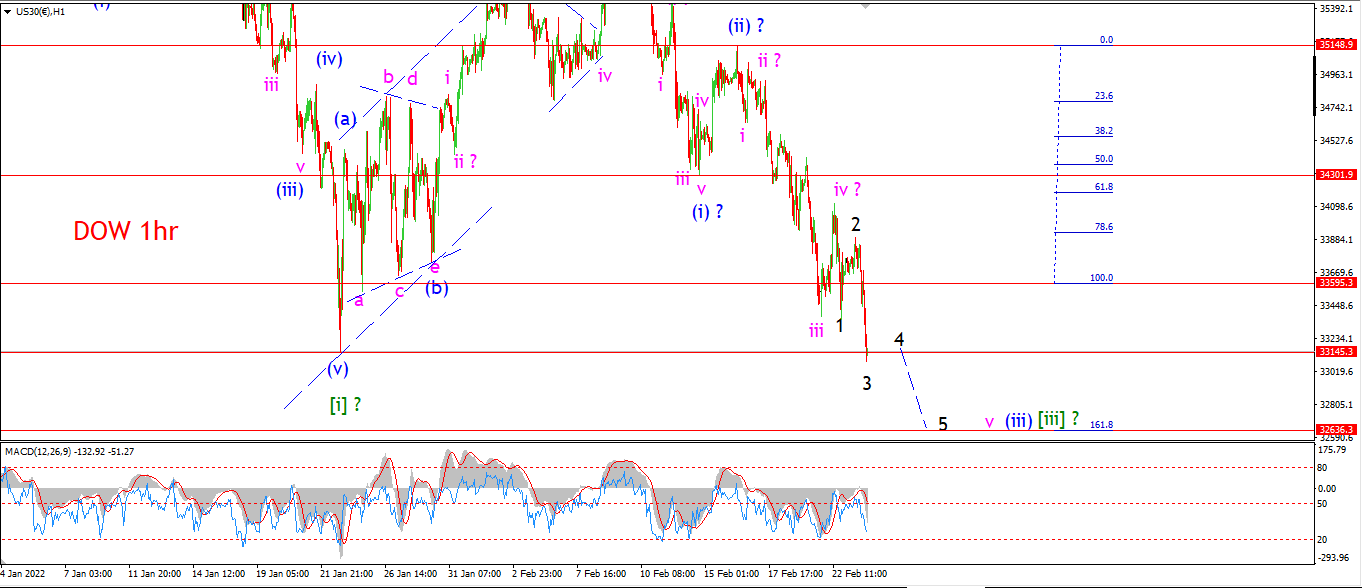
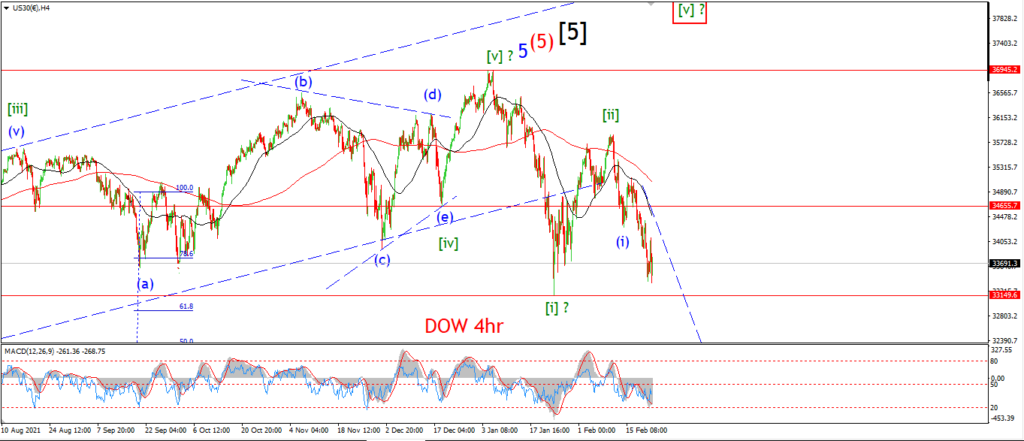
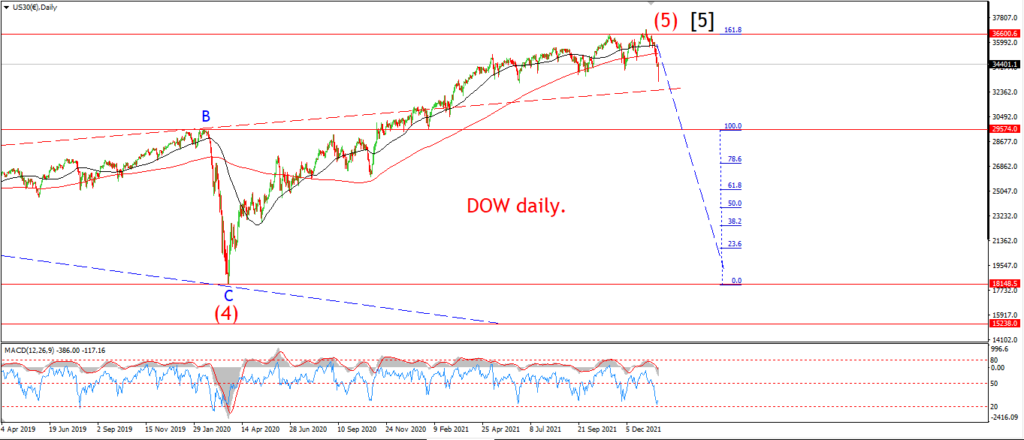
The progression of wave [iii] is going reasonable well so far.
I have only one issue with the structure in wave [iii] at this moment.
And that is how to read the internal pattern in wave (iii) of [iii].
There is a little more overlap within wave (iii) than I would like,
If this wave (iii) suddenly accelerates lower,
that will probably simplify the pattern for sure,
so that is one possibility here.
For the moment I am watching the Fibonacci relation between wave (i) and the current wave (iii) for clues.
The market has broken below the (i) = (iii) equality level again today at 33590.
And now it seems likely that wave (iii) will hit the 162% extensions of wave (i).
that target lies at 32636.
Wave ‘v’ of (iii) should fall into that level over the coming days.
Then I can look for a consolidation in wave (iv) of [iii] again.
Tomorrow;
Watch for wave ‘v’ to trace out a five wave decline into that target level at 32630.
GOLD
GOLD 1hr.
GOLD 4hr.
GOLD daily.
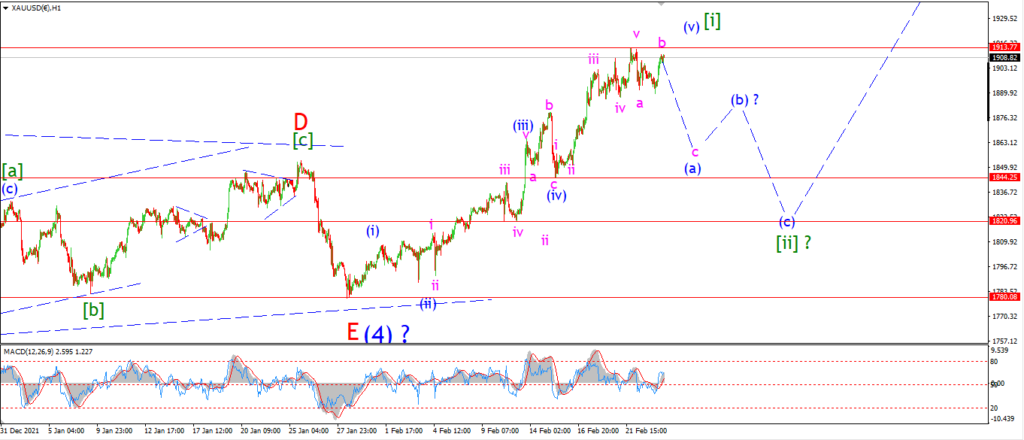
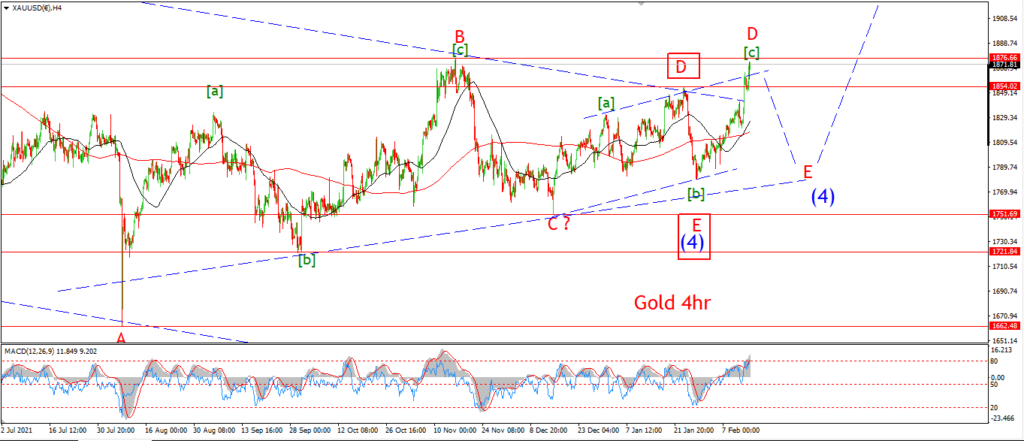
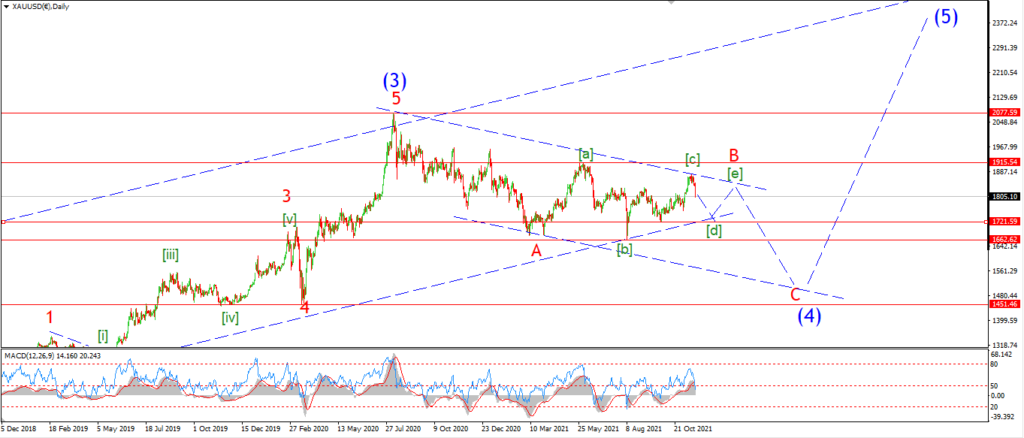
The fact that gold is failing to do very much over the last few sessions
is leading me to think that a topping process is in play here.
and that is pointing towards that wave [ii] reversal idea that I am looking at.
I have labelled wave (a) of [ii] as underway this evening.
The pattern can be viewed as waves ‘a’ and ‘b’ of (a).
with a sharper decline coming soon in wave ‘c’ of (a).
This is all speculative until wave ‘c’ actually does fall again to complete three waves down.
Tomorrow;
Watch for that recent high at 1913 to hold and wave ‘c’ of (a) to fall again by tomorrow evening.
Wave ‘c’ should hit the 1870 area to complete.
CRUDE OIL.
CRUDE OIL 1hr.
CRUDE OIL 4hr.
CRUDE OIL daily.
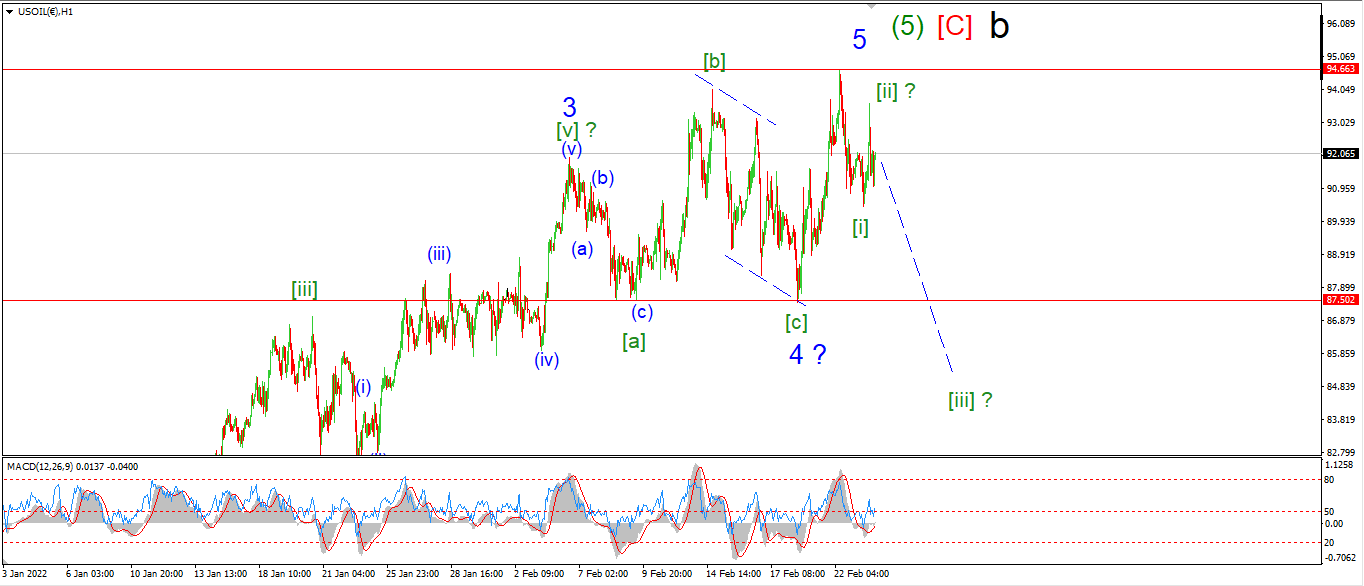
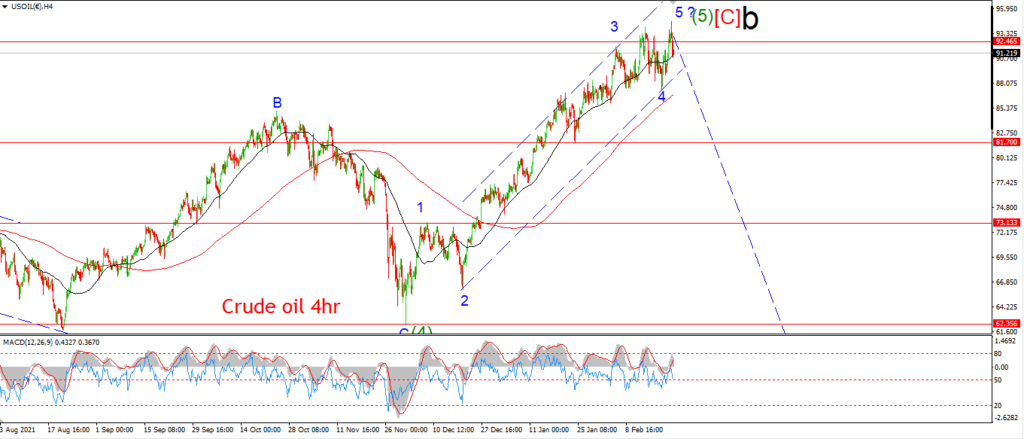
Crude did create a small lower high today after an early spike this morning.
But as I write this evening the price has fallen back again to flat on the day.
So the question is this,
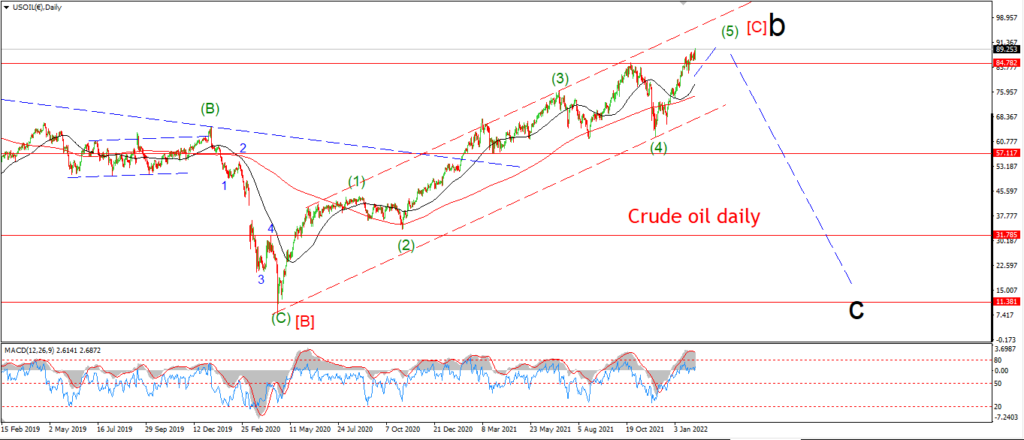
are we looking at a bearish impulse wave off the top here?
Wave [i] and [ii] must lead to an acceleration lower into wave [iii] over the coming few sessions.
This wave count will be confirmed or denied pretty soon in this case.
Tomorrow;
I would suggest wave [iii] down should begin tomorrow with a sharp drop below 90.00 again.
Wave [iii] should easily push down into the previous fourth wave area at 87.50 again.
Lets see if the high at wave ‘5’ continues to hold.
S&P 500.
S&P 500 1hr
S&P 500 4hr
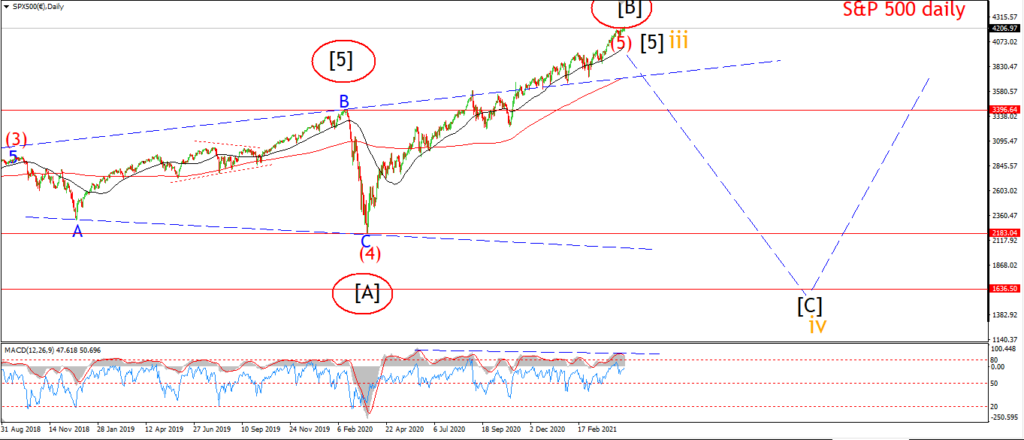
S&P 500 daily.
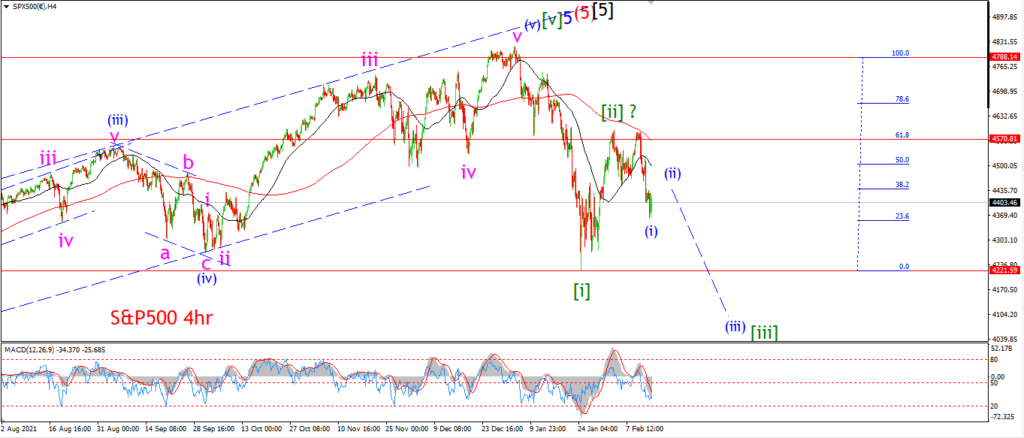
the S&P is now back at the January lows again this evening after a long hard rally to nowhere over the last month!
Every day that we step lower into a possible third wave down,
is another day closer to the all out financial calamity that I have warning about for some time now.
So here we are again on the brink.
If this count is correct,
then I think we can view this current scenario as similar to where the market stood in early summer 2008.
The world was oblivious,
but the world heated up pretty quick after that.
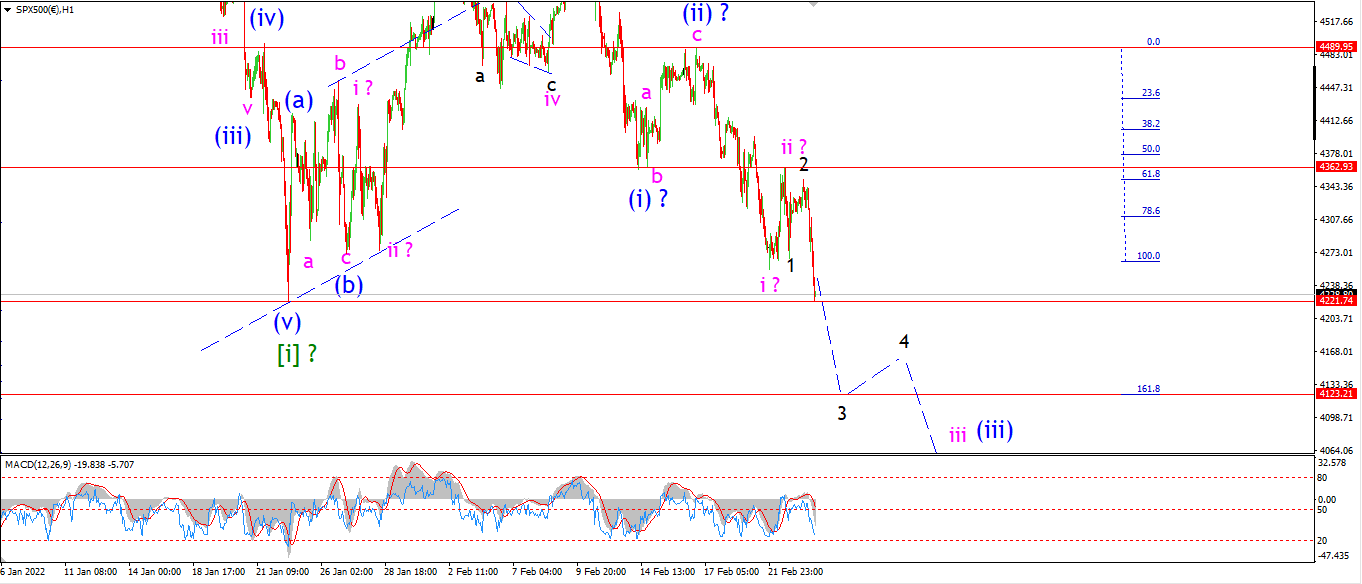
This short term count is tracking a third of a third wave down now.
And a solid break below 4220 again will only reinforce that idea.
Wave (iii) is now in line to hit the 162% extension of wave (i) if the decline continues tomorrow.
That level comes in at 4123.
Infact the wave count in wave (iii) suggests an even larger decline for wave (iii).
But I will take each day as it comes.
Tomorrow;
Watch for wave ‘3’ of ‘iii’ to continue lower over the next few sessions.
The high at wave ‘ii’ should not be broken again in this wave count.
SILVER.
SILVER 1hr
SILVER 4hr.
SILVER daily.
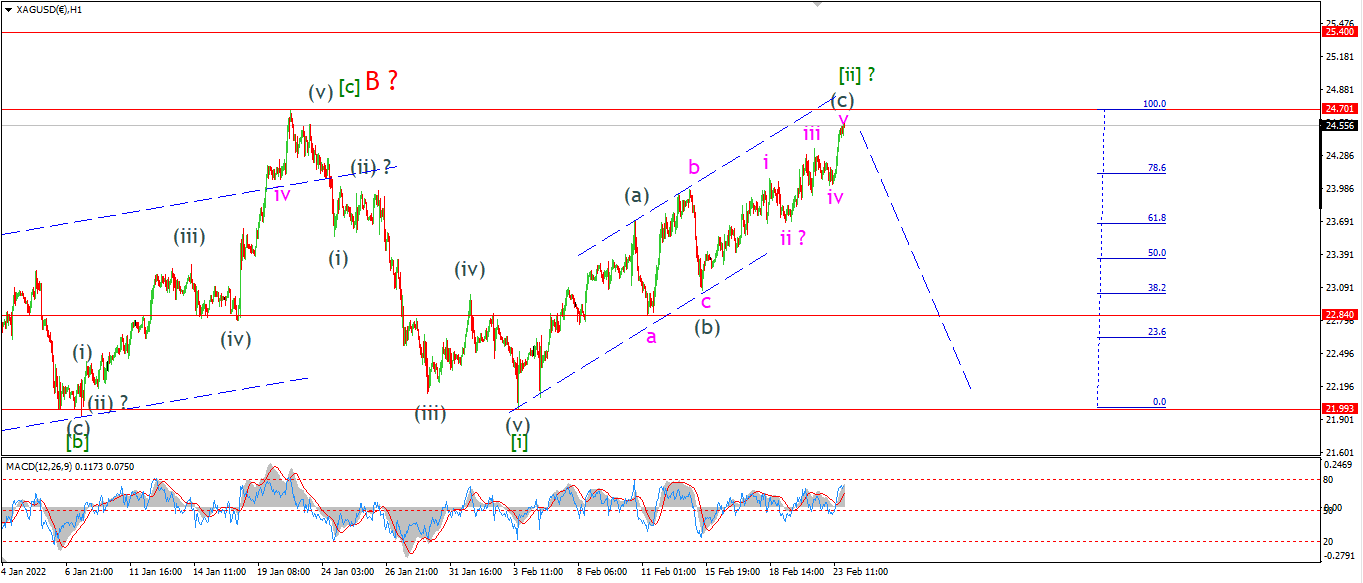
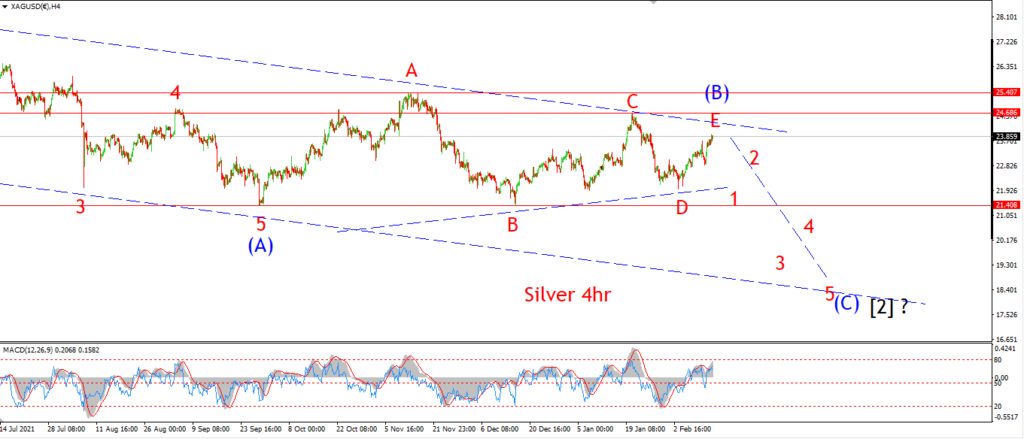
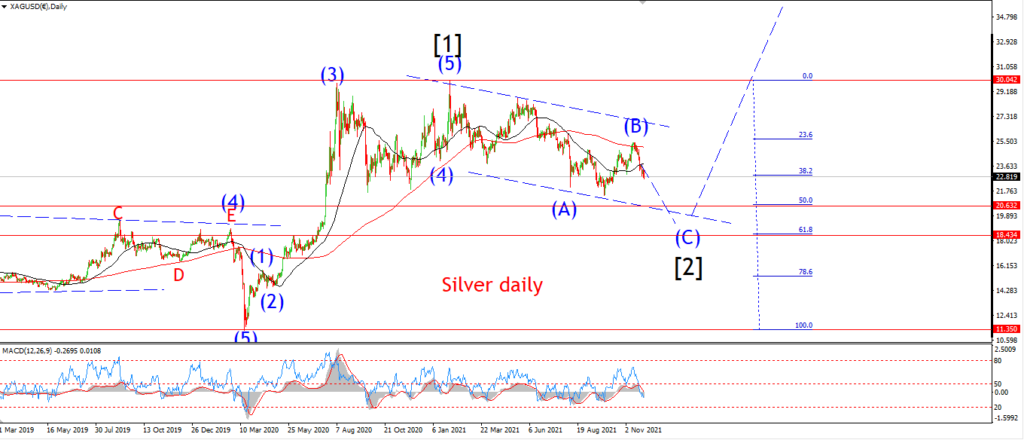
we are at a critical point in this wave count now.
I will be honest here and say that if the high at 24.70 breaks,
then I will have to go back to the drawing board again in my assumptions for silver.
So I am willing tonight to stay silent and let the market speak for itself tomorrow before I make any grand presumptions on where we go next.
In general I still believe that silver needs a new decline phase to complete a larger structure in wave [2].
but how we get there is puzzeling me right now.
I am going to wait to see of the highs at 24.670 holds.
A sharp reversal will bring the pattern back in line again.
BITCOIN
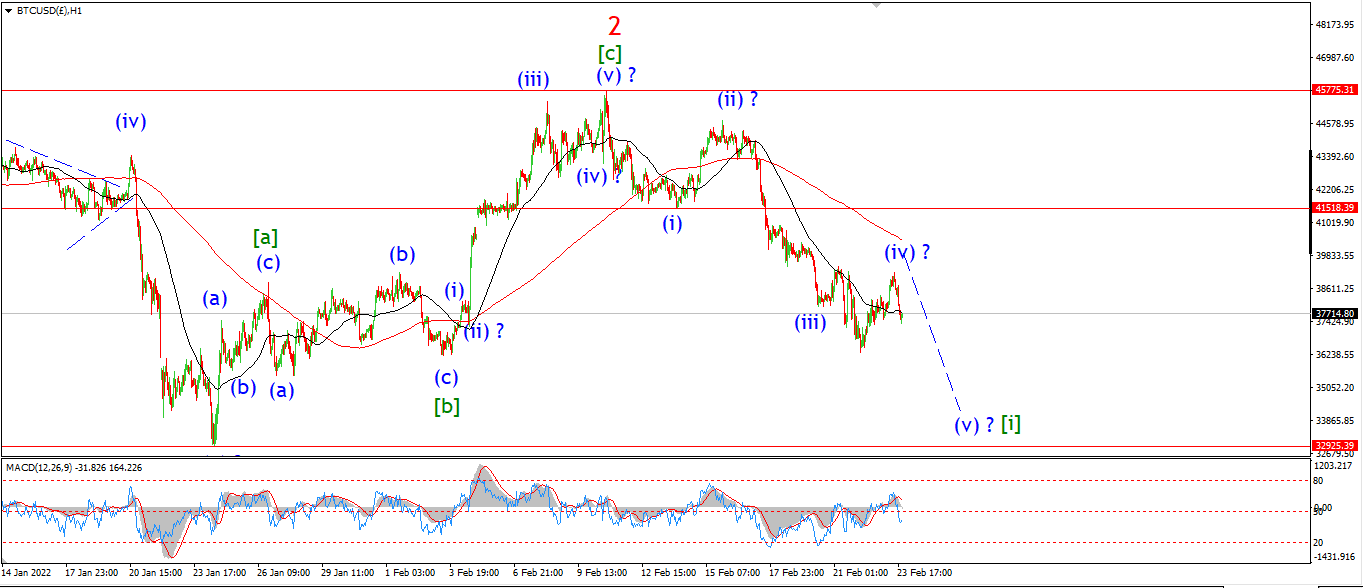
BITCOIN 1hr.
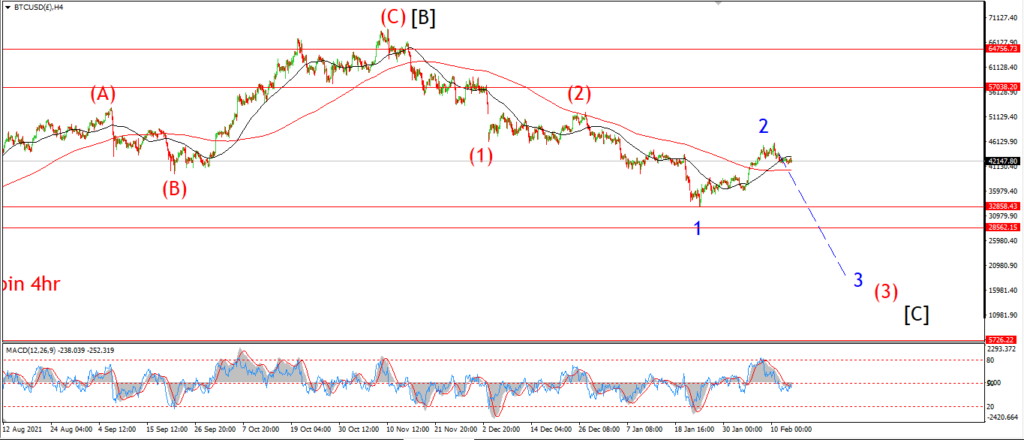
BITCOIN 4hr.

BITCOIN daily.
….
FTSE 100.
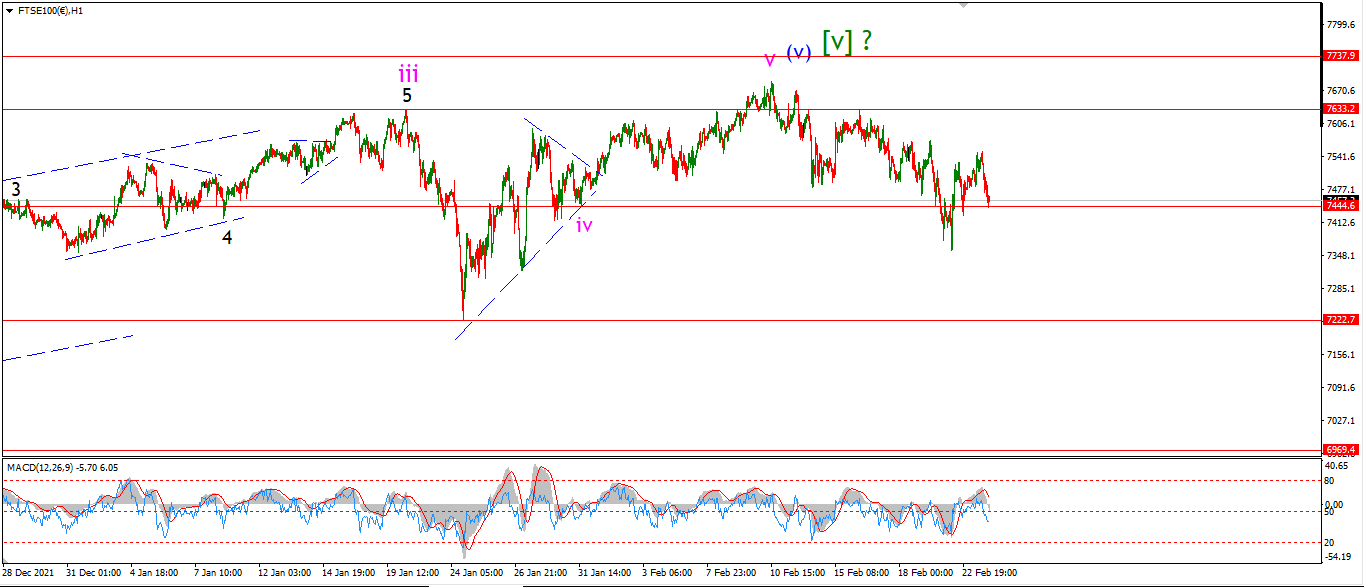
FTSE 100 1hr.
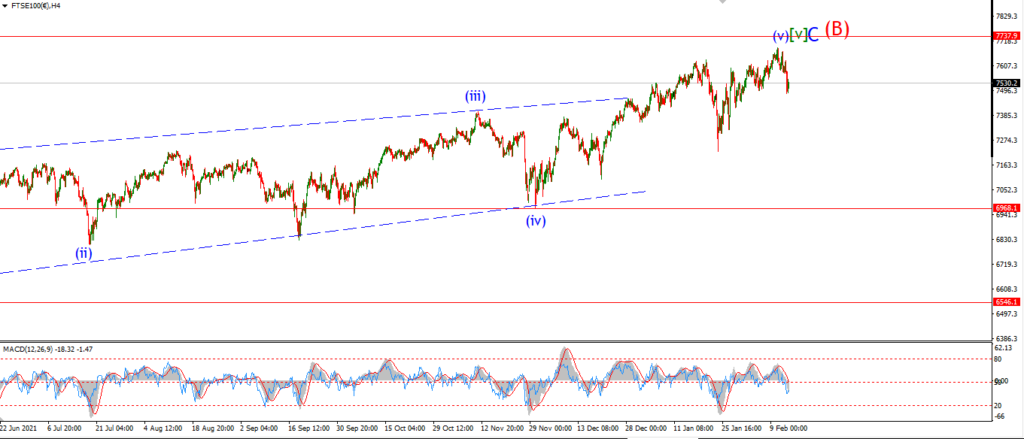
FTSE 100 4hr.

FTSE 100 daily.
….
DAX.
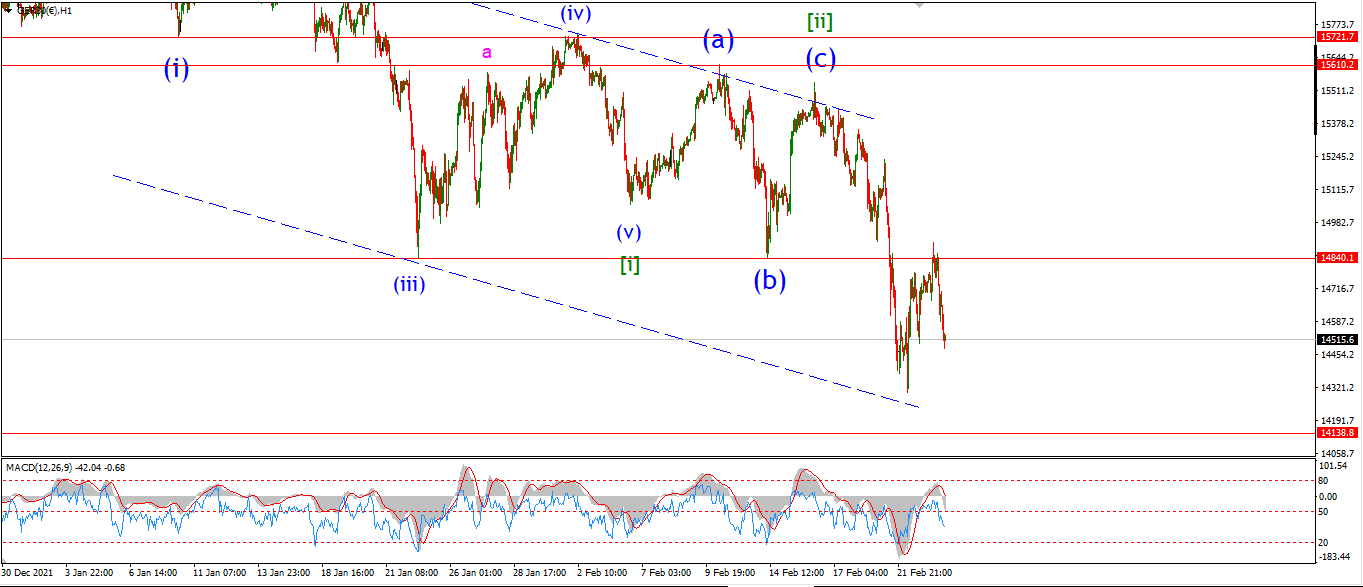
DAX 1hr
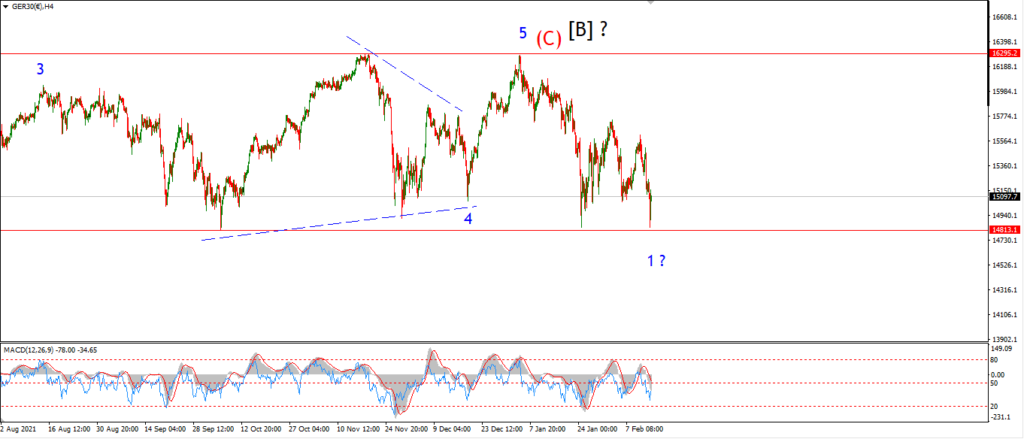
DAX 4hr
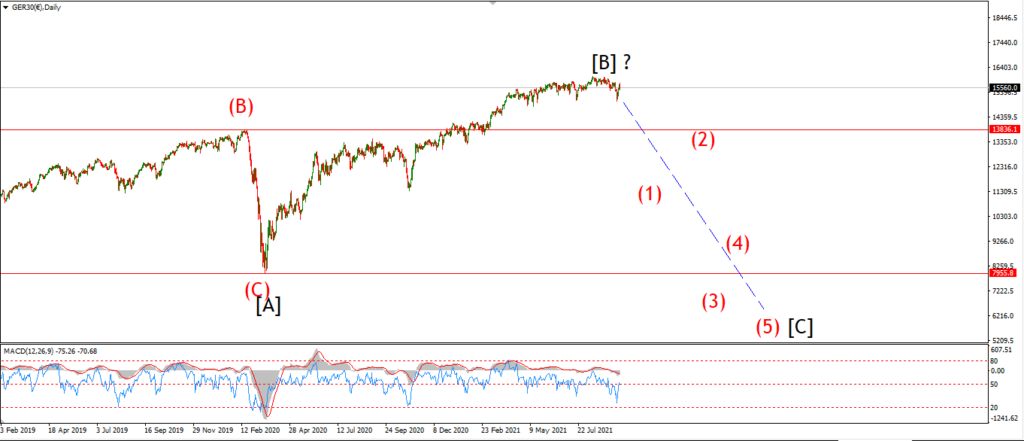
DAX daily.
….
NASDAQ 100.
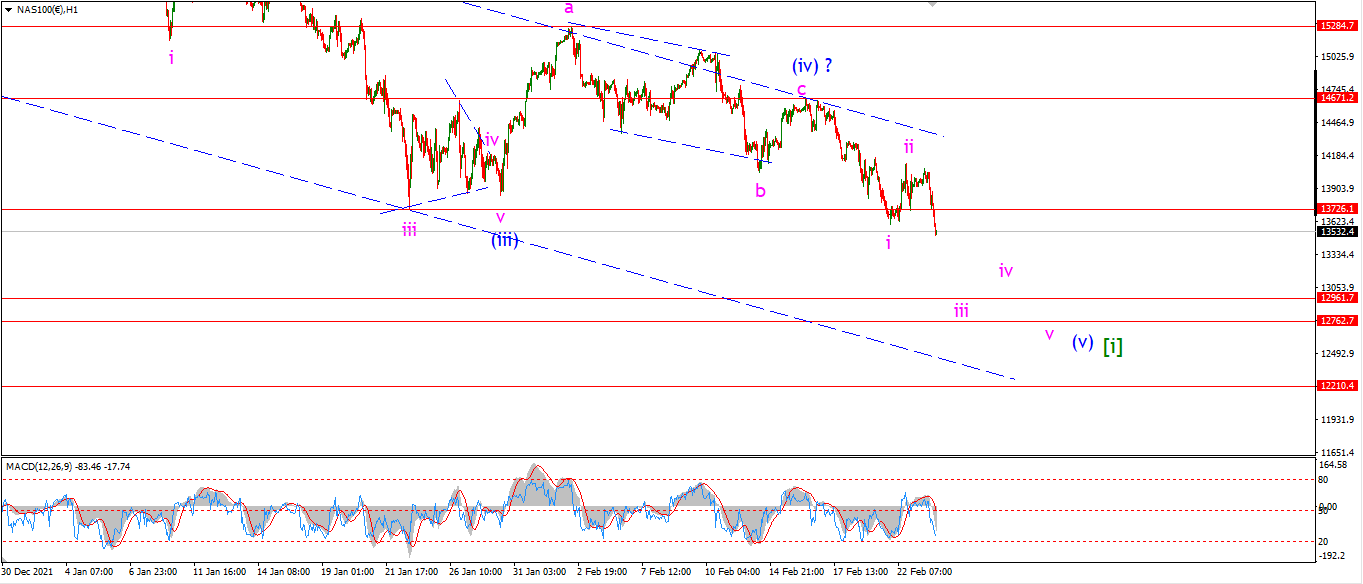
NASDAQ 1hr
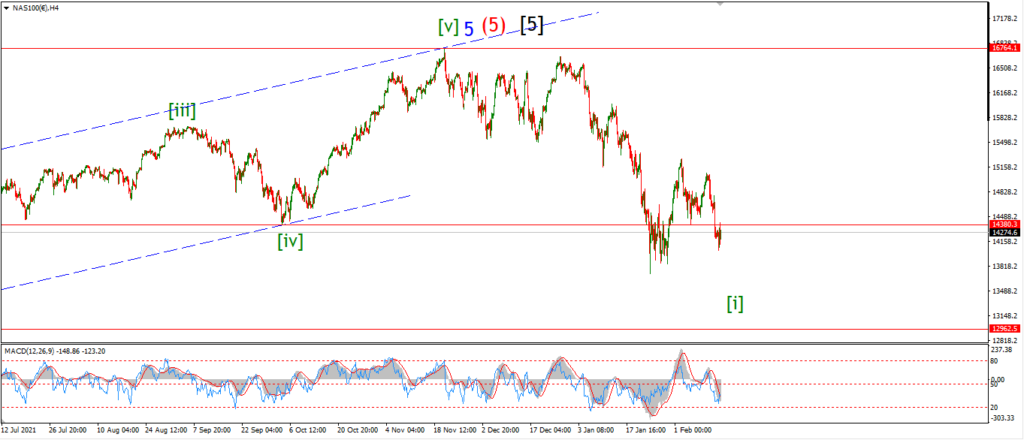
NASDAQ 4hr.
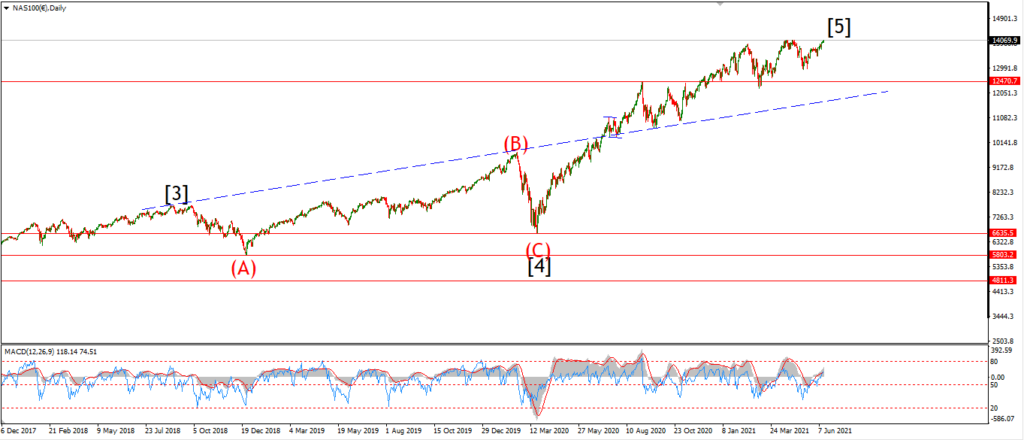
NASDAQ daily.
….