
Good evening again, what a day its been!
may the Lord bless you all tonight.
There are definite signs of shifting sands beneath the markets again this week. No I can’t confirm the top is in again, but the action in numerous markets is starting to hint at it!
Here is an interesting chart that should send shivers down the spine of every central planner!

These charts have dis-inflation written all over them! And if the long term trend keeps going, then this will turn into outright deflation.
EURUSD.
EURUSD 1hr.
EURUSD 4hr.
EURUSD daily.
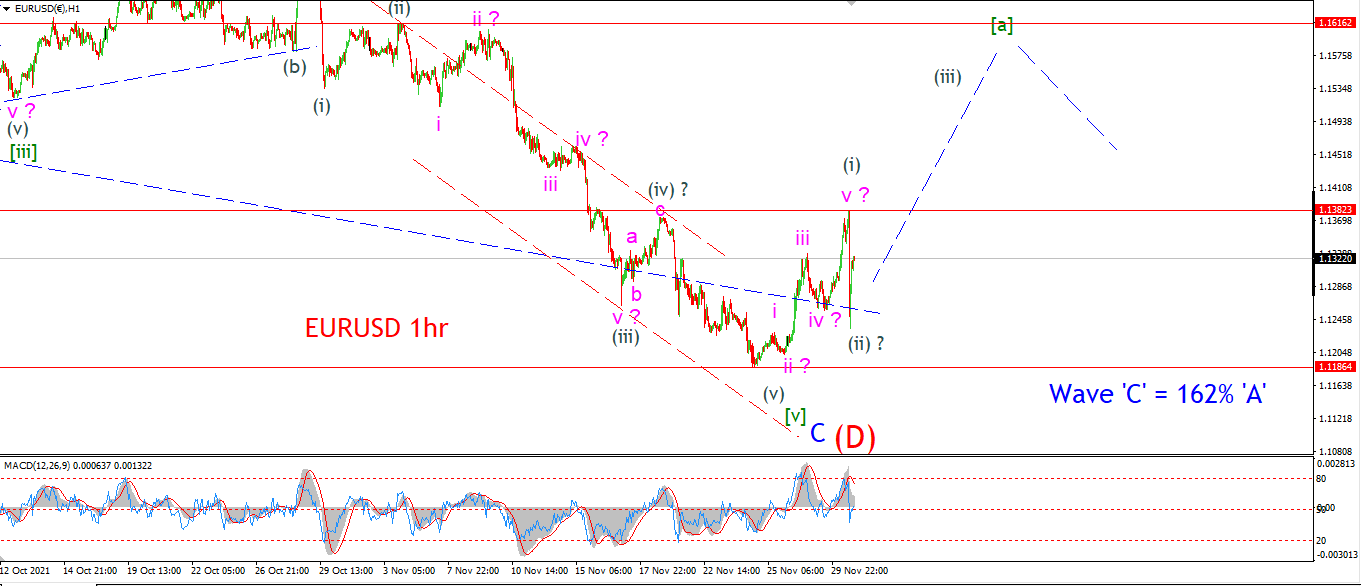
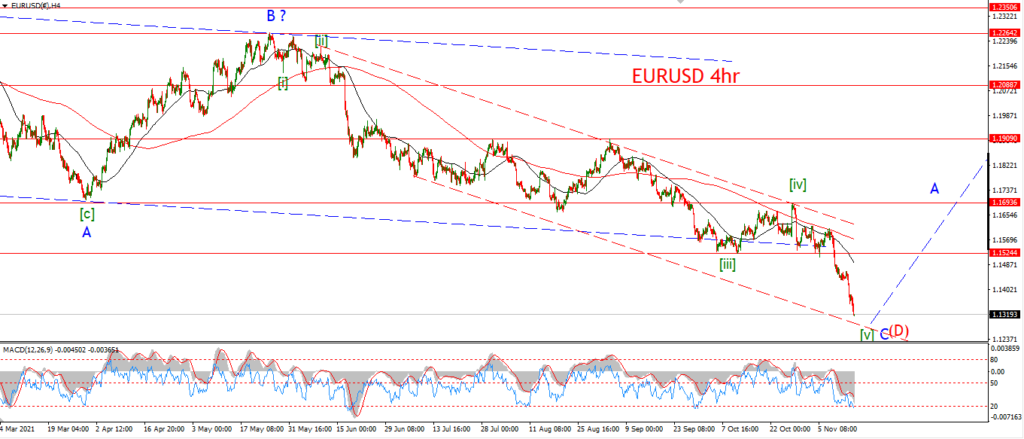
There is now five waves up complete off the 1.1186 low at wave ‘C’.
That rally in wave ‘v’ of (i) just pipped above the wave (iv) high,
and then price took a hit directly lower again.
So far the higher low is holding and I have labelled this action as wave (i) and (ii).
Now we need a rally in wave (iii) of [a] to rally out above 1.1400 again.
This action will signal wave (iii) of [a] is underway.
Tomorrow;
Watch for the low at 1.1186 to hold and wave (iii) to begin a five wave rally out above 1.1500 again.
GBPUSD
GBPUSD 1hr.
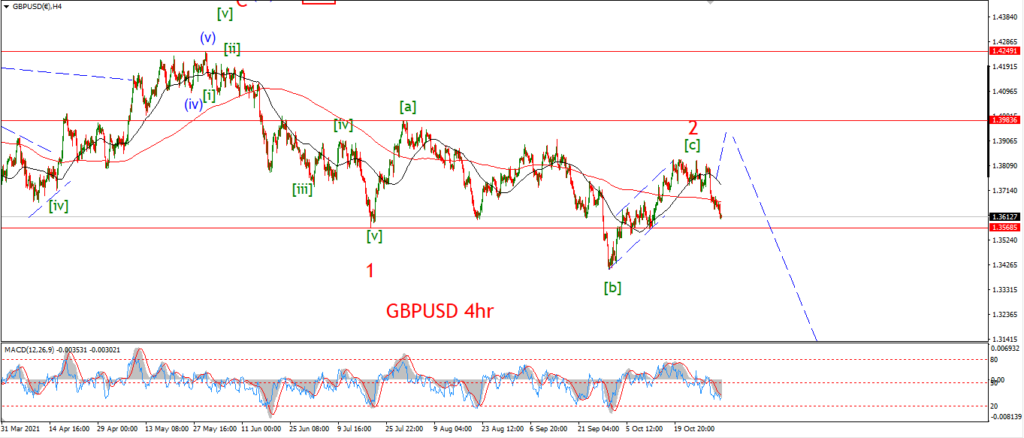
GBPUSD 4hr.
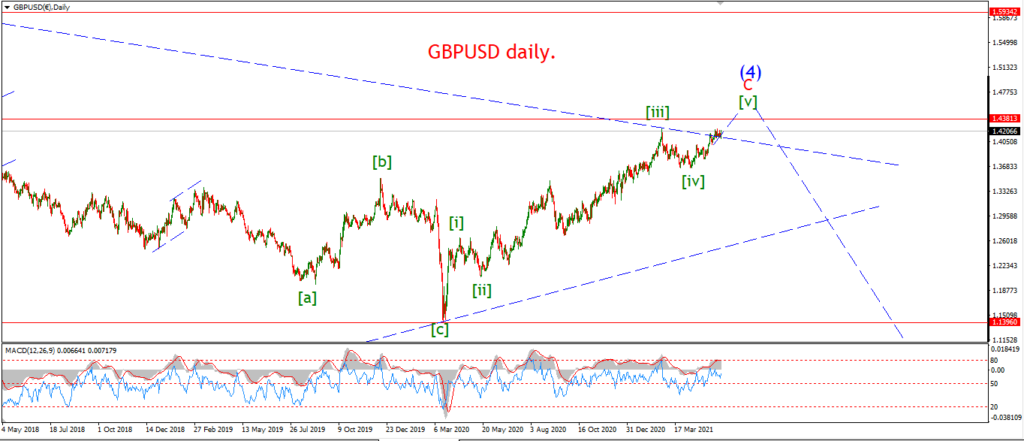
GBPUSD daily.
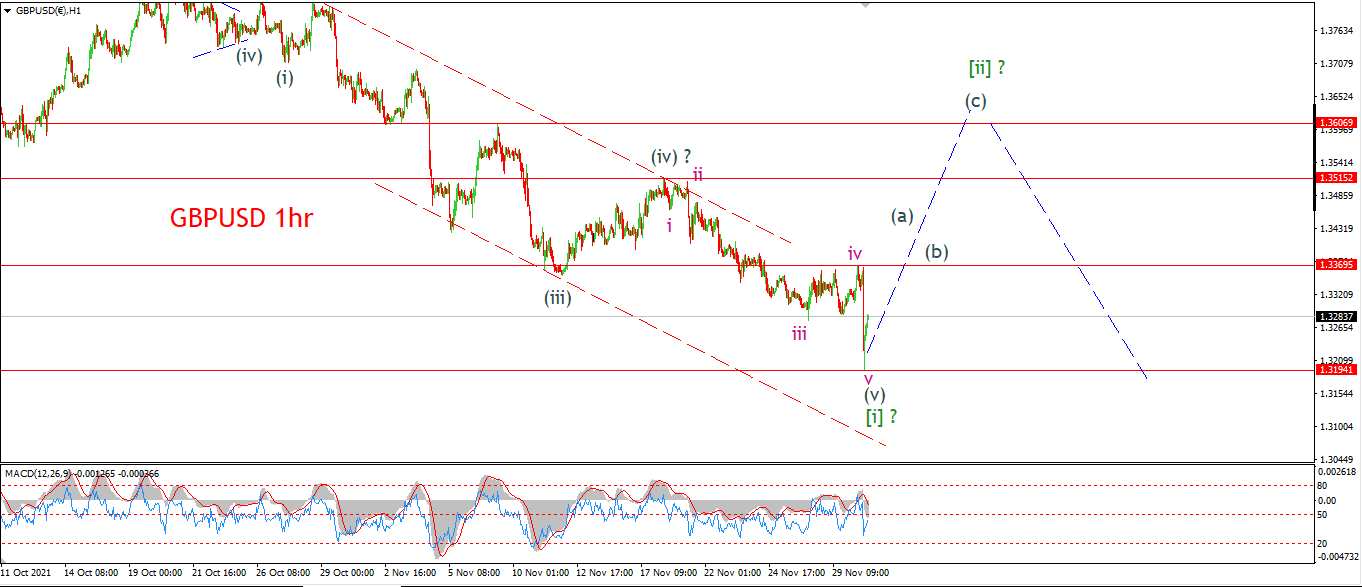
One more spike lower to break 1.3200 today may be enough to complete wave ‘v’ of (v) of [i] now.
The price has rebounded off the low and now wave [ii] should begin.
Wave (a) of [ii] should break above the wave ‘iv’ high at 1.3370 at a minimum.
Tomorrow;
Watch for wave [i] to hold at 1.3194.
Wave (a) should rise in at least three waves over the coming days.
And overall I am looking at the gap between 1.53 and 1.36 as a target for wave [ii].
USDJPY.
USDJPY 1hr.
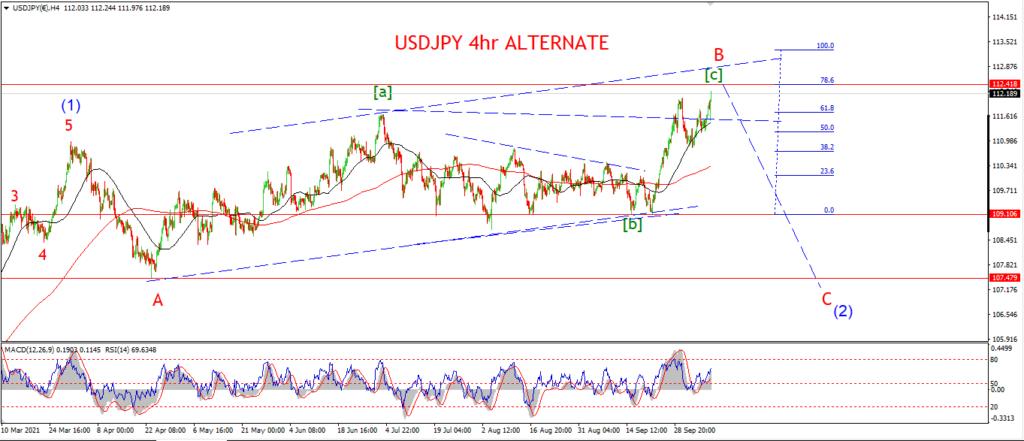
USDJPY 4hr.
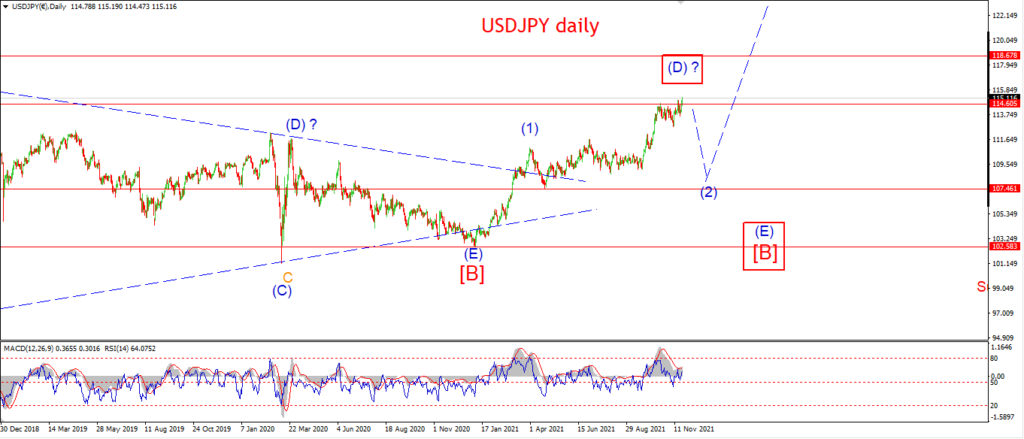
USDJPY daily.
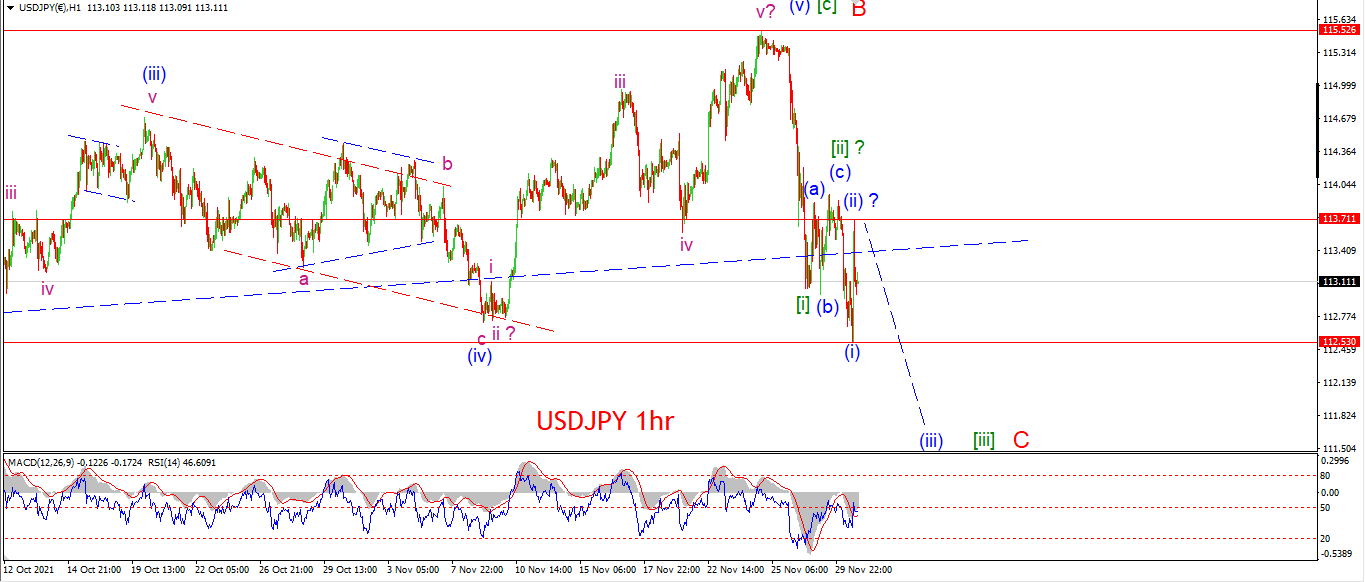
USDJPY has dropped off the wave [ii] high in a five wave pattern overnight and into this morning.
Wave [ii] should now be complete at 113.95.
Todays drop is labelled as wave (i) of [iii].
And the price action is again moving to favor that count this evening.
With another lower high in place at wave (ii),
and a spike lower to begin wave (iii) of [iii].
Tomorrow;
Watch for wave (ii) to hold at 113.71.
Wave (iii) down should break 112.53 to confirm the pattern.
DOW JONES.
DOW 1hr.
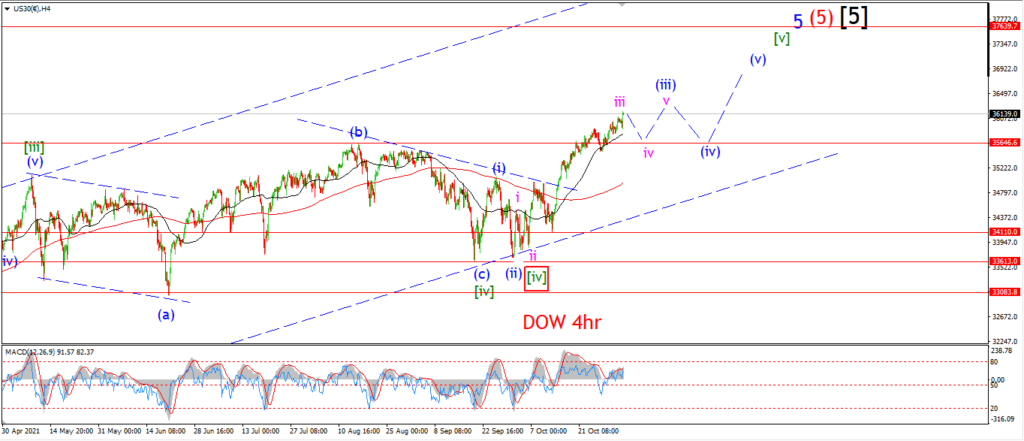
DOW 4hr
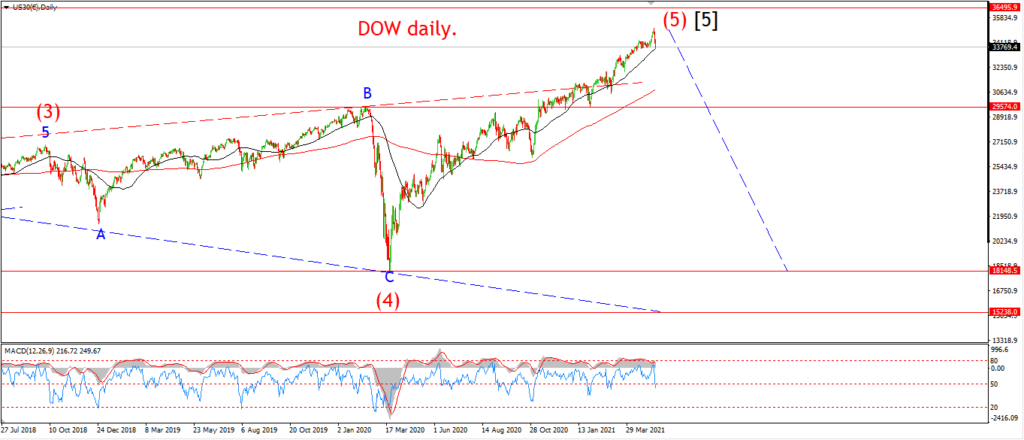
DOW daily.
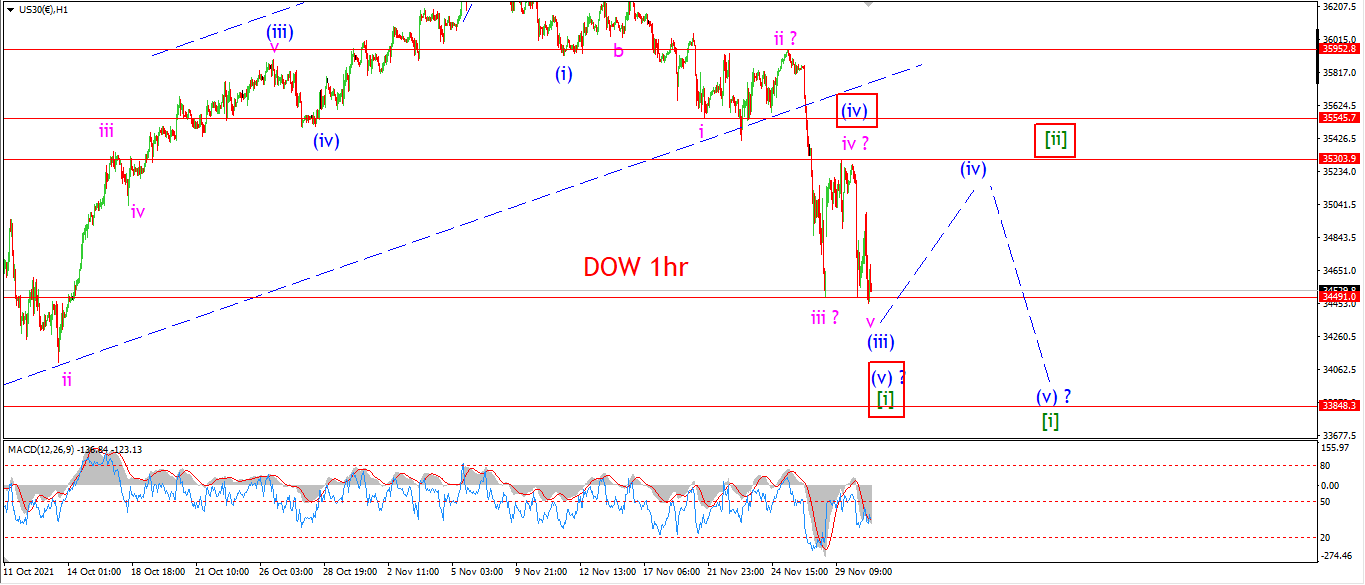
Further declines today have again favored the bearish count.
The market is close to tracing out five waves down now,
so a corrective rebound is on the cards soon.
Todays decline is explained well in both counts on the hourly chart.
The low of the session is either wave ‘v’ of (iii) of [i],
and this is the main count.
Or wave (v) of [i] as per the alternate count.
Both counts are valid, although I favor the first count at the moment.
And both counts call for a rebound in a correction from these lows.
The main count calls for wave (iv) to correct higher,
and the alternate calls for a larger correction in wave [ii].
The size of the rebound off this low will determine which count is correct.
Tomorrow;
Watch for wave (iii) to find a low very soon,
and from there we should see a correction higher into wave (iv) at least.
Wave (iv) can take numerous forms from here,
so I will just wait and see what unfolds.
GOLD
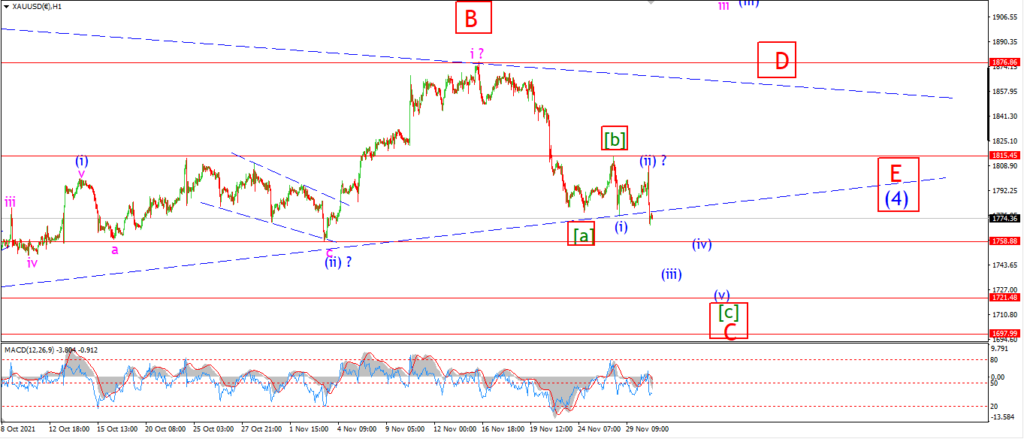
GOLD 1hr.
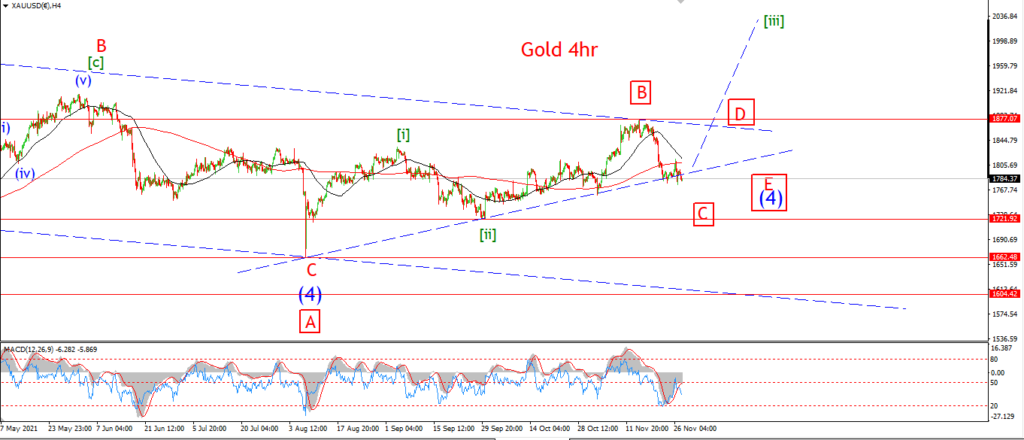
GOLD 4hr.
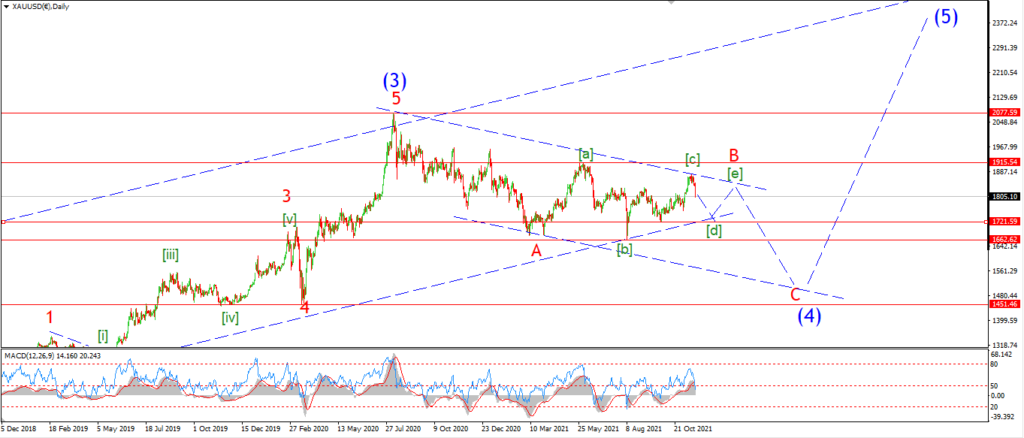
GOLD daily.
Gold has now failed to rally into a third wave up again today.
While this decline has not ruled out the bullish count,
it sure does not help things either!
I will now concentrate on the first alternate count for a triangle in wave (4) as shown.
This requires a three wave decline into wave ‘C’ as shown in red.
And todays decline can be viewed as the beginning of a five wave decline into wave [c] of ‘C’.
If the price breaks below 1758 again that will trigger this count,
and then we can look forward to an extended sideways move to complete wave (4) over the next month or so.
Tomorrow;
1758 is key.
A break of that level will confirm wave (iii) of [c] of ‘C’.
CRUDE OIL.
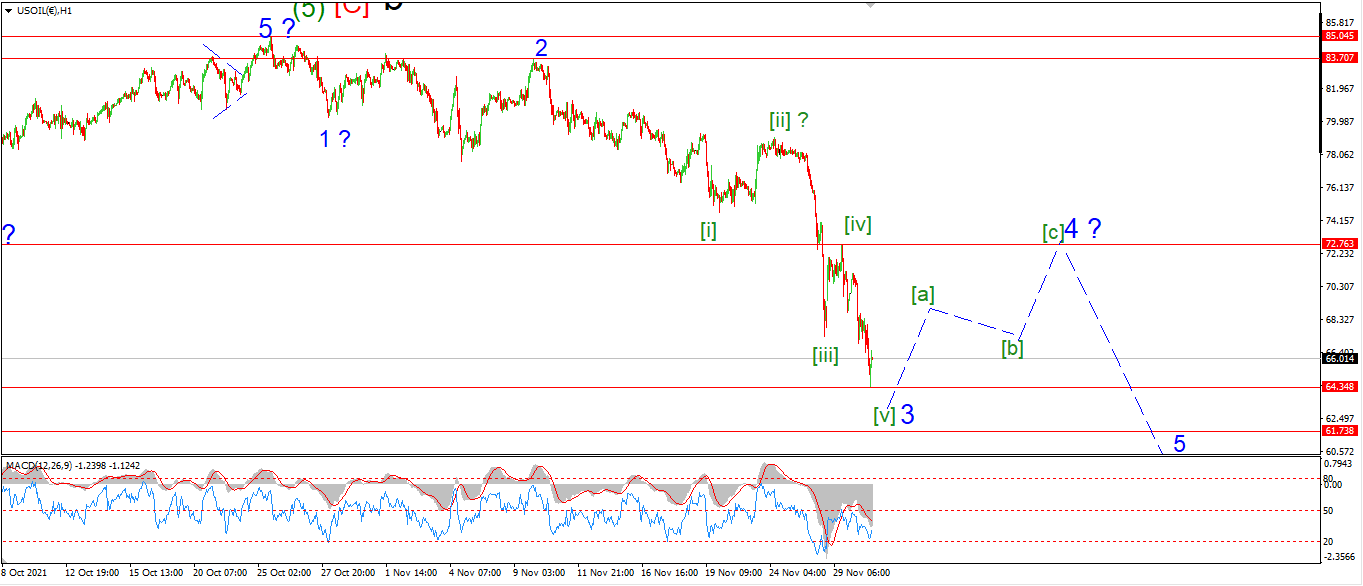
CRUDE OIL 1hr.
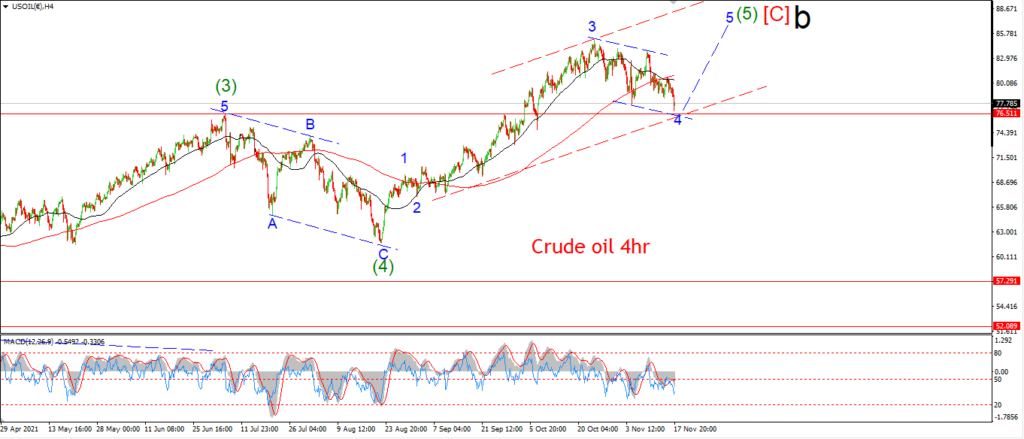
CRUDE OIL 4hr.
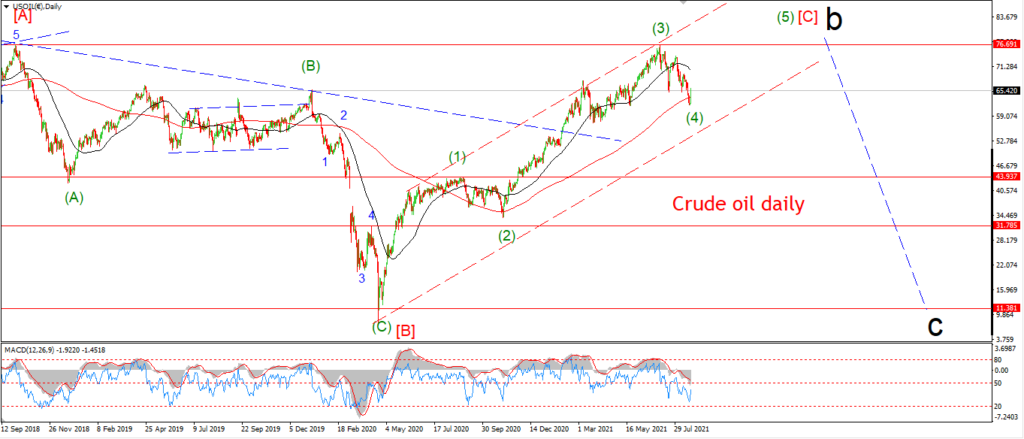
CRUDE OIL daily.
The action in crude oil over the last month is a definite shot over the bow for the global economy,
falling oil prices,
against the backdrop of an almost unprecedented flow of bad news on inflation pressures.
these two facts do not support each other!
I am taking this as a real warning sign that the global slowdown is real,
and we may well be transitioning into another recession.
I can back that up with the big decline in black Friday sales last week.
https://www.cnbc.com/2021/11/27/black-friday-shopping-in-stores-drops-28percent-from-pre-pandemic-levels.html
That is a canary in the coalmine if I ever saw one!
AS for the count.
I have marked todays decline as wave [v] of ‘3’.
There may be another dip to a final low in wave [v],
but this should mark a low for wave ‘3’ now and we should see a corrective rebound into wave ‘4’ over the coming week or so.
I am looking at the area around wave [iv] at 72.70 as the initial target for wave ‘4’ to target.
Tomorrow;
Wave [v] of ‘3’ will find a low soon.
If we see a bounce above 70.00 again that will signal wave [a] of ‘4’ is underway.
S&P 500.
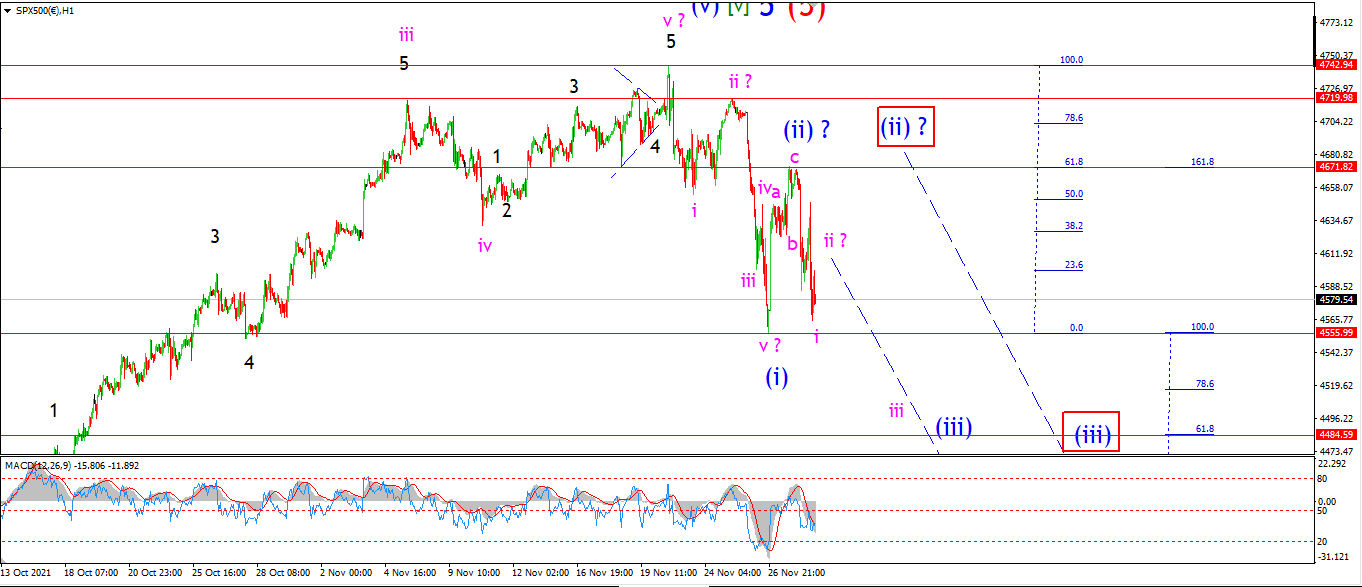
S&P 500 1hr
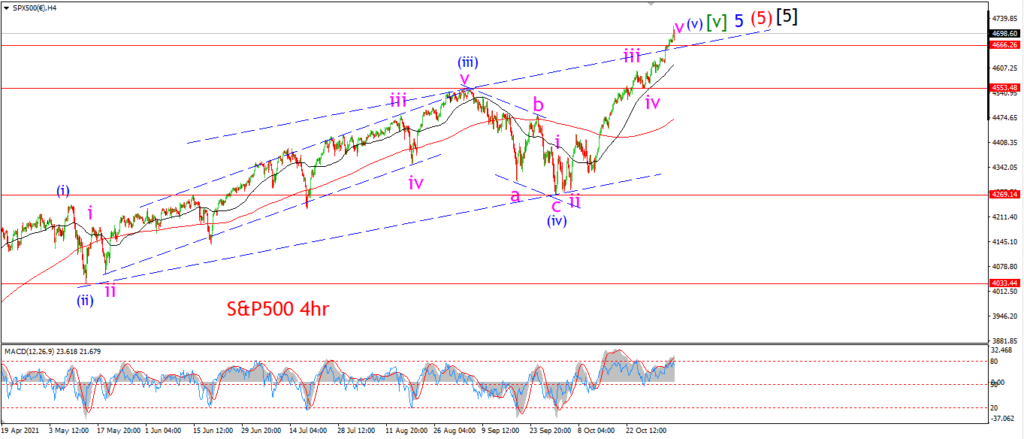
S&P 500 4hr
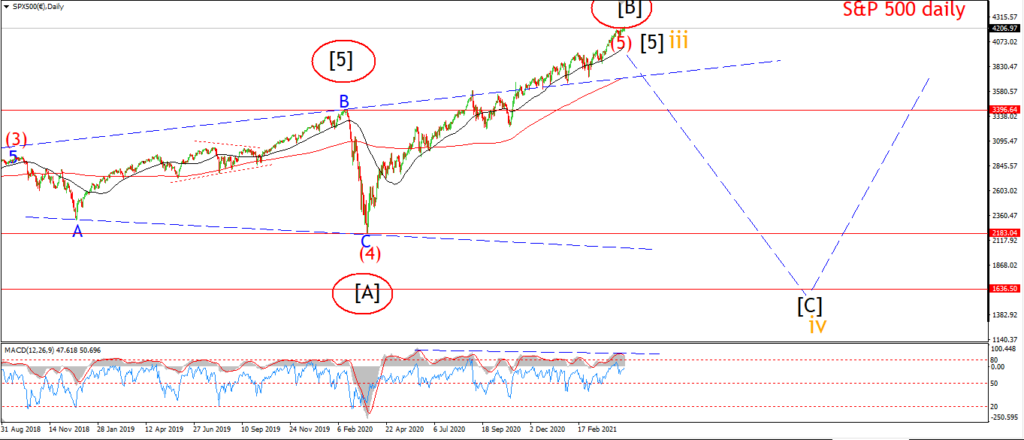
S&P 500 daily.
The S&P has not broken to a new low below wave (i) yet,
but we do have a solid lower high in place at wave (ii),
and a decline to begin a possible wave (iii) down today.
So this pattern is really starting to heat up here!
I have labelled todays low as wave ‘i’ of (iii) now.
And in this case wave ‘ii’ will create another lower high below 4640 early tomorrow.
This brings us to a key point in the pattern now.
If this count is correct,
then we are on the verge of another acceleration lower into wave ‘iii’ of (iii).
And that can easily carry the market below 4480 again.
Tomorrow;
First we need to see wave ‘ii’ complete a lower high below 4670 again.
A break below 4550 again will signal that wave ‘iii’ of (iii) is underway.
SILVER.
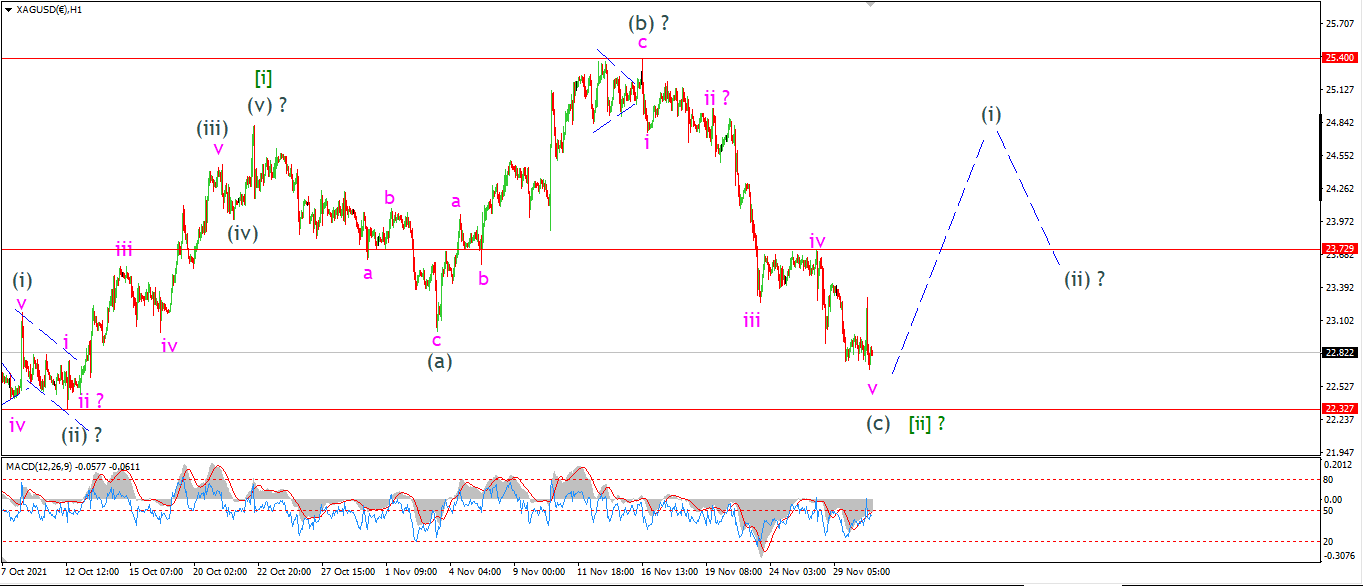
SILVER 1hr
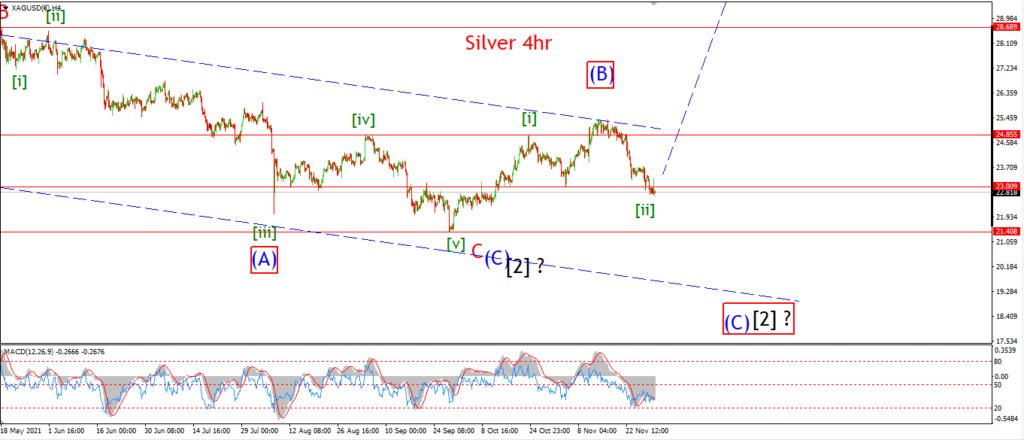
SILVER 4hr.
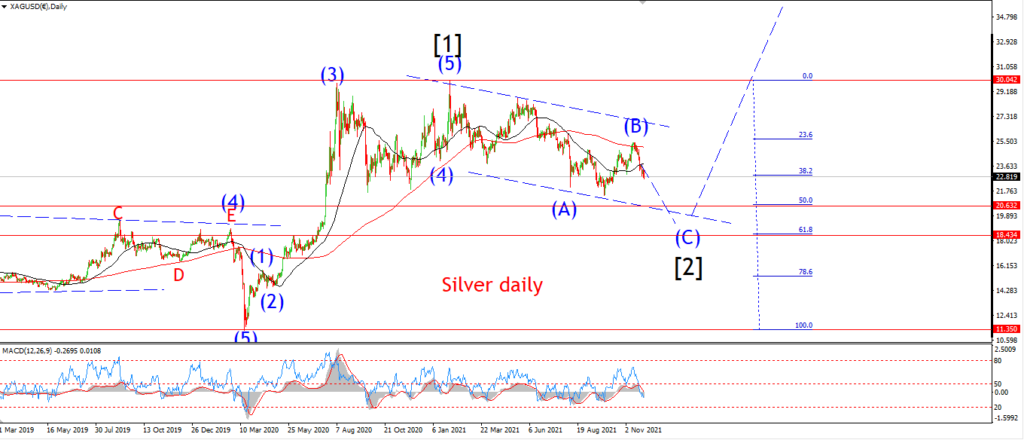
SILVER daily.
I have shown a new alternate count on the daily and 4hr charts tonight.
Much like gold,
this bullish pattern is not invalidated yet,
but I am preparing just incase the rally I am looking for, does not appear.
As for the main count.
The price has not rebounded off the lows yet, although there are signs of exhaustion in the decline for sure.
The price is attempting a rally with intermittent spike to the upside,
but so far these attempts have failed.
The lows are still viewed as the end of wave (c) of [ii].
and this should lead to a rally into wave (i) of [iii] over the coming days.
Tomorrow;
21.40 is the critical low for this count.
A break of that level will trigger the alternate count.
Lets see if wave (i) can push higher to break 23.73 again to signal the rally has begun.
BITCOIN
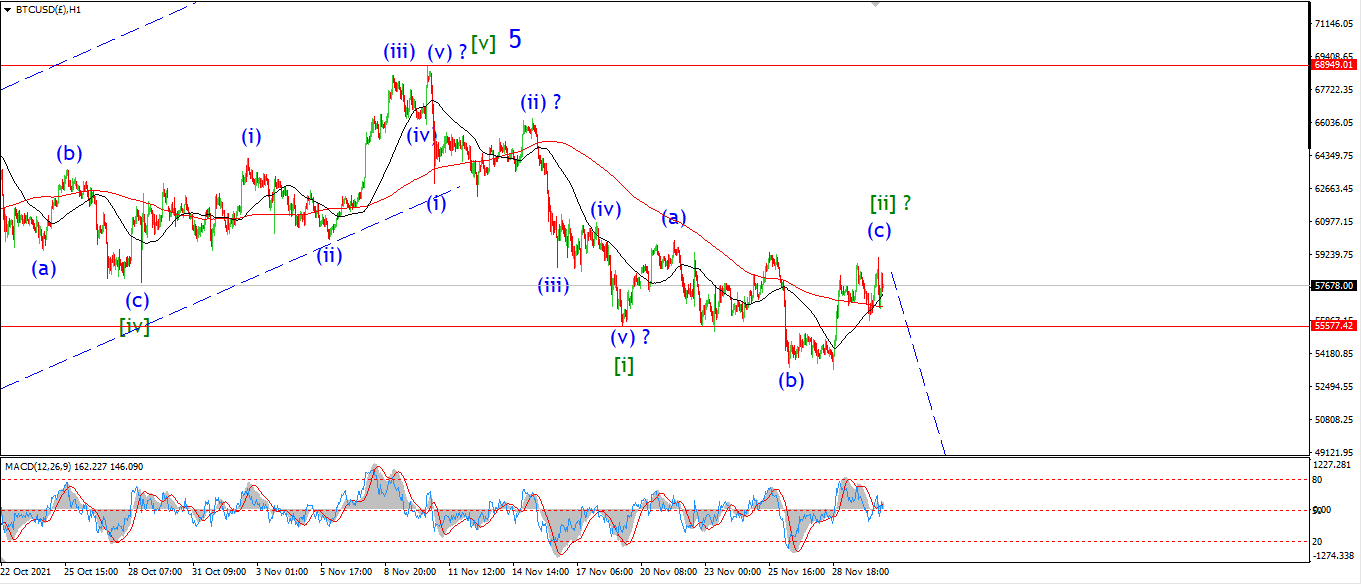
BITCOIN 1hr.
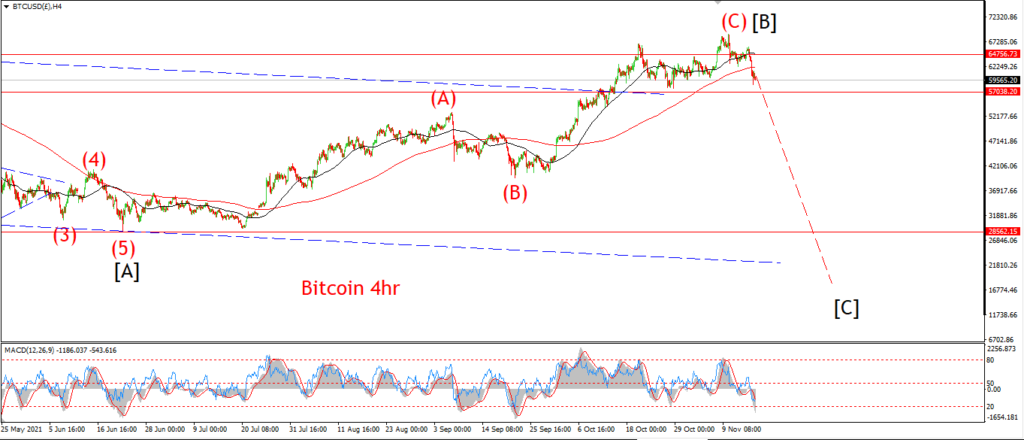
BITCOIN 4hr.

BITCOIN daily.
Topping in wave [B].
FTSE 100.
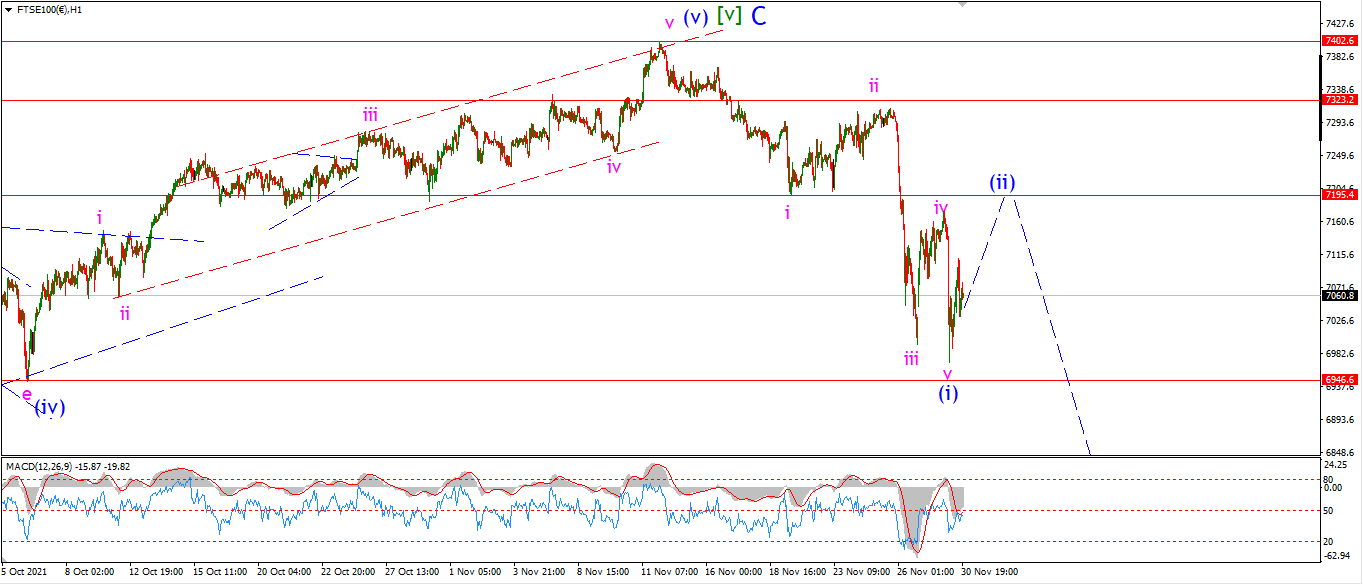
FTSE 100 1hr.
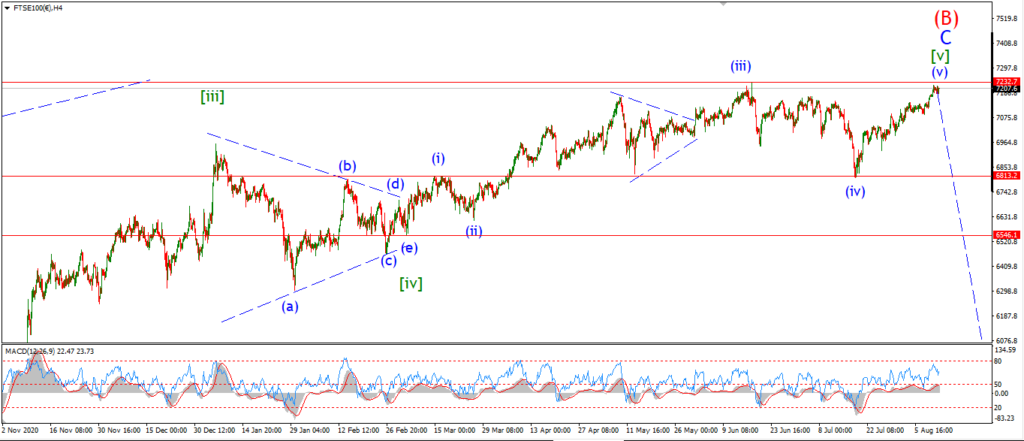
FTSE 100 4hr.

FTSE 100 daily.
Complete wave (B).
DAX.
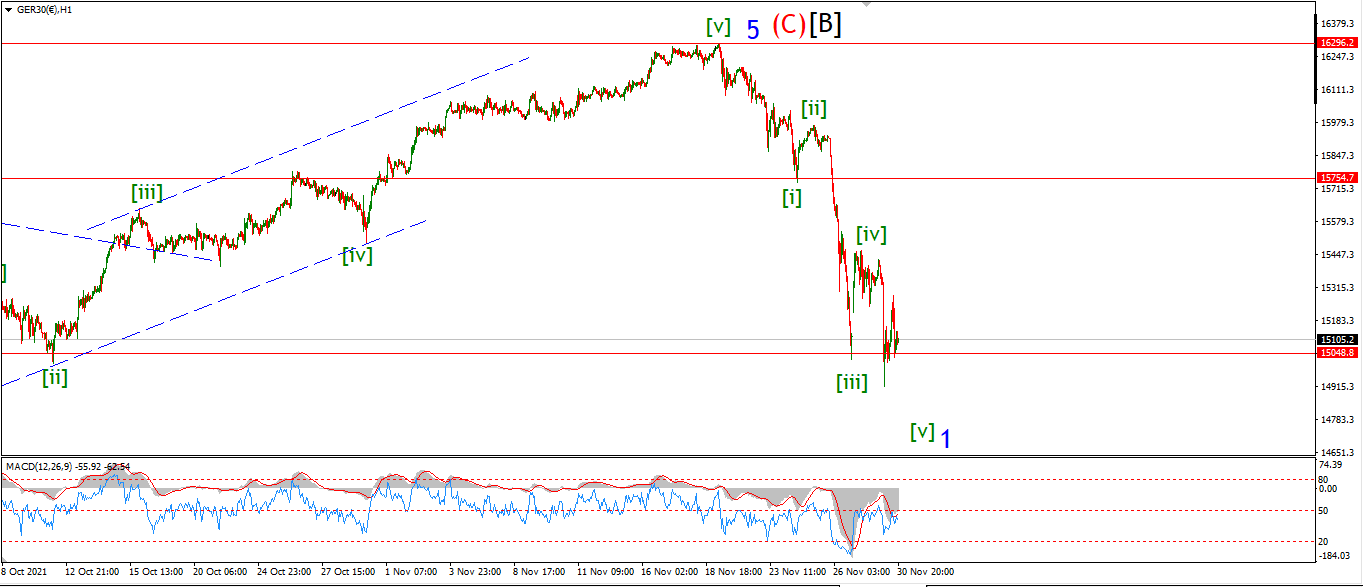
DAX 1hr
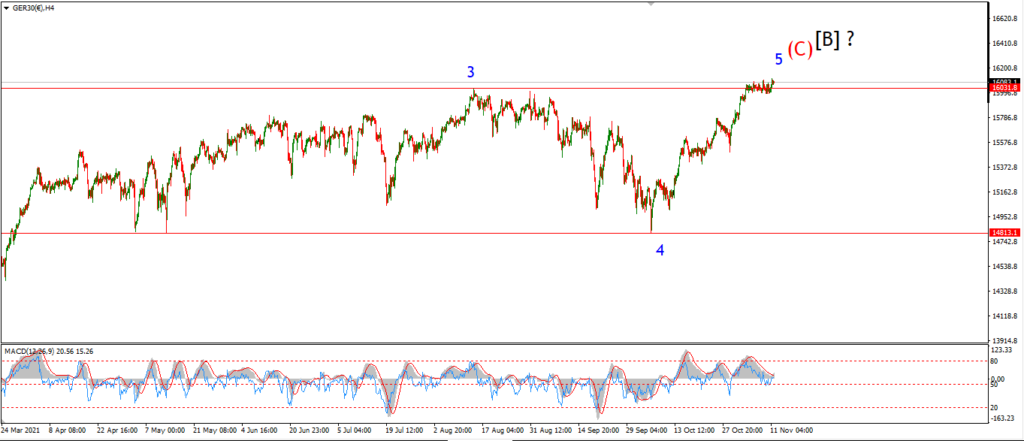
DAX 4hr
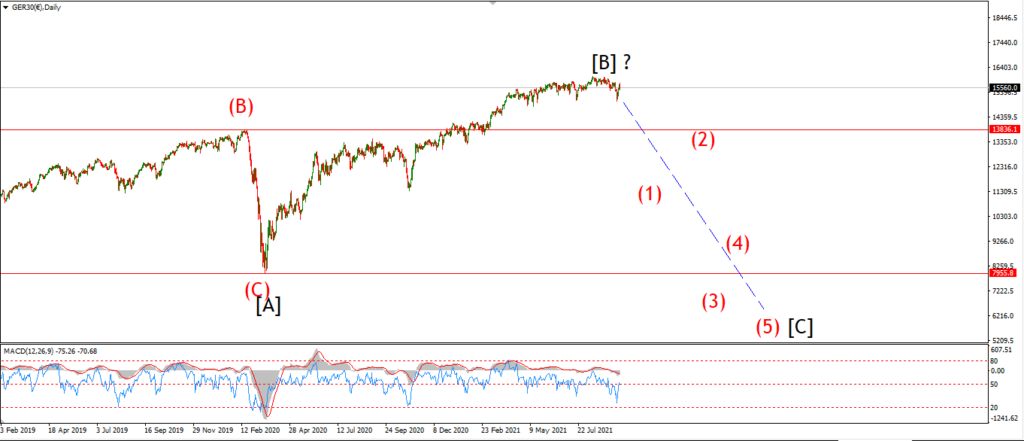
DAX daily.
Topping out in wave [B].
NASDAQ 100.
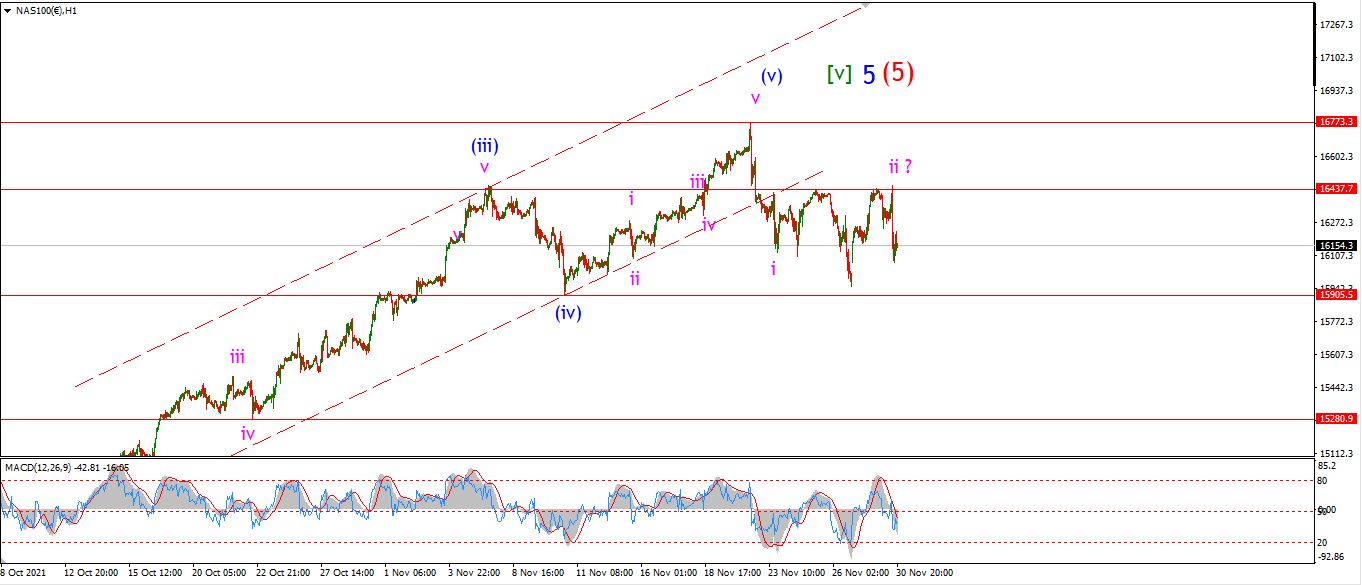
NASDAQ 1hr
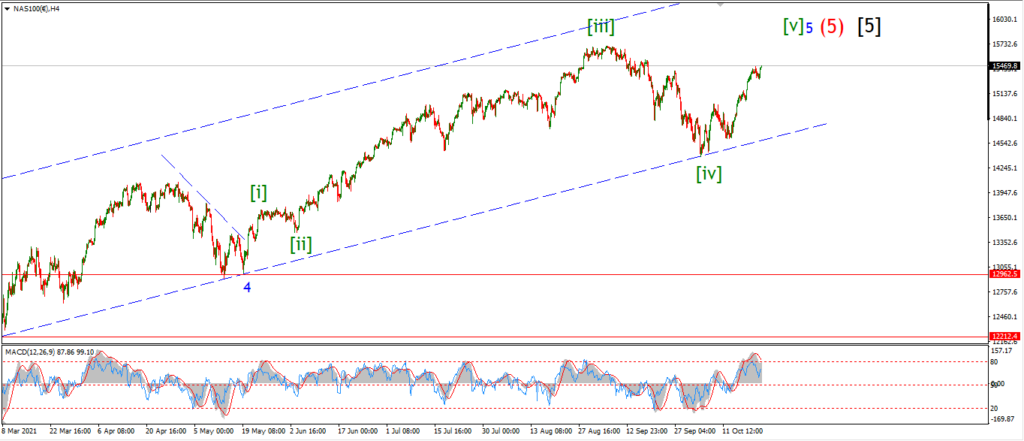
NASDAQ 4hr.
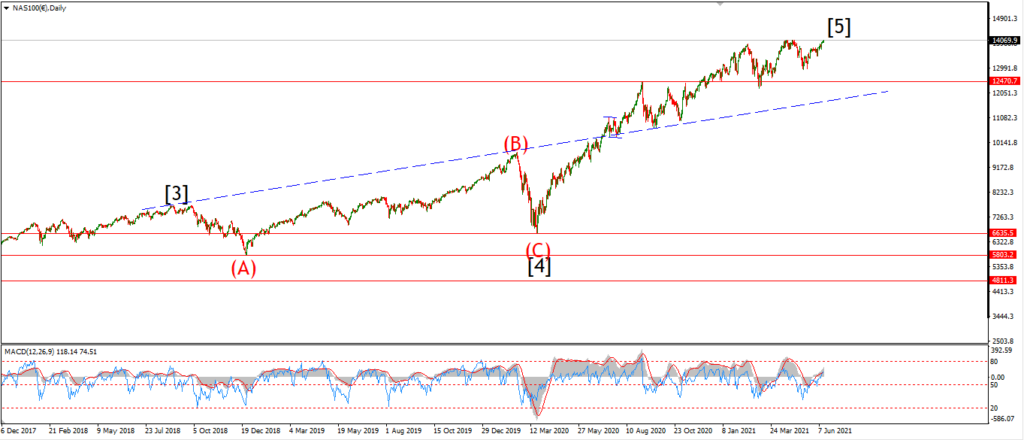
NASDAQ daily.
Is this it for the Nasdaq??