
Good evening to one and all,
I pray the Blessings of Messiah Yeshua to you all again tonight.
On with the show.
EURUSD.
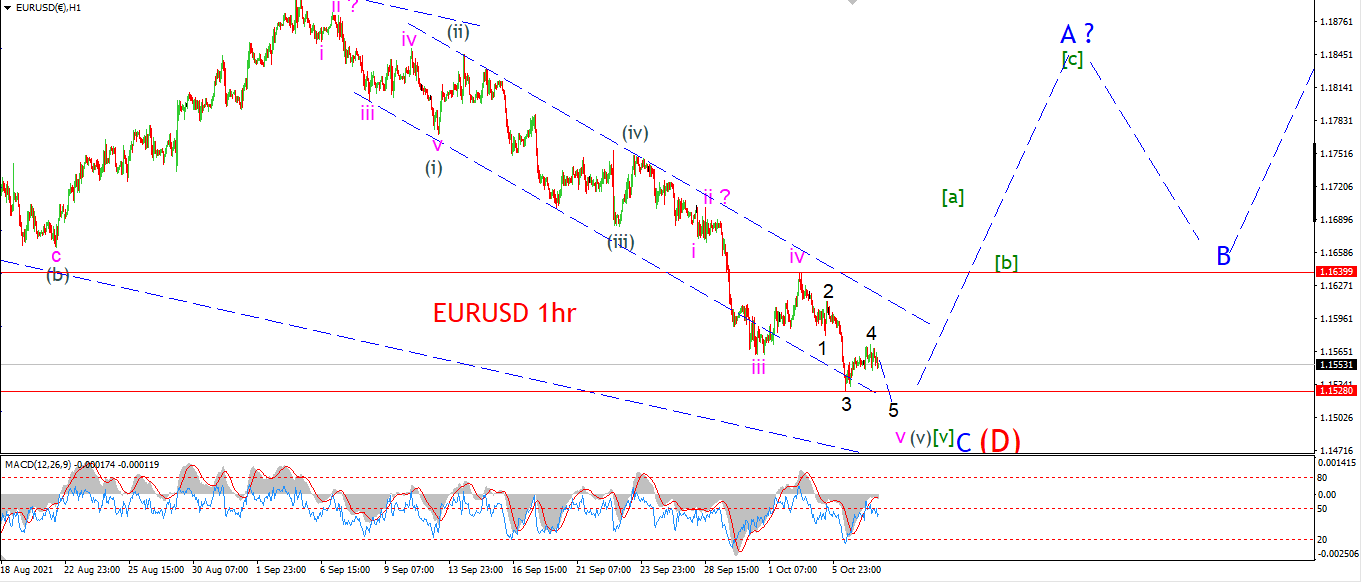
EURUSD 1hr.
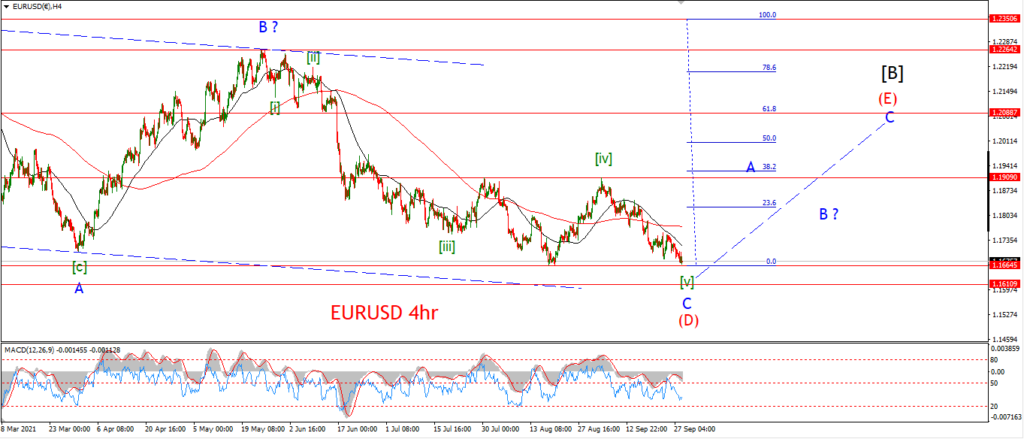
EURUSD 4hr.
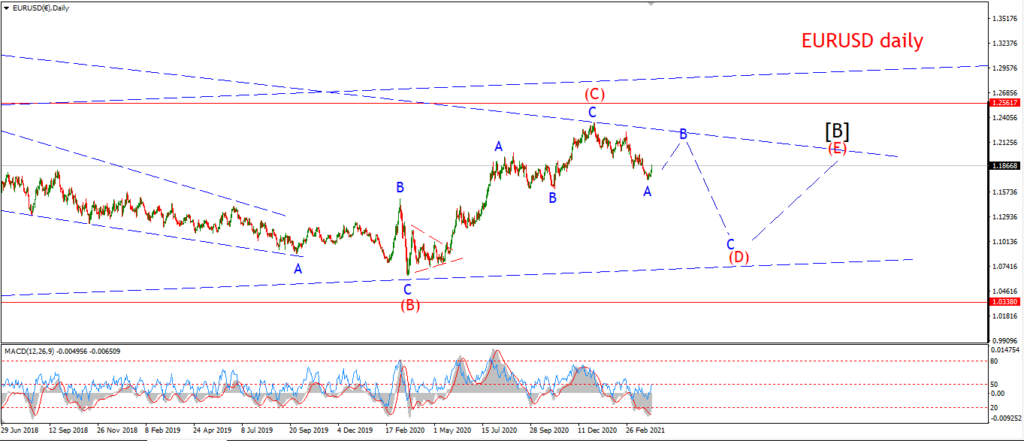
EURUSD daily.
Todays action was dead as a door nail.
I suspect we are still moving within wave ‘v’ down because of this.
I have labelled this internal pattern in wave ‘v’ this evening
and I suspect todays action marks wave ‘4’ of ‘v’.
we need one more drop below 1.1528 again to complete wave ‘v’.
This should happen tomorrow and then I will look for a pop to the upside again to begin a rally in wave ‘A’.
Tomorrow;
It would be nice to finish the week with a completed pattern in wave (D).
So lets see if wave ‘v’ of (v) will close out and then reverse to begin wave [a] of ‘A’.
GBPUSD
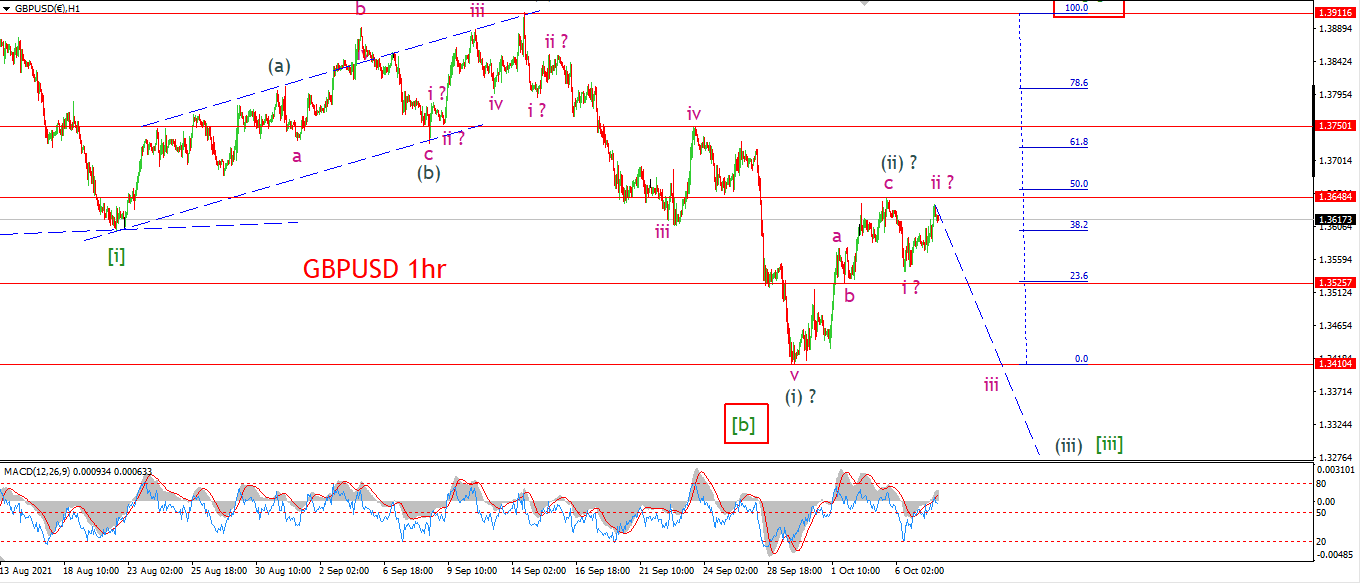
GBPUSD 1hr.
GBPUSD 4hr.
GBPUSD daily.
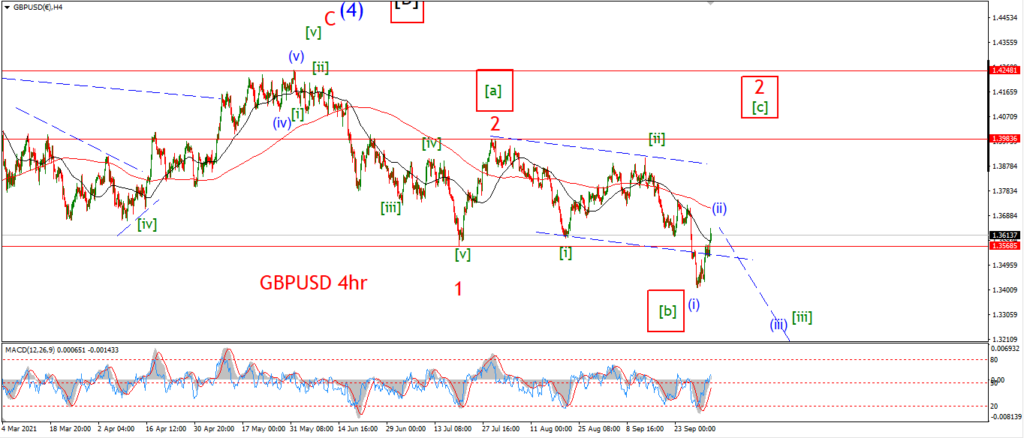
Take another look at the alternate count on the 4hr chart.
I can not rule this count out at all yet.
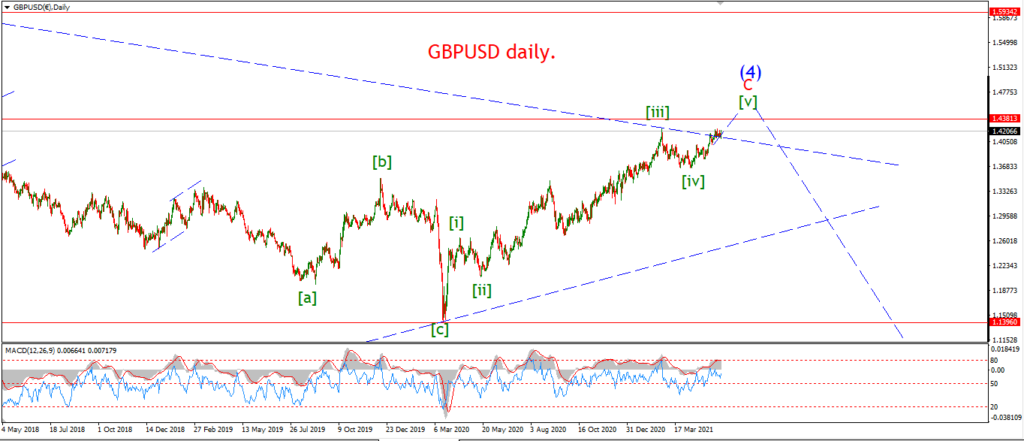
and given that the count in EURUSD is suggesting a large rally into wave (E) over the coming weeks,
then I would be a fool to rule out this alternate count which allows for a rally into wave [C] of ‘2’.
Todays action has not given us much to go on with either count.
the only way that I can rule out the alternate count is if we see a large acceleration lower into wave (iii) of [iii] over the coming week.
there is a slight lower high in place today,
if this is wave ‘ii’ of (iii),
then we need a large decline to begin now and continue well into next week in wave ‘iii’ of (iii) of [iii].
Lets see if tomorrows trade brings a selloff.
Tomorrow;
Watch for wave ‘iii’ of (iii) to turn lower and fall below 1.3400 again to signal that wave (iii) has begun.
USDJPY.
USDJPY 1hr.
USDJPY 4hr.
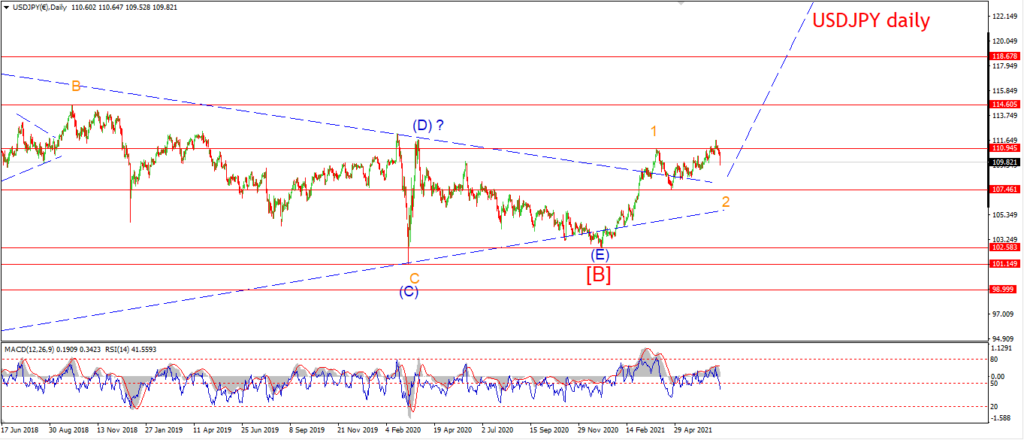
USDJPY daily.
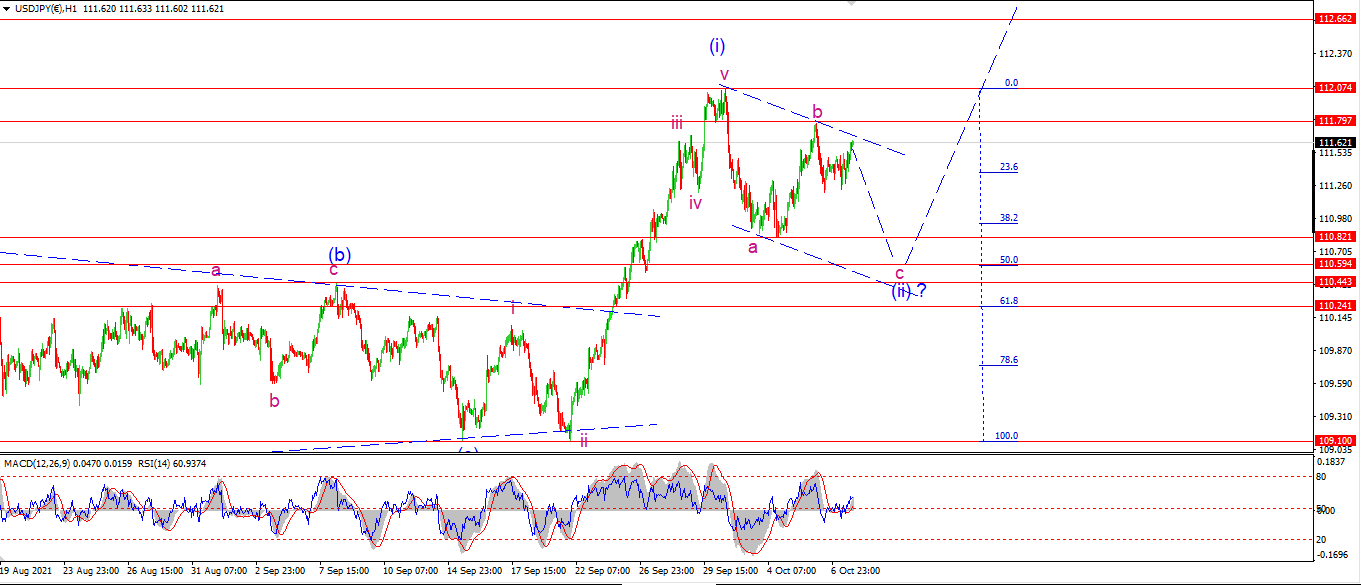
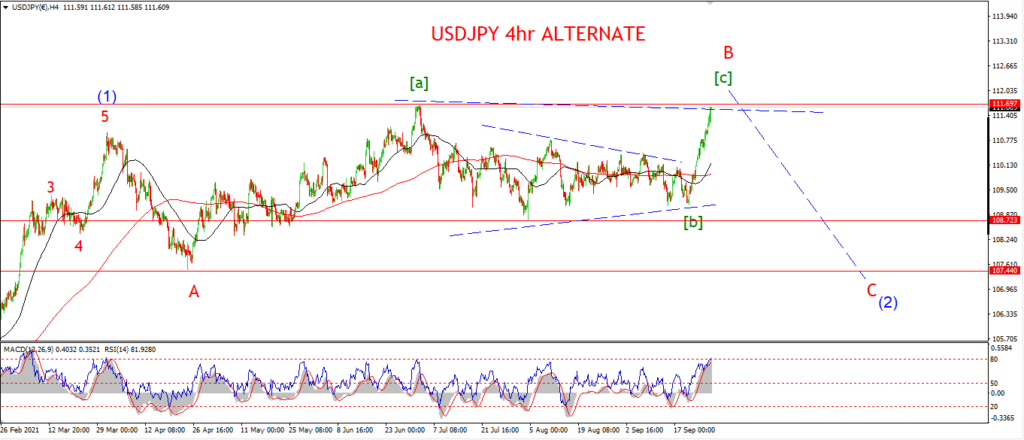
Wave ‘c’ should trace out five waves down over towards that minimum target at 110.82.
And with a small lower high now in place below wave ‘b’,
this does suggest wave ‘c’ has begun.
Tomorrow;
WAtch for wave ‘c’ to continue lower.
the high at wave ‘b’ should hold at 111.79.
DOW JONES.
DOW 1hr.
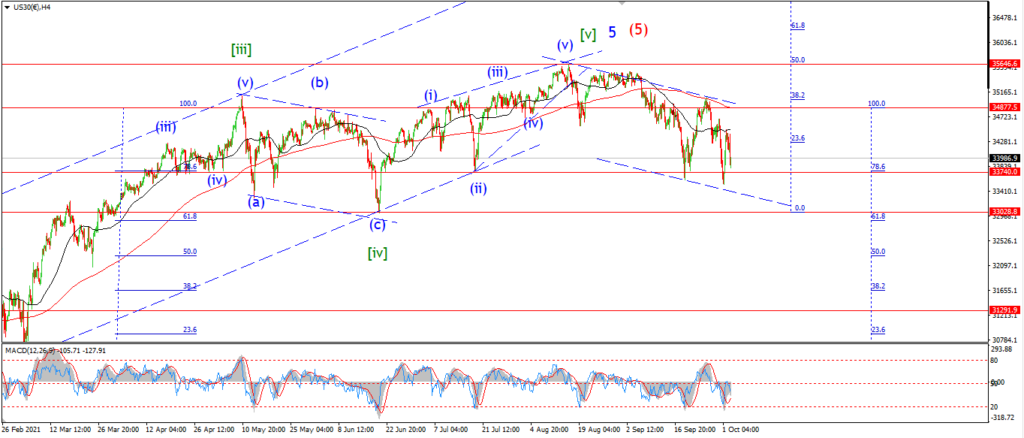
DOW 4hr
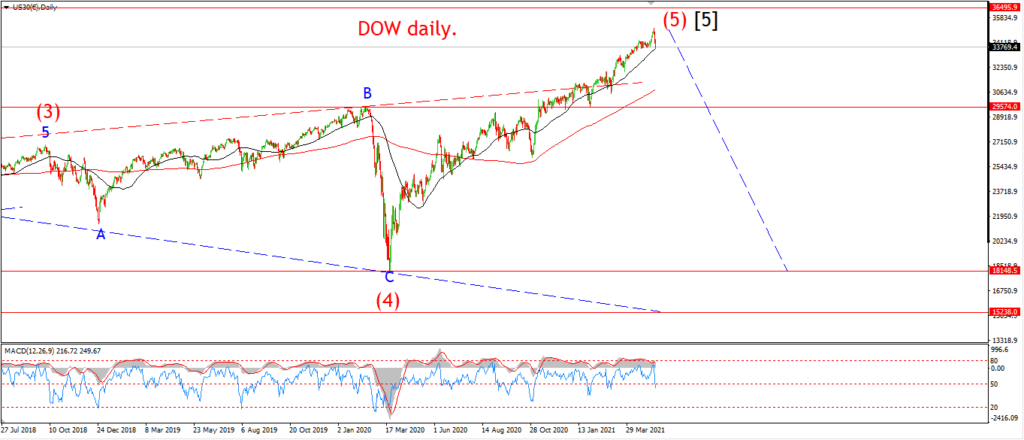
DOW daily.
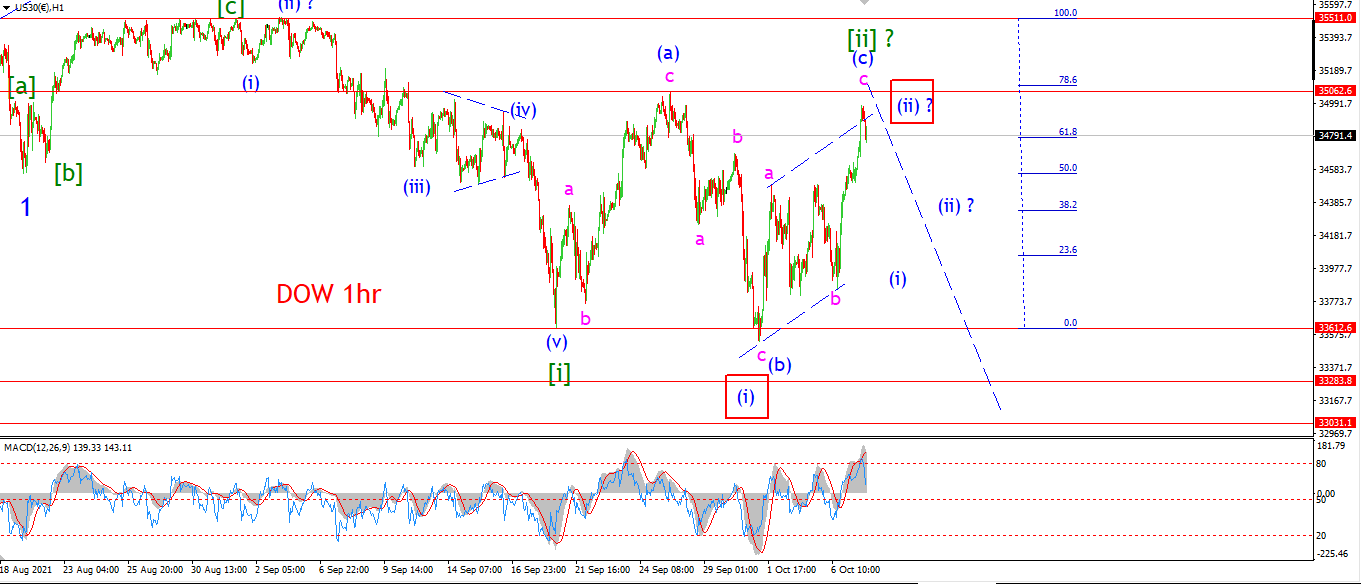
Todays rally went on higher than suggested for sure,
and I have changed up the wave count because of that rally,
but the bearish wave count has not been invalidated at all because of said rally!
I have demoted last nights count to the alternate now,
but that count was not invalidated.
I have just allowed for a larger wave [ii] green in its stead.
wave [ii] can be viewed as a complex flat with a triple three internal wave count.
If wave [ii] is complete at todays high,
then we are in for some fireworks over the coming days as wave [iii] of ‘3’ gets going.
Tomorrow;
Watch for wave (c) of [ii] to top out and then reverse into a five wave decline starting tomorrow.
Wave (i) of [iii] will break 34000 again ideally.
GOLD
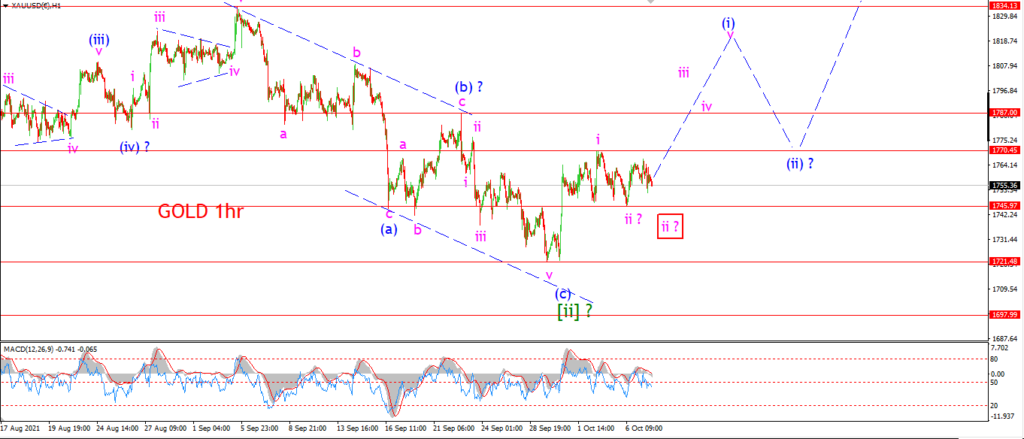
GOLD 1hr.
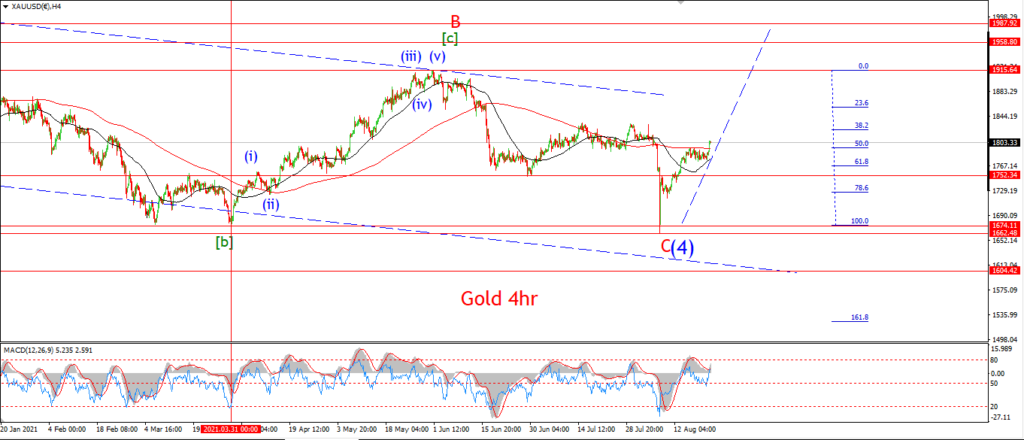
GOLD 4hr.
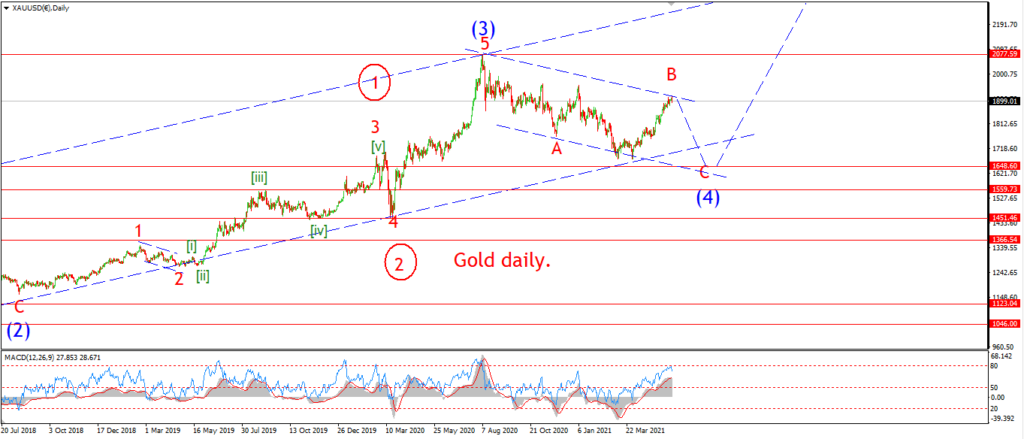
GOLD daily.
Ok,
The price is holding above the wave ‘ii’ low at 1746 today and the action is looking corrective at the moment.
Is this a small higher low to begin wave ‘iii’ up?
That is the question running through my head at least!
Wave ‘ii’ may also be tracing out a more complex pattern as shown in the alternate.
So if we break 1746 again it is not the end of the world!
I do want to see the low at wave [ii] hold at 1721.50.
A break of that low will invalidate the hourly count.
Tomorrow;
Watch for wave ‘ii’ to hold at 1746.
A break above 1770 again will signal wave ‘iii’ of (i) has begun.
CRUDE OIL.
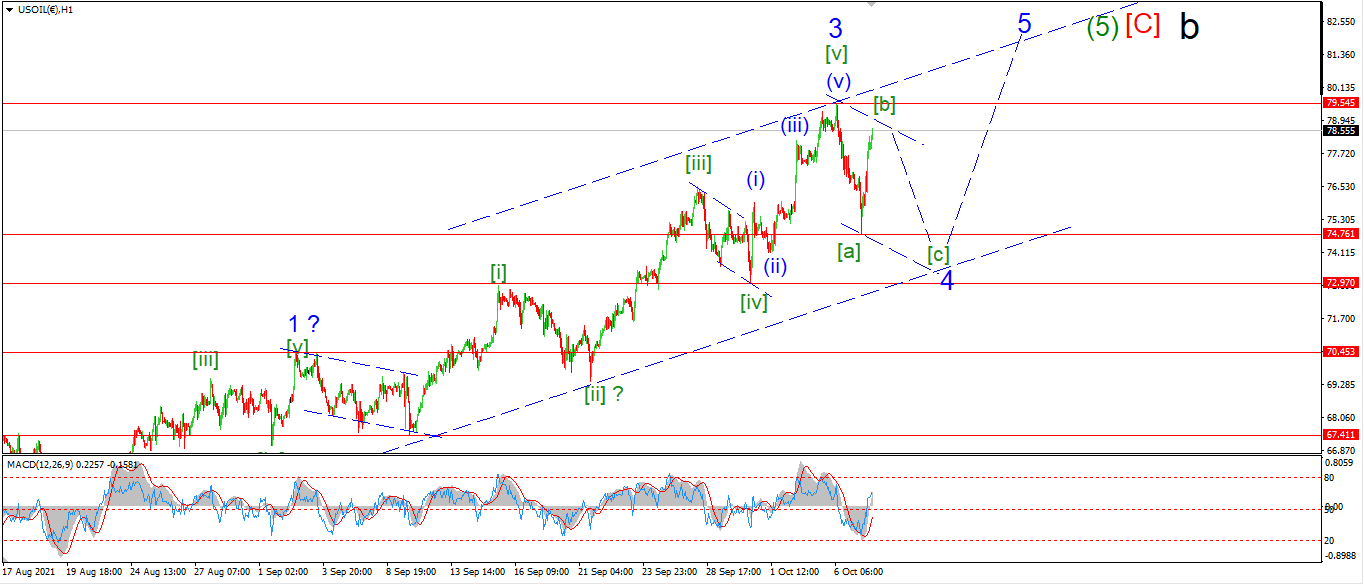
CRUDE OIL 1hr.
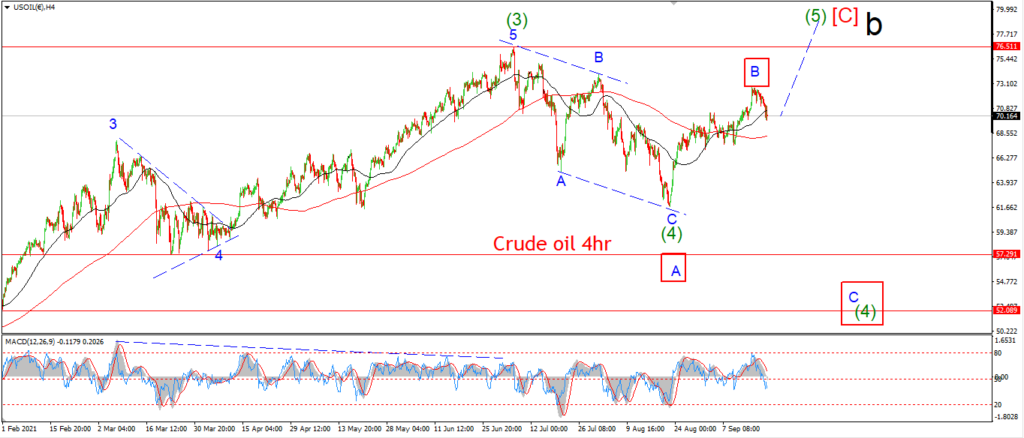
CRUDE OIL 4hr.
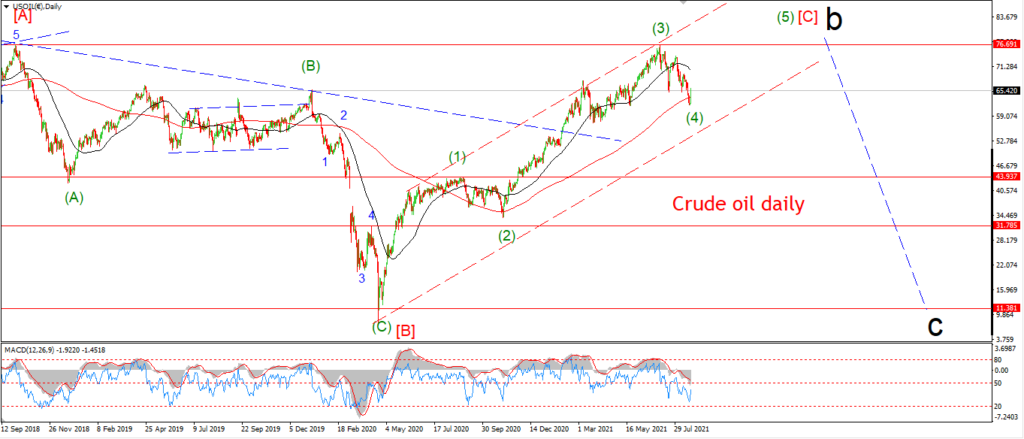
CRUDE OIL daily.
I have switched to the alternate count for wave ‘3’ and ‘4’ tonight.
the drop off this weeks high invalidated the previous count.
so now we have a five wave pattern complete in wave ‘3’ blue.
and the current action is viewed as a correction in wave ‘4’.
Wave ‘4’ should trace out a three wave pattern lower as shown.
And wave ‘4’ must hold above 70.45 at the wave ‘1’ high.
Tomorrow;
Watch for wave [b] of ‘4’ to complet below 79.50.
Wave [c] will probably wait until next week to begin.
S&P 500.
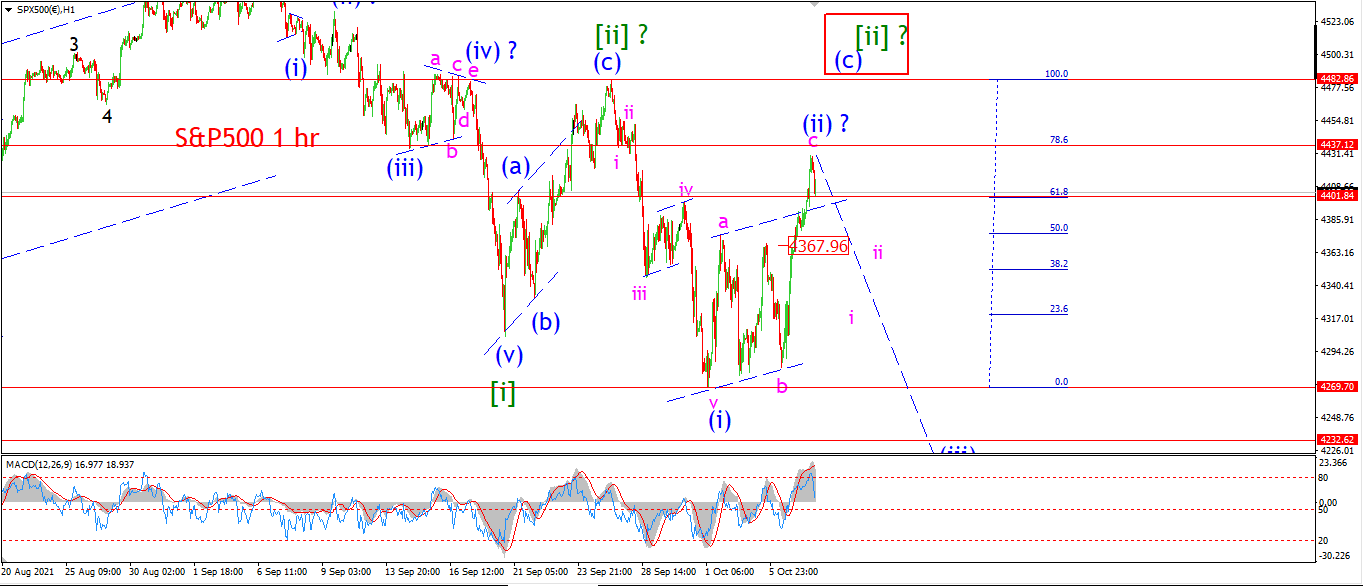
S&P 500 1hr
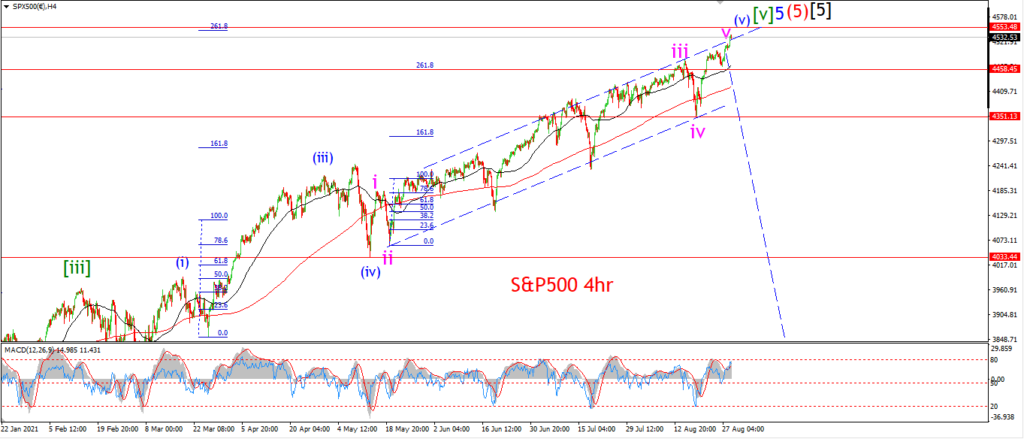
S&P 500 4hr
S&P 500 daily.
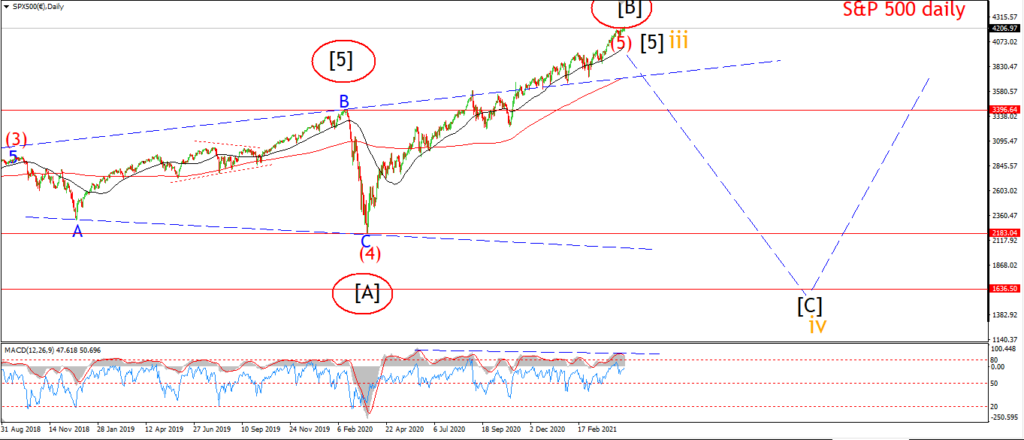
The S&P topped out a rally in wave ‘c’ of (ii) today and this evening the price has reversed lower again.
The rally failed just below the 78.6% retracement level of wave (i) this evening.
I cant say that wave (iii) has yet begun,
but if we see a follow through to the downside tomorrow,
that will signal wave ‘i’ of (iii) has begun.
I will be very interested if we see an impulsive looking decline below 4270 again at the wave (i) low.
That will give us the type of follow through that I am looking for,
it will create a failure below the 50MA on the daily chart,
and a failure below the 200 MA on the 4hr chart.
Both of those lines are closely related anyway,
but they have served as a floor for the rally over the last year.
They have basically acted as support to the rally since may 2020.
It will be a worth watching to see if that line becomes resistance………
Tomorrow;
Watch for an impulsive decline to begin off the high at wave (ii).
The price may be creating a smaller head and shoulders pattern around todays high.
So I want to see wave ‘i’ fall below 4360 again.
This level formed the top of the left shoulder this week.
SILVER.
SILVER 1hr
SILVER 4hr.
SILVER daily.
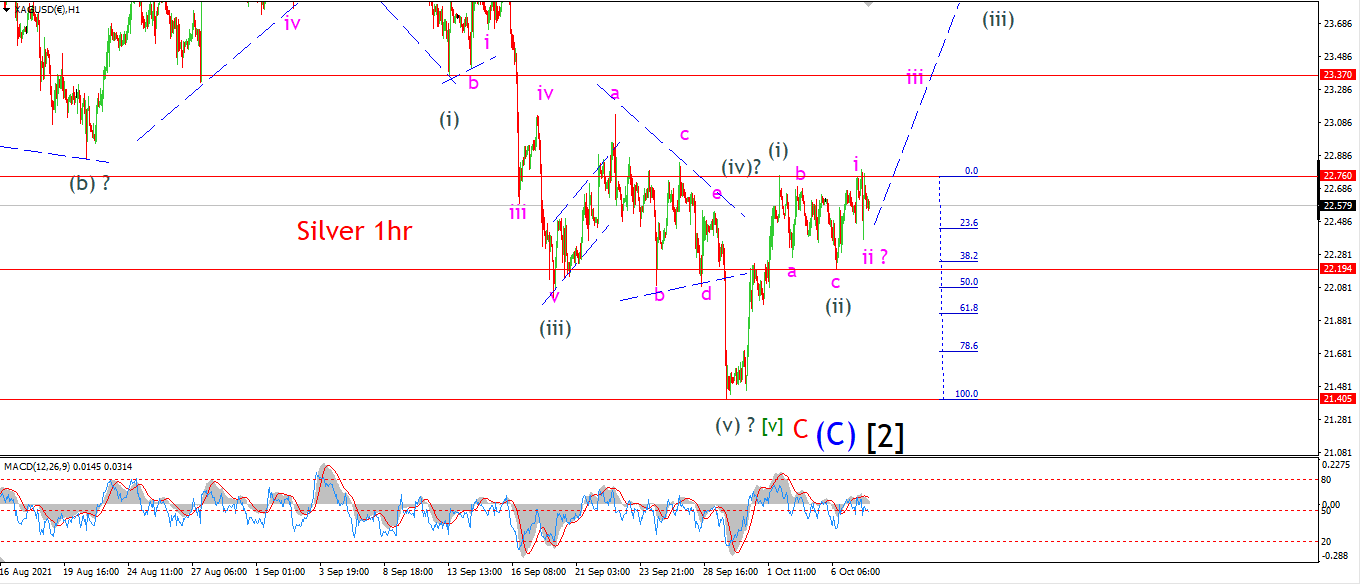
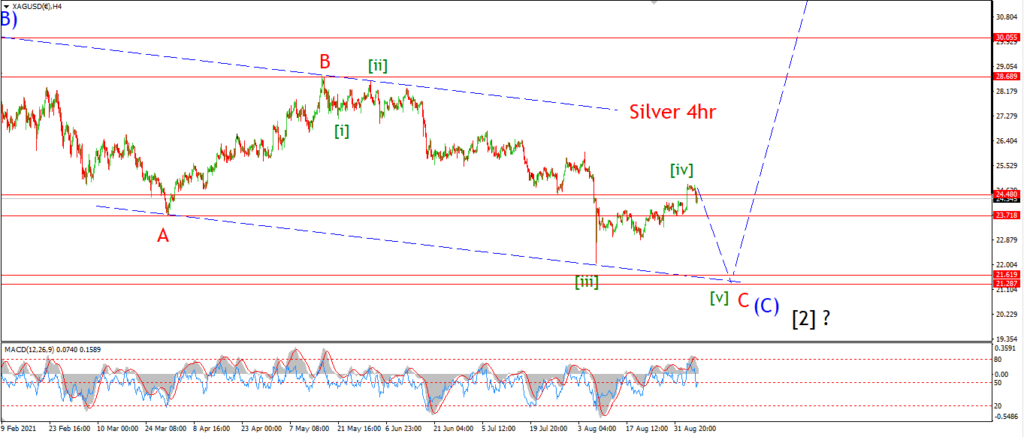
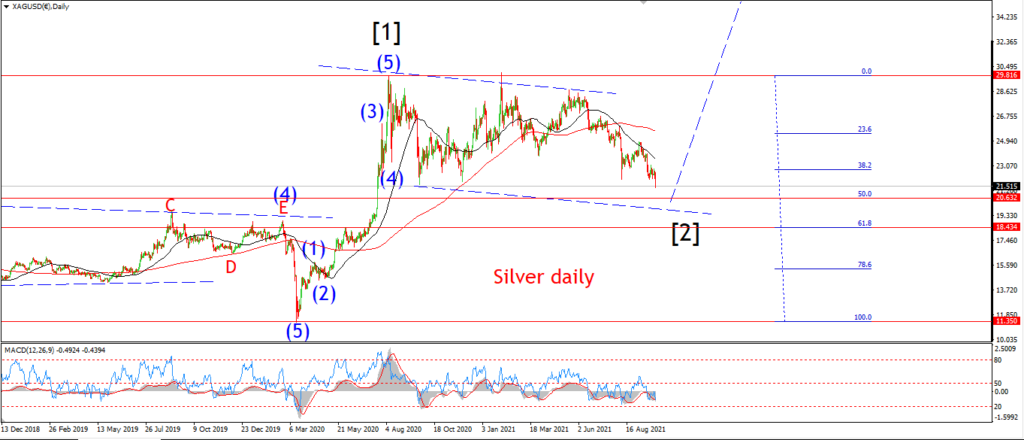
The action today was choppy but so far the low at wave (ii) has held in place.
At least I can say that the action this week is pretty corrective off the wave (i) high.
and this re-enforces the idea that we are building an impulsive base here.
And if that is correct,
then wave (ii) is now complete and the next thing to look for is a rally into wave (iii) of [i].
Tomorrow;
The low at wave (ii) must hold at 22.20.
Watch for wave ‘iii’ to push back above 22.76 again and continue rising over the next week.
BITCOIN
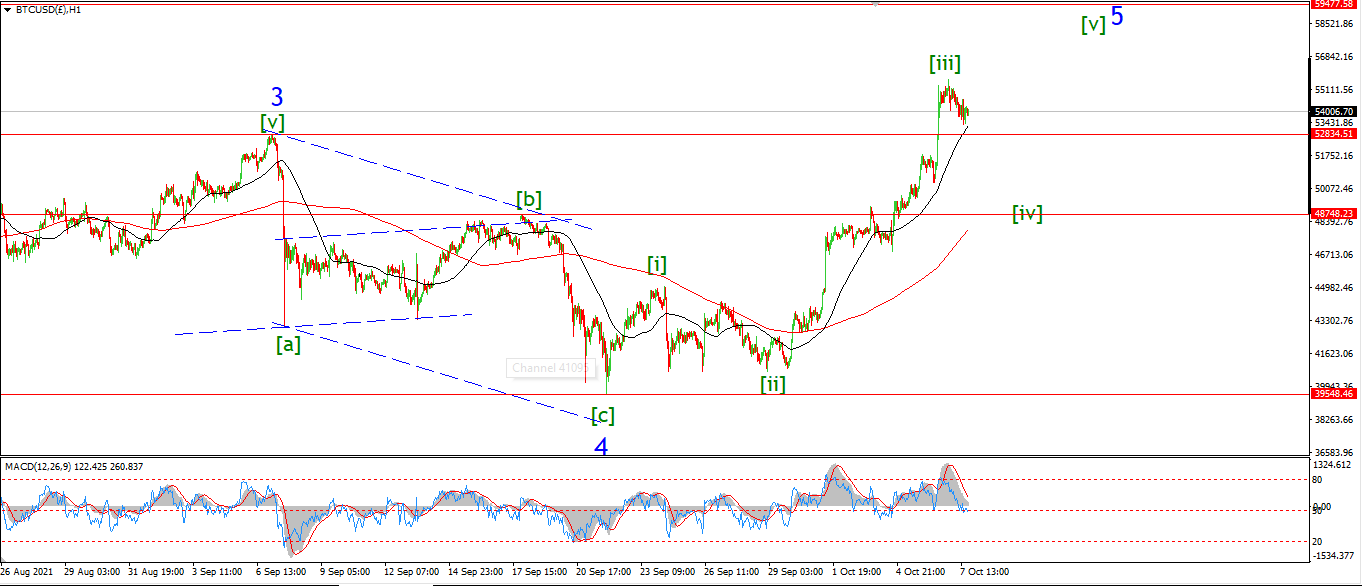
BITCOIN 1hr.
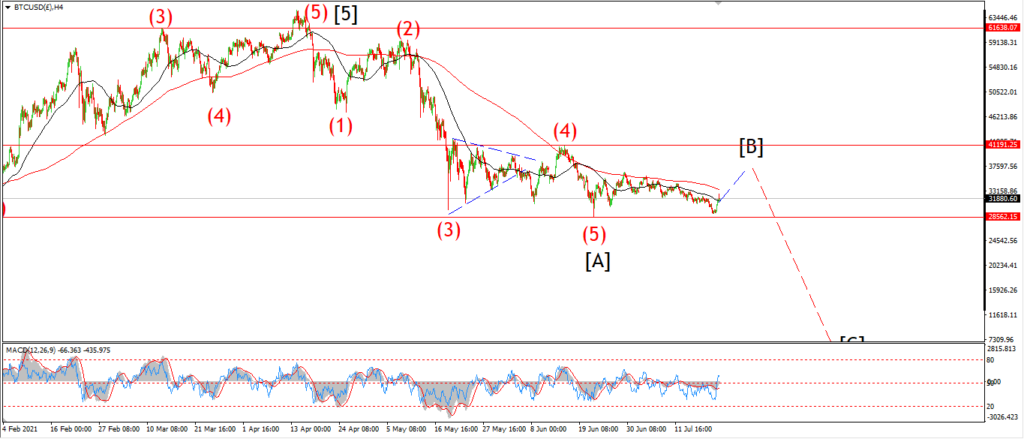
BITCOIN 4hr.
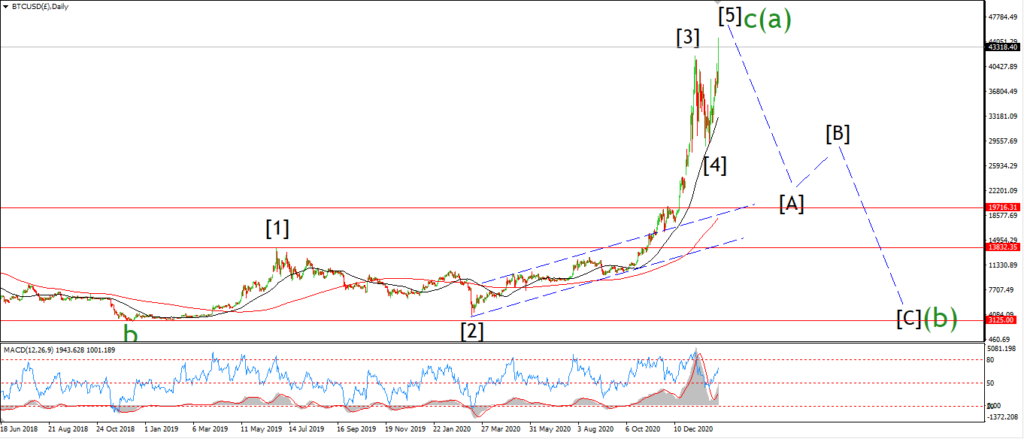
BITCOIN daily.
Topping in wave [B].
FTSE 100.
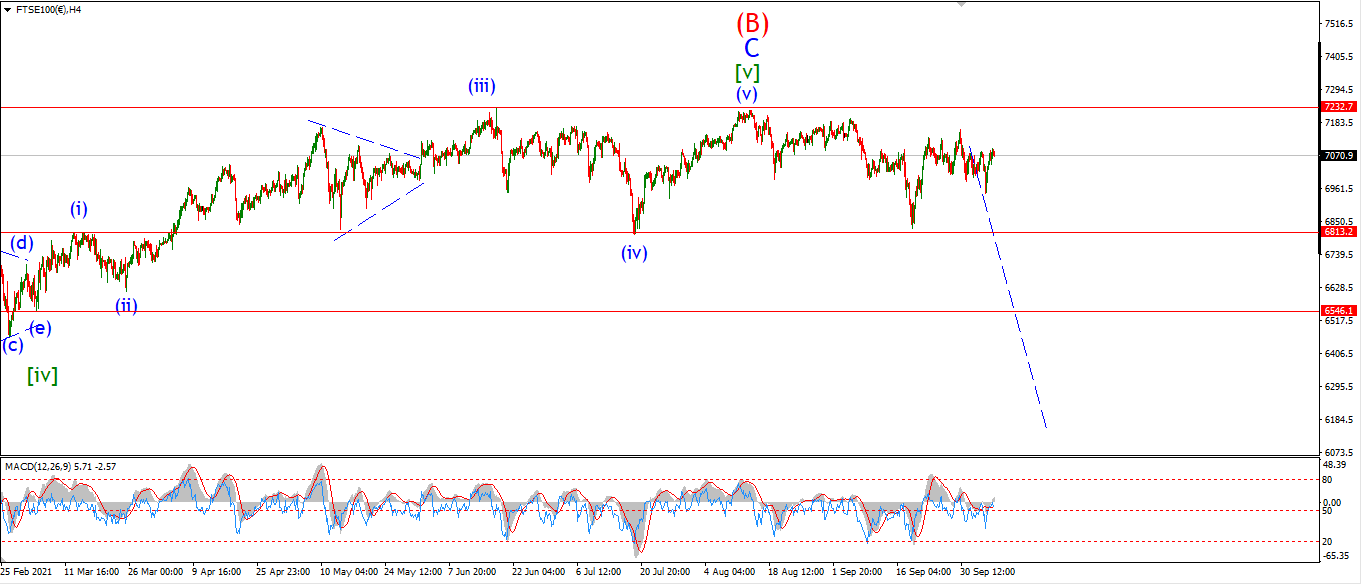
FTSE 100 1hr.
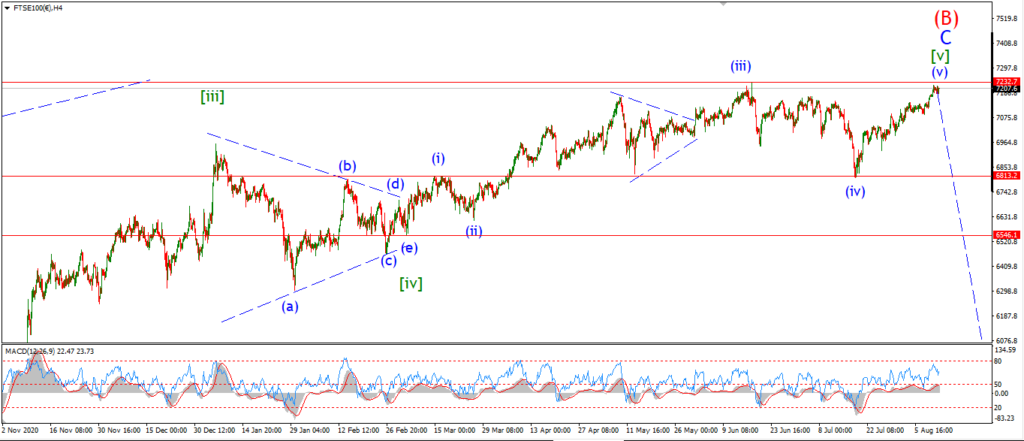
FTSE 100 4hr.

FTSE 100 daily.
Complete wave (B).
DAX.
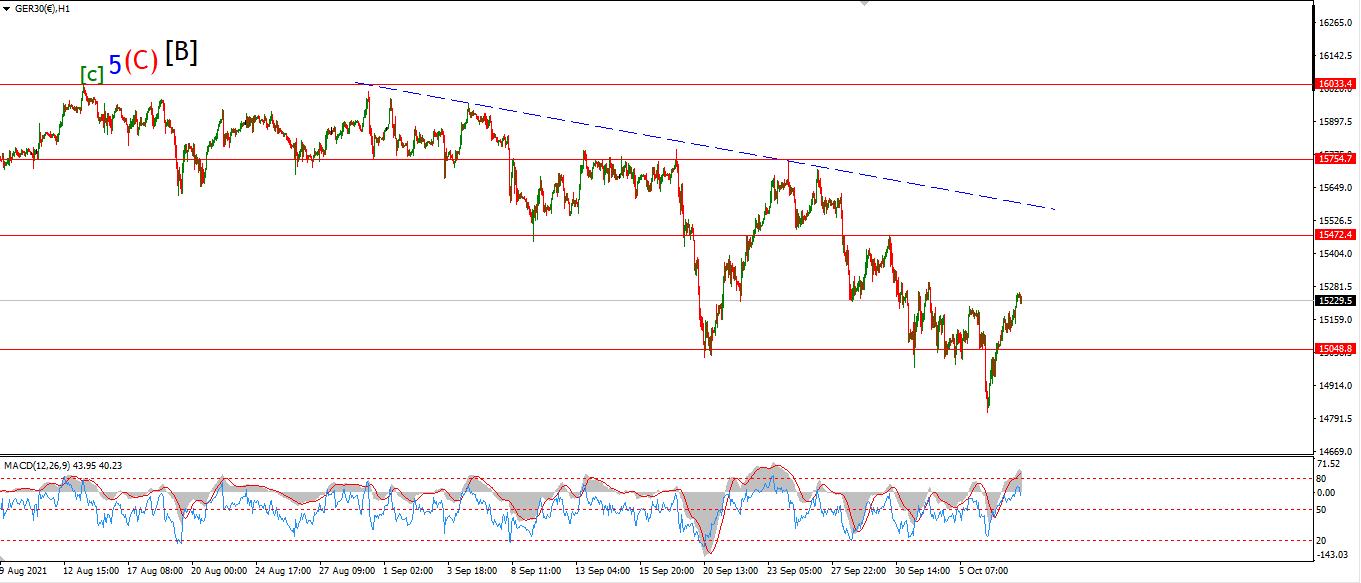
DAX 1hr
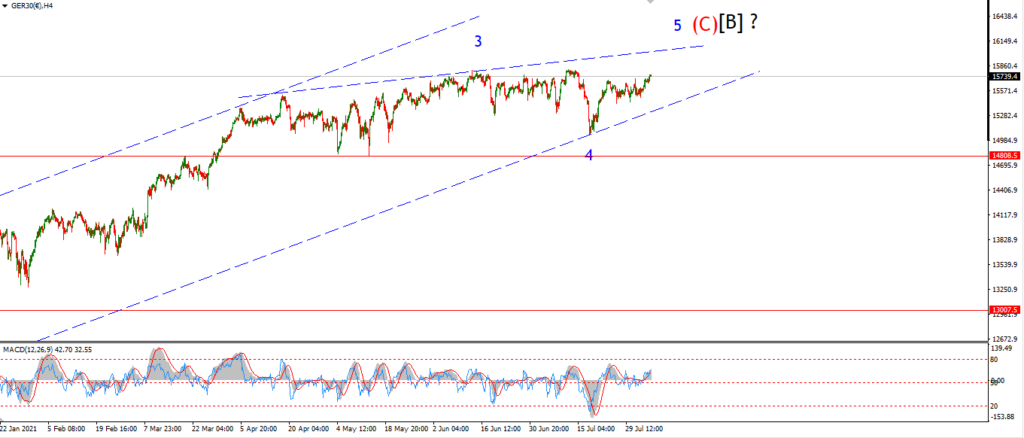
DAX 4hr
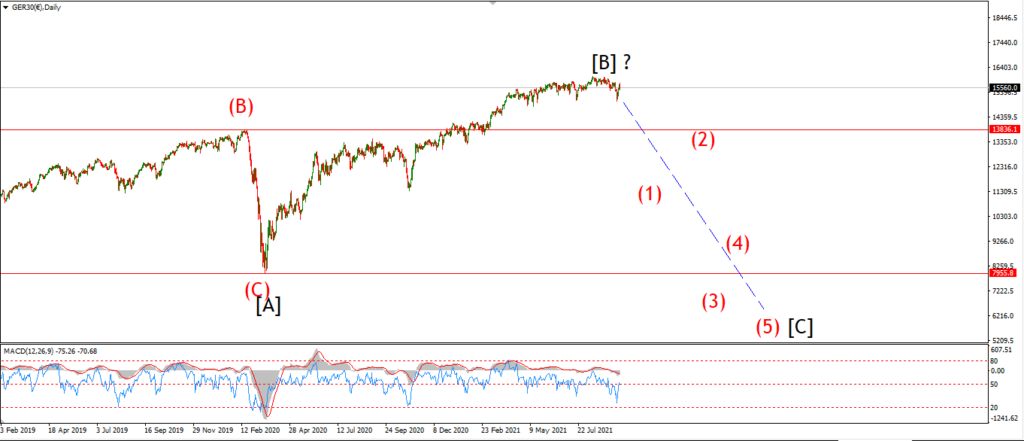
DAX daily.
Topping out in wave [B].
NASDAQ 100.
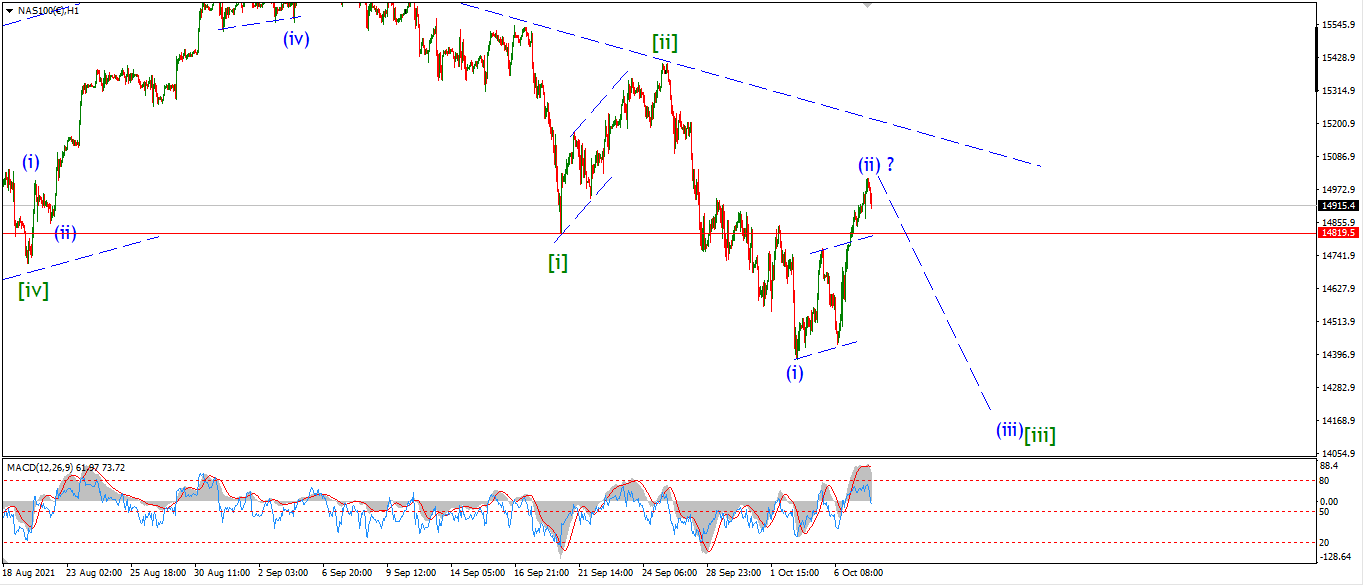
NASDAQ 1hr
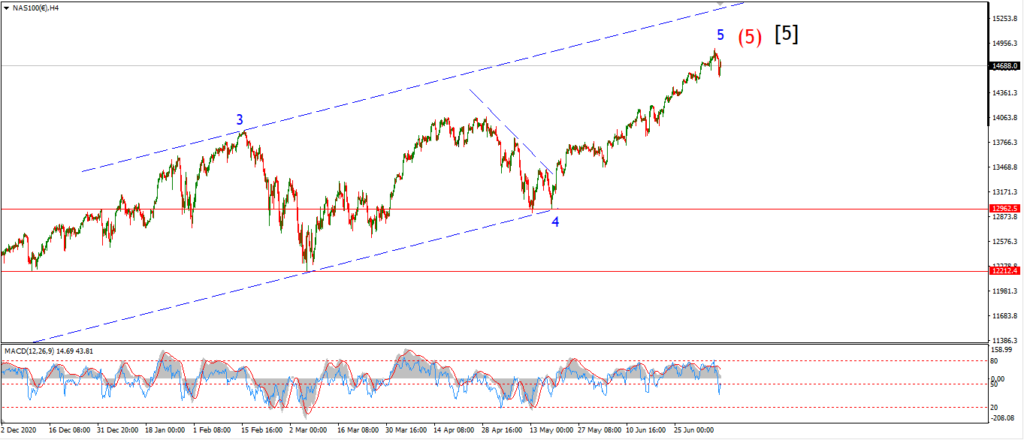
NASDAQ 4hr.
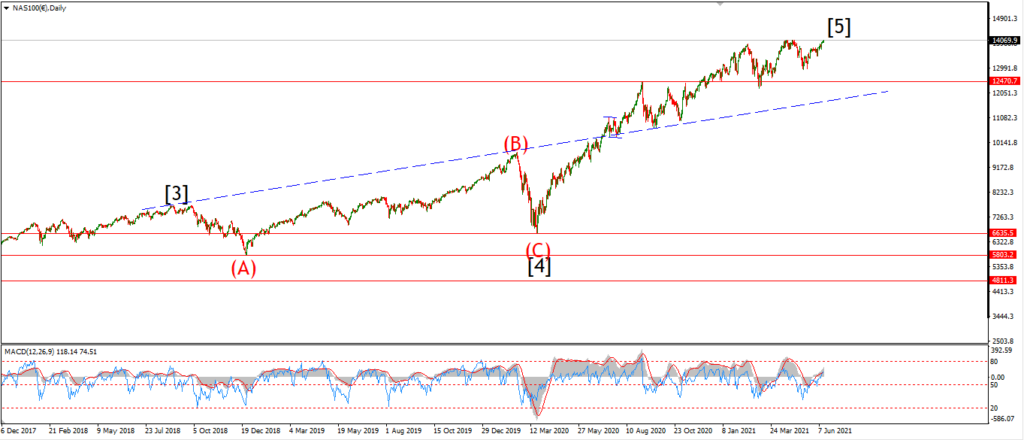
NASDAQ daily.
Is this it for the Nasdaq??