
Good evening folks, may the Lord Bless you all tonight.
EURUSD.
EURUSD 1hr.
EURUSD 4hr.
EURUSD daily.
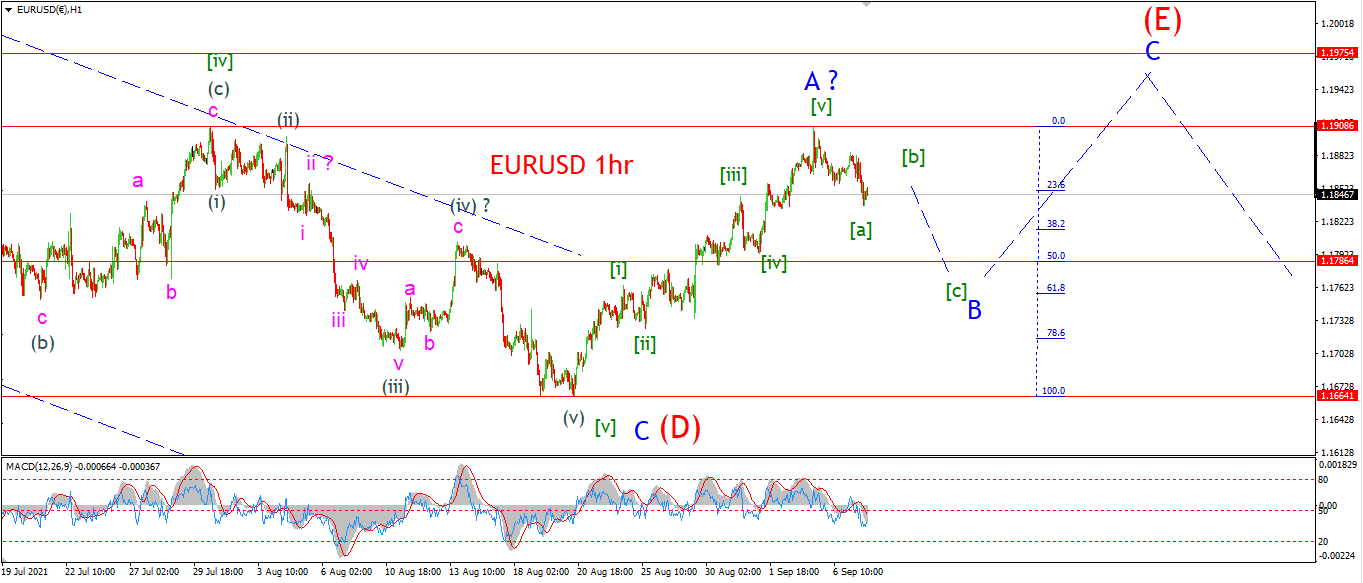
EURUSD has fallen off the top in a nice three wave pattern so far.
This action suggests that the correction in wave ‘b’ is now underway.
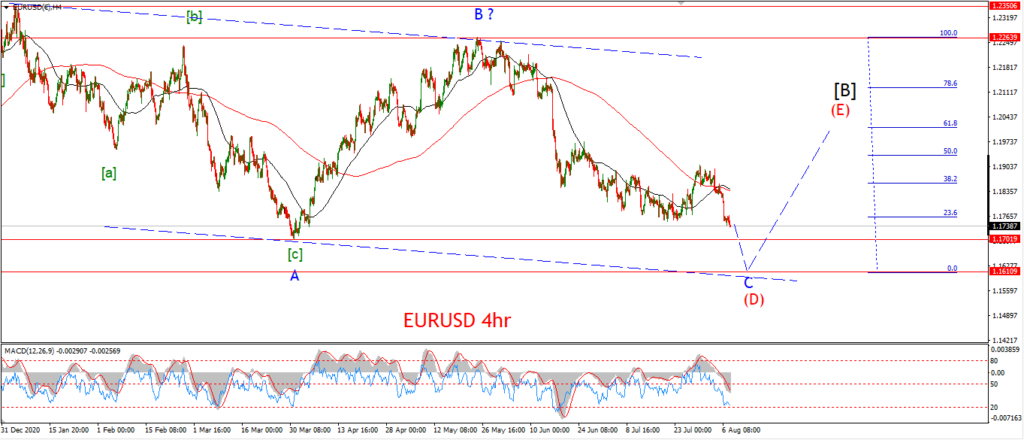
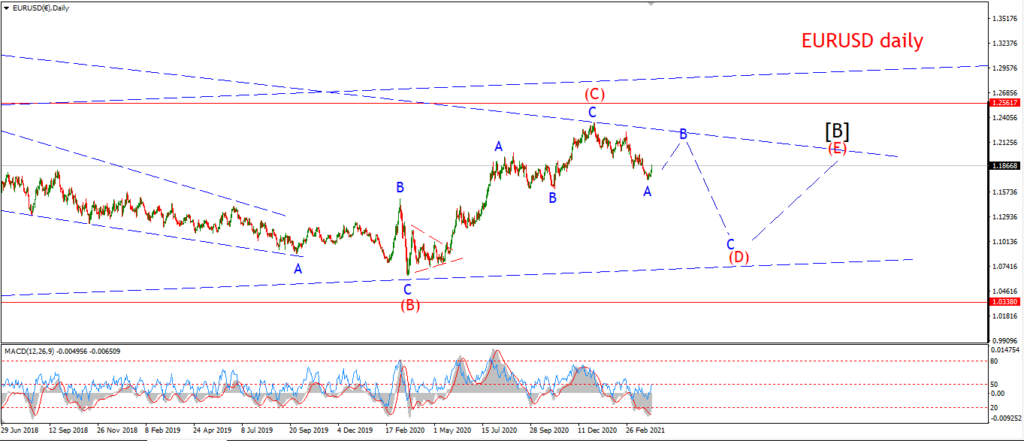
I view this decline as wave [a] of ‘B’,
and maybe we have a little left to go to complete wave [a].
If this pattern is correct;
Wave [b] is expected to rise again in three waves to form a lower high.
and then wave [c] should fall in five waves to complete wave ‘B’ later in the week.
Tomorrow;
Watch for wave [a] to complete and wave [b] to correct to a lower high below 1.1908.
The initial target for wave ‘B’ lies at 1.1786 at the 50% retracement level.
GBPUSD
GBPUSD 1hr.
GBPUSD 4hr.
GBPUSD daily.
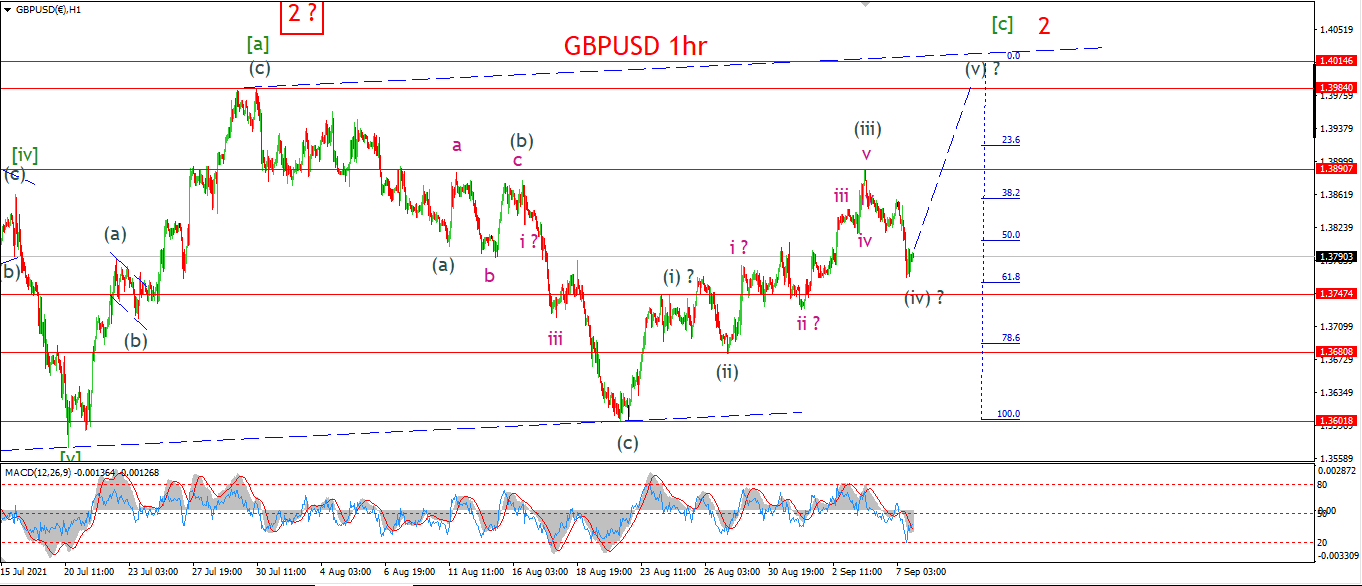
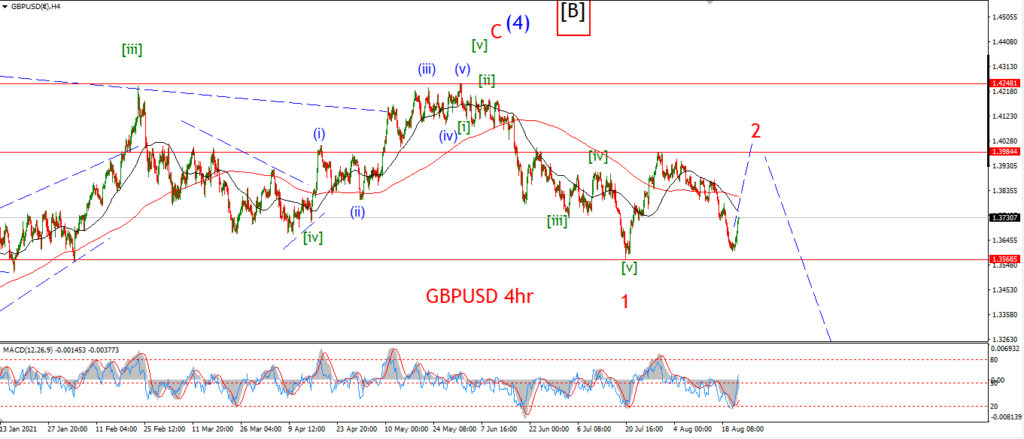
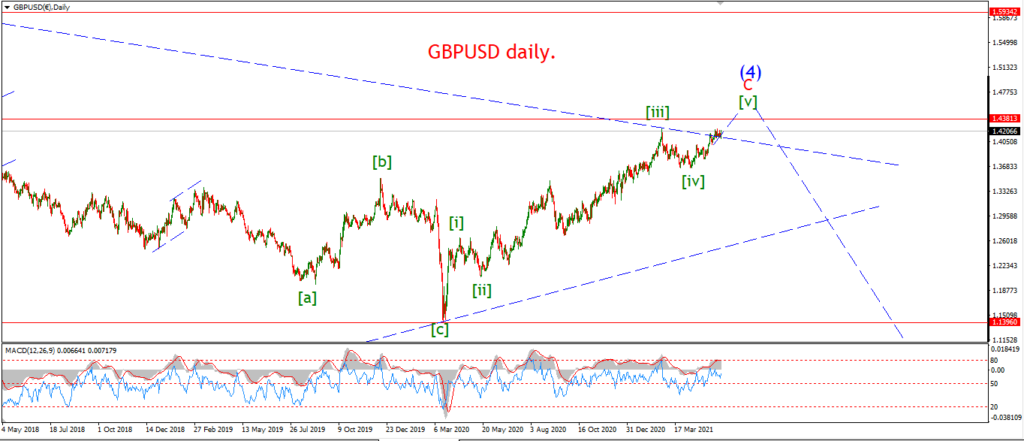
Todays corrective drop was almost too much for the main count to handle today.
The price bottomed at 1.3765 today,
and this low is now labelled wave (iv) of [c].
Wave (v) of [c] must now reverse higher and break 1.4014 for this count to remain valid.
If the price breaks 1.3747 again that will really raise questions about the overall flat correction count in wave ‘2’.
Tomorrow;
Watch for wave (iv) to hold above 1.3747.
Wave (v) up should continue higher as shown.
USDJPY.
USDJPY 1hr.
USDJPY 4hr.
USDJPY daily.
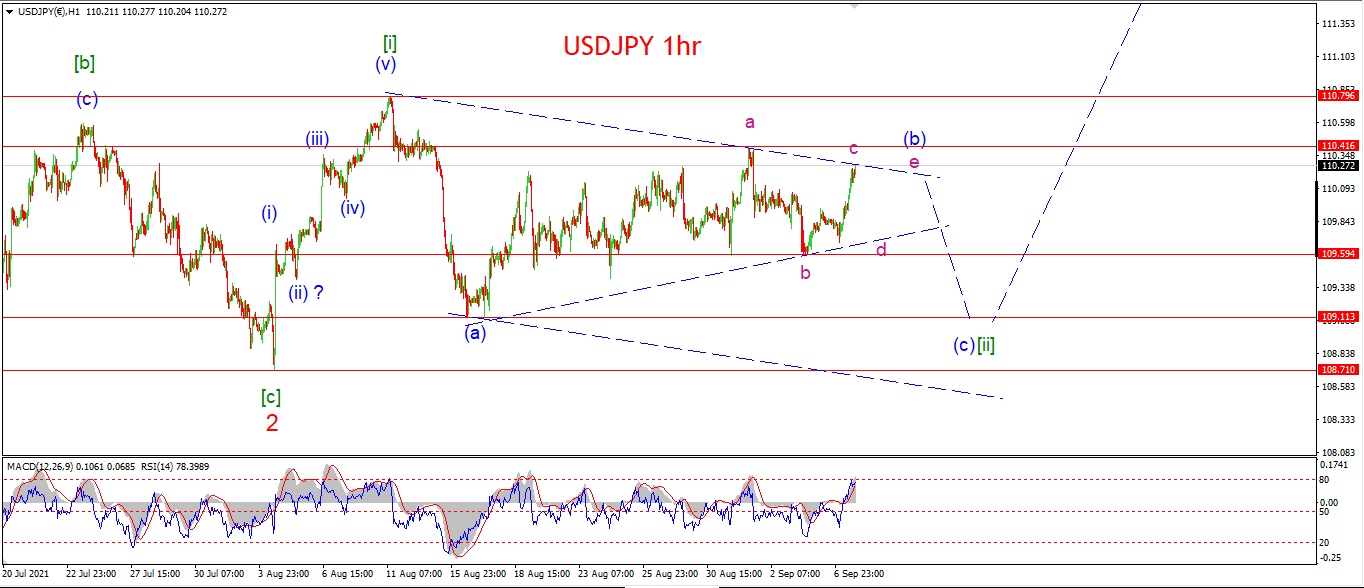
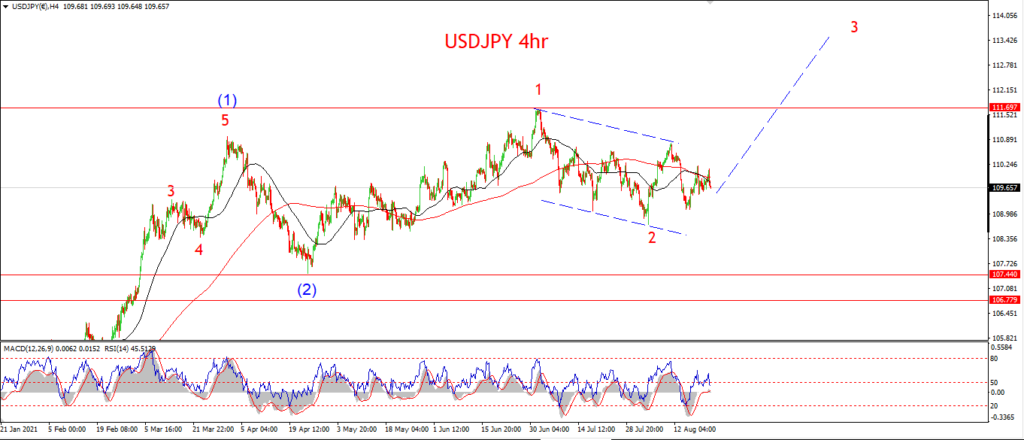
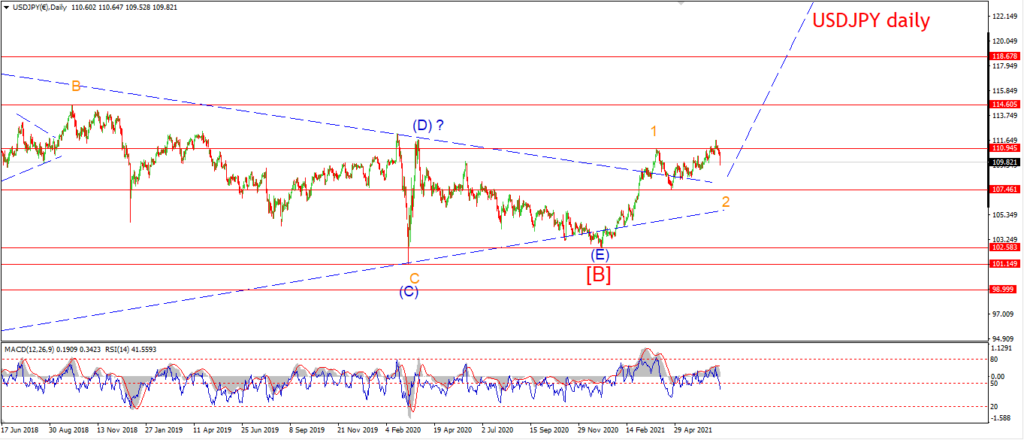
I am also looking at another interpretation of wave [ii] today.
This pattern now involves a triangle in wave (b).
And that should lead to another decline into wave (c) to complete above 108.71
and close out the overall correction in wave [ii].
Tomorrow;
110.41 must hold for wave this triangle to remain valid.
And wave ‘d’ must complete above 109.59.
DOW JONES.
DOW 1hr.
DOW 4hr
DOW daily.
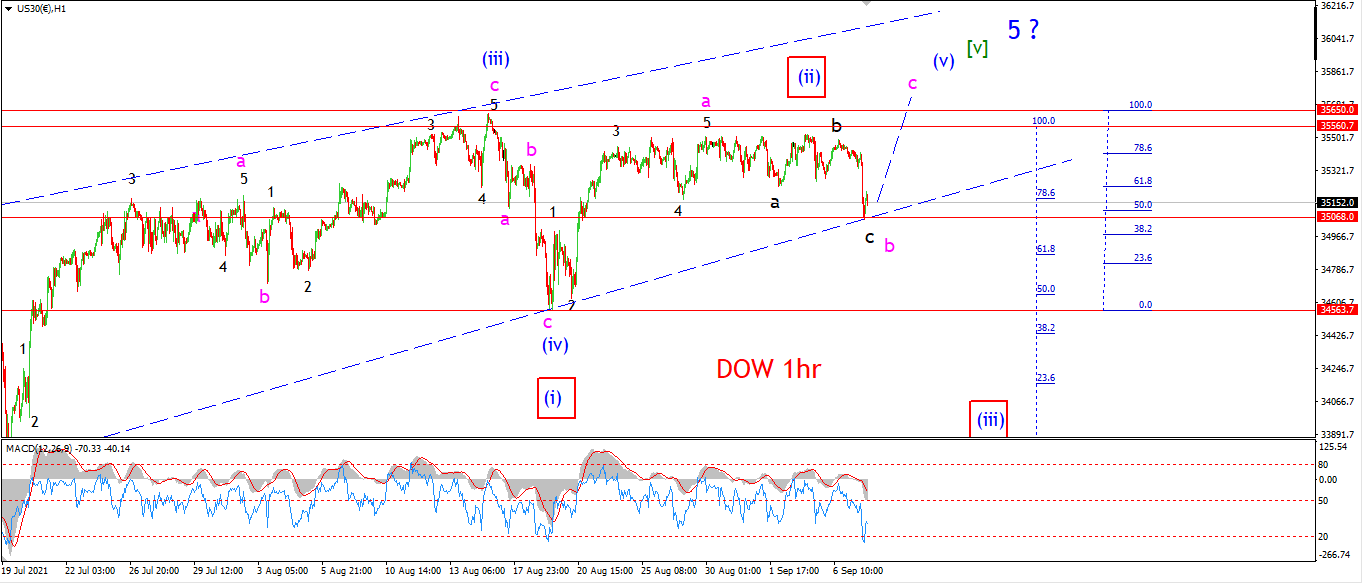
It looks like wave ‘b’ of (v) held on for one more day today.
The market dropped down into the rising trend line again to complete the correction.
I have labelled todays low as wave ‘c’ of ‘b’.
Todays low just broke the 50% retracement of wave ‘a’,
and this evening we have seen an impulsive pop off the low again.
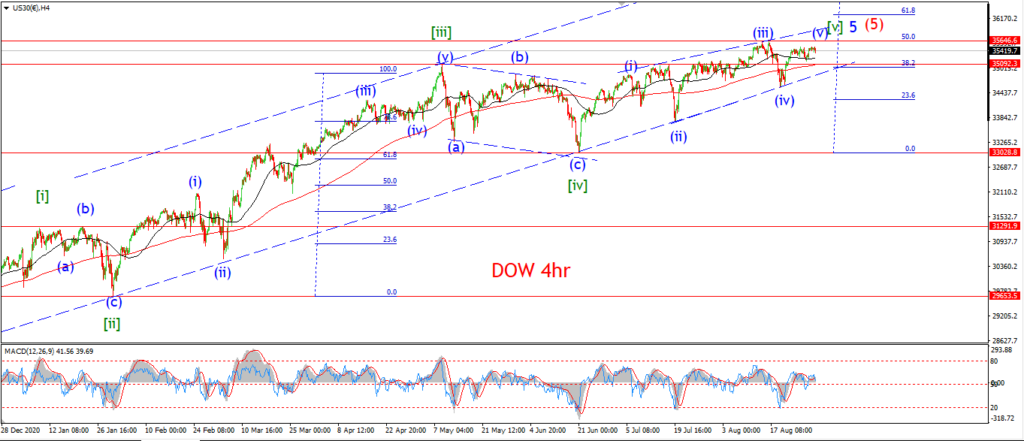
Wave ‘b’ should now be complete and wave ‘c’ is expected to rally out to a new high to complete three waves up in wave (v).
Once we have a completed ending diagonal pattern in [v],
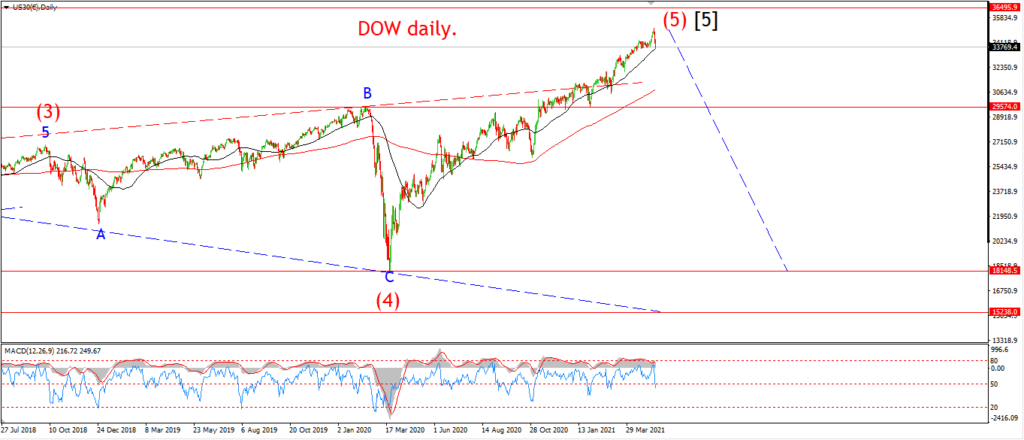
then I will start to looking lower again.
The alternate count is looking at the idea that the top is already in for wave [v].
If the price drops below 34560 again,
that will favor the alternate count.
Tomorrow;
Watch for wave ‘b’ of (v) to complete.
the rally in wave ‘c’ should trace out five waves up and break to a new all time high at a minimum.
when a new high is achieved,
that will be enough to complete the overall pattern in wave (v) and wave [v].
GOLD
GOLD 1hr.
GOLD 4hr.
GOLD daily.
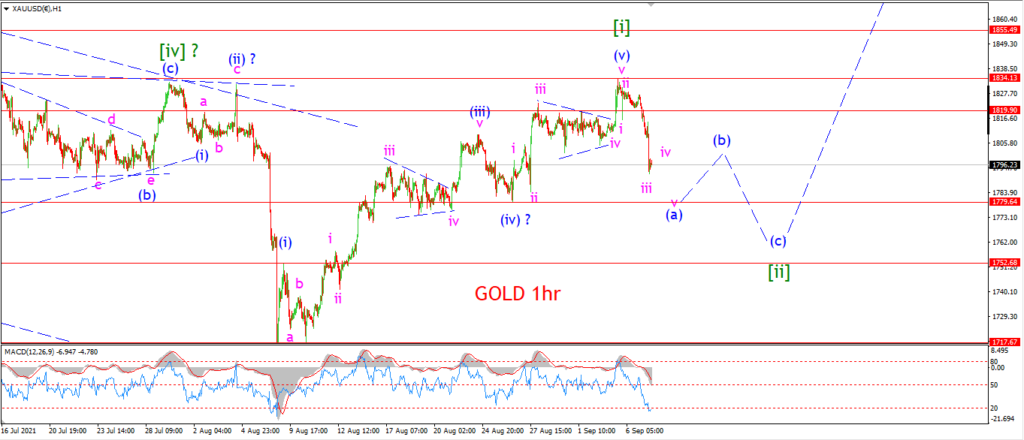
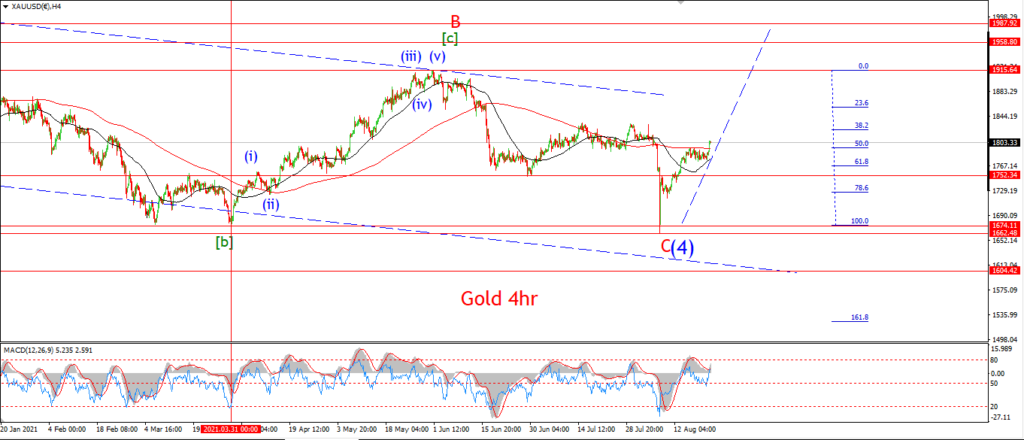
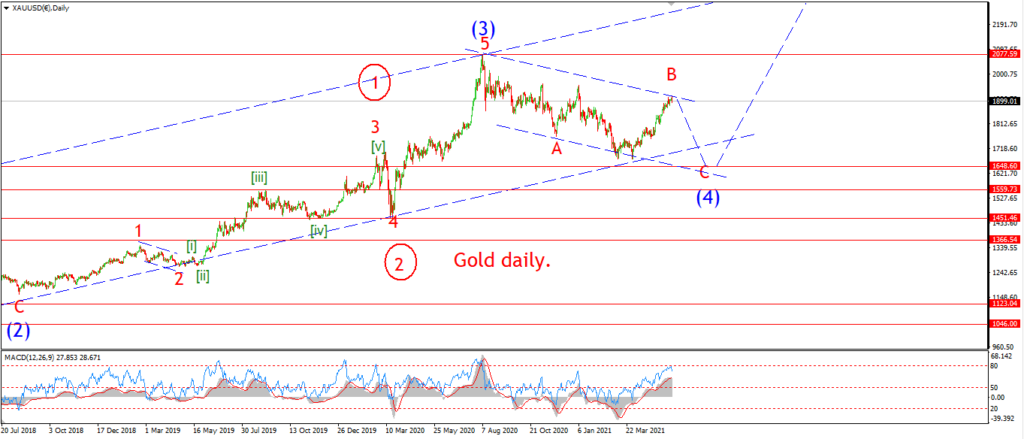
Gold is now fast approaching a very important point in the overall pattern.
Wave [ii] is looming,
and once this correction is complete,
the way will be open for a powerful rally in wave [iii].
Todays decline is labelled as wave (a) of [ii].
The price is close to completing a five wave pattern lower off the wave [i] high.
Wave (a) should complete in the area of the previous fourth wave at about 1780.
And then I will look for a correction higher in wave (b) in three waves later in the week.
Tomorrow;
Watch for five waves down to complete in wave (a) of [ii].
I am still looking towards that 1750 area to complete this wave [ii] correction.
CRUDE OIL.
CRUDE OIL 1hr.
CRUDE OIL 4hr.
CRUDE OIL daily.
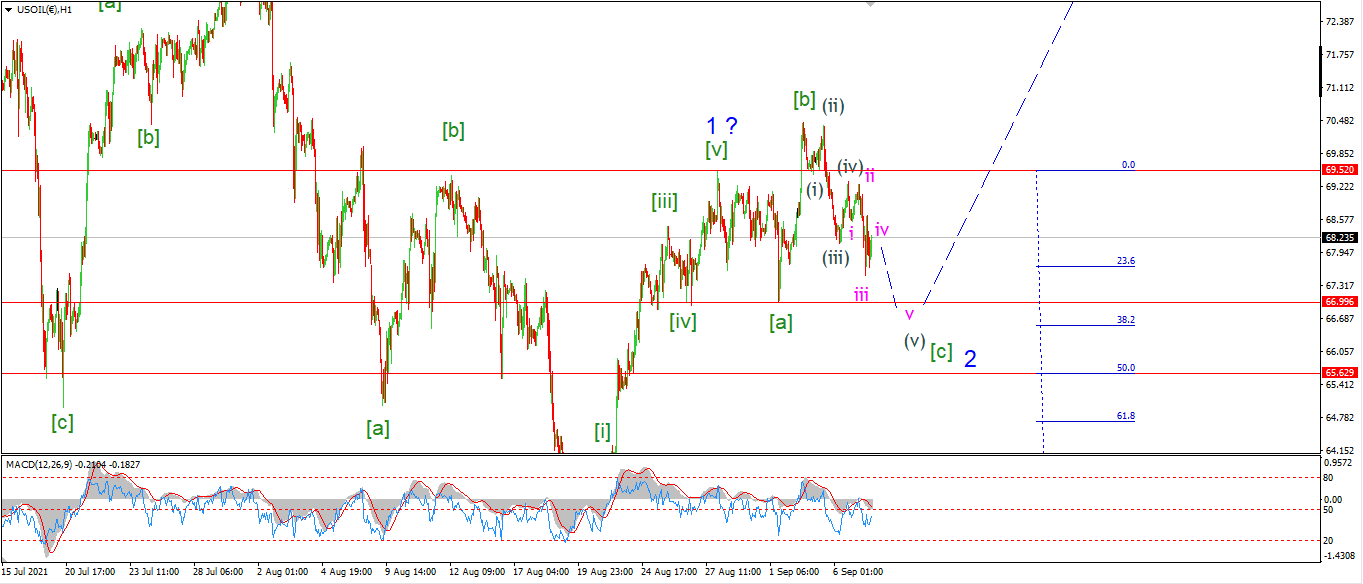
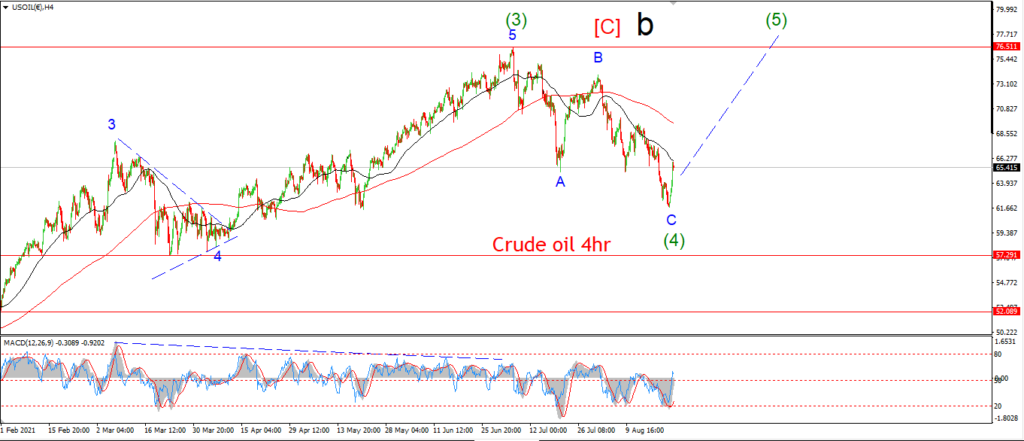
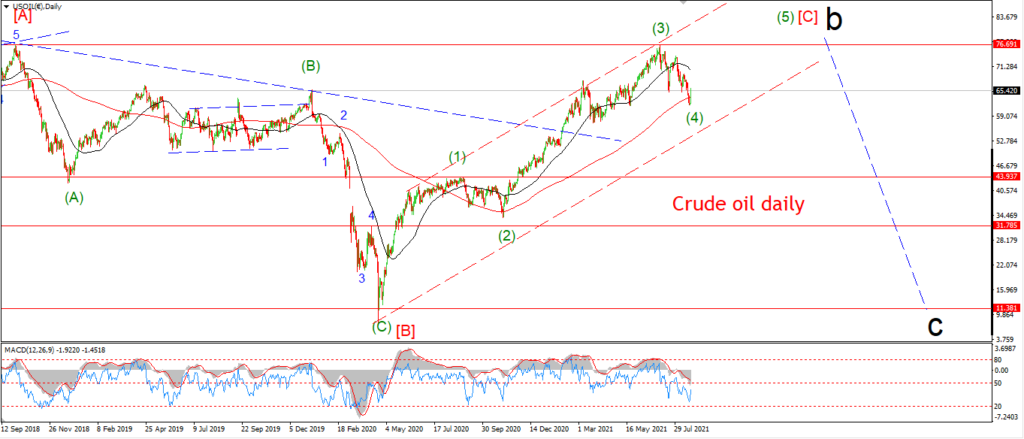
Crude should be approaching the end of the correction in wave ‘2’ this week.
The decline today is viewed as wave (v) of [c].
and wave (v) seems to be tracing out a five wave pattern itself.
I want to see a drop below 67.00 again to complete wave [c].
But it would serve the pattern better if wave [c] fell towards 65.60 at the 50% retracement level again.
We will see soon enough how wave [c] pans out.
Tomorrow;
Watch for wave (v) of [c] to continue lower and break 67.00 at a minimum.
S&P 500.
S&P 500 1hr
S&P 500 4hr
S&P 500 daily.
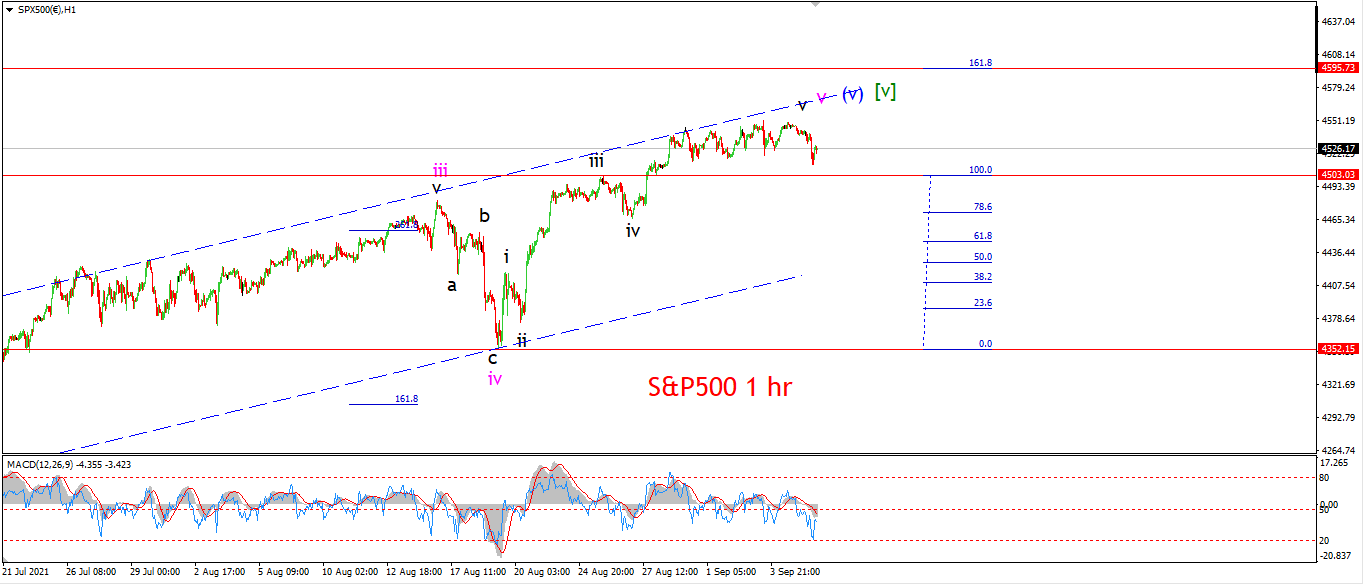
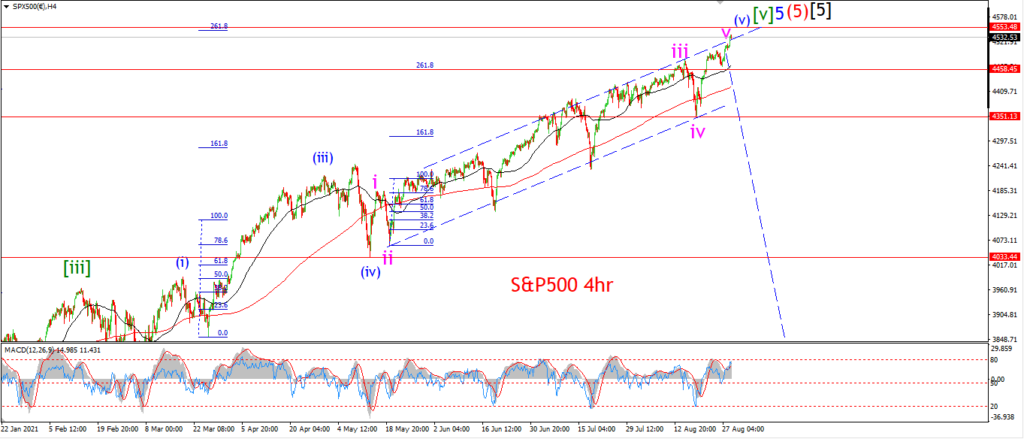
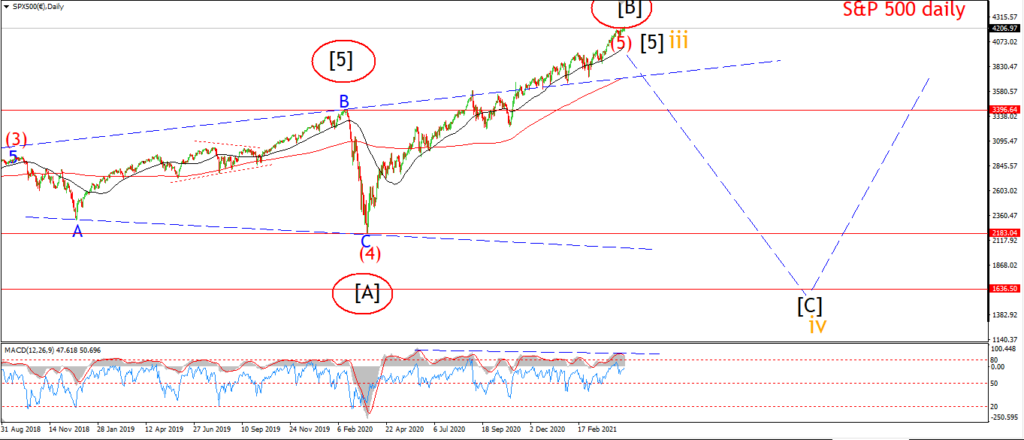
There is not a whole lot to report on this pattern here today!
I think there is enough of a rally now in place to call this pattern complete.
But the action off the top has not been convincing enough to push me to look to the downside just yet.
There is definitely an open door now for this market to turn down in a serious way,
but I will have to wait and see how this weeks trade goes before jumping onboard the bear train again!
Tomorrow;
Lets see if todays decline has any follow through to give us.
If we do see a drop below 4350 again,
then we may be in business.
SILVER.
SILVER 1hr
SILVER 4hr.
SILVER daily.
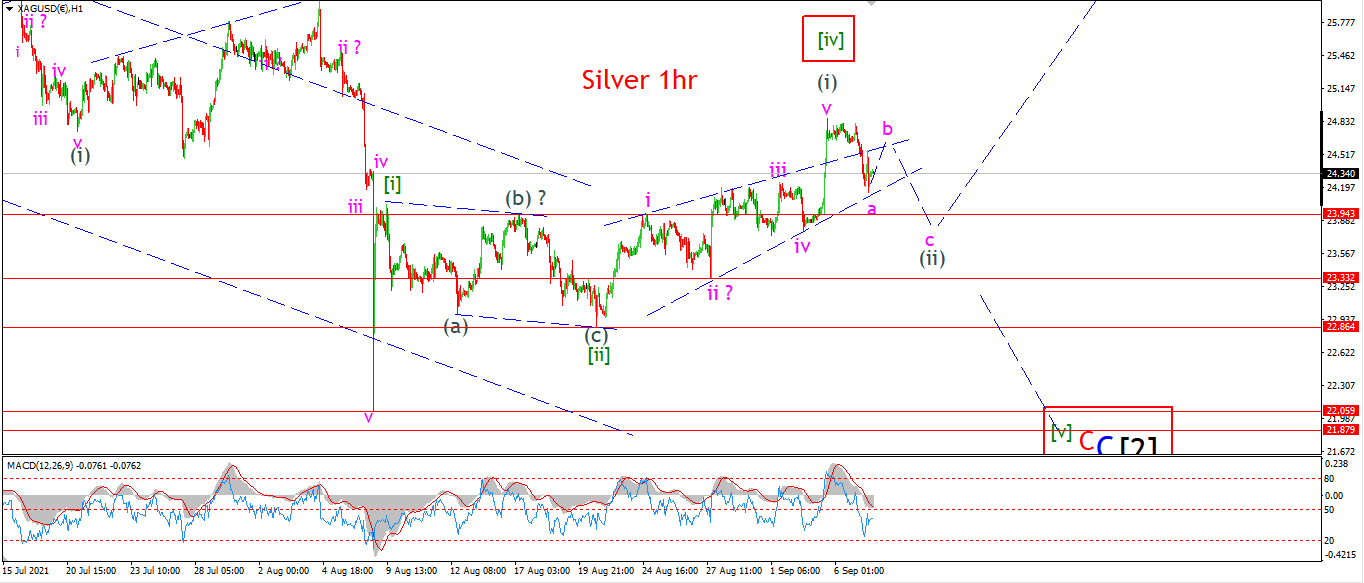
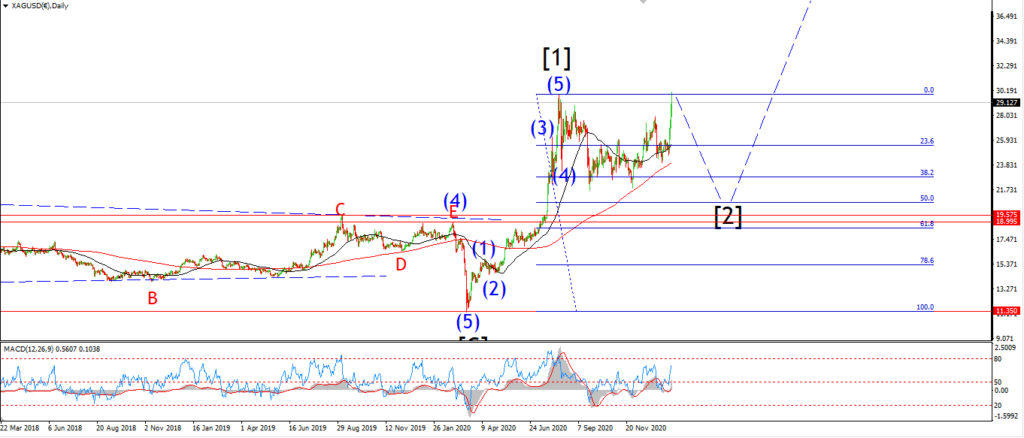
The pattern is getting really complicated for this uber bullish wave count to hold.
Todays decline did break out of the previous pattern shown for wave (iii) up.
And that interpretation is now invalid.
Tonight I have been forced to include a leading diagonal pattern as wave (i) of [iii].
This is in no way ideal,
so I am now intruding the previous bearish pattern back into the mix again.
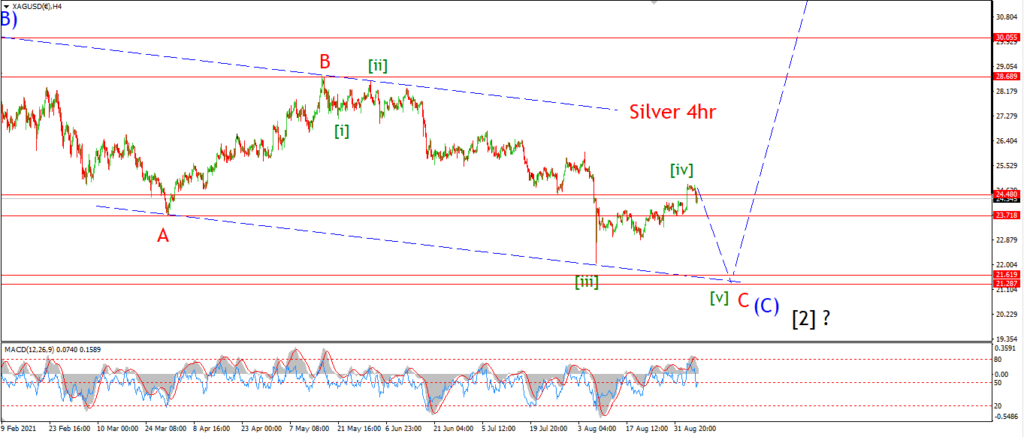
If we look at the 4hr chart,
wave ‘C’ red can be broken into a five wave pattern lower.
the alternate count views Last weeks high as wave [iv] of ‘C’.
and that opens up the possibility of a decline into wave [v] of ‘C’ beginning this week.
In this scenario,
wave [v] of ‘C’ will fall into the 21 handle again.
Tomorrow;
I will keep working with the bullish count until it becomes untenable.
A break of 22.86 again will trigger the alternate count.
Watch for wave (ii) to complete three waves down and hold above 22.86.
BITCOIN
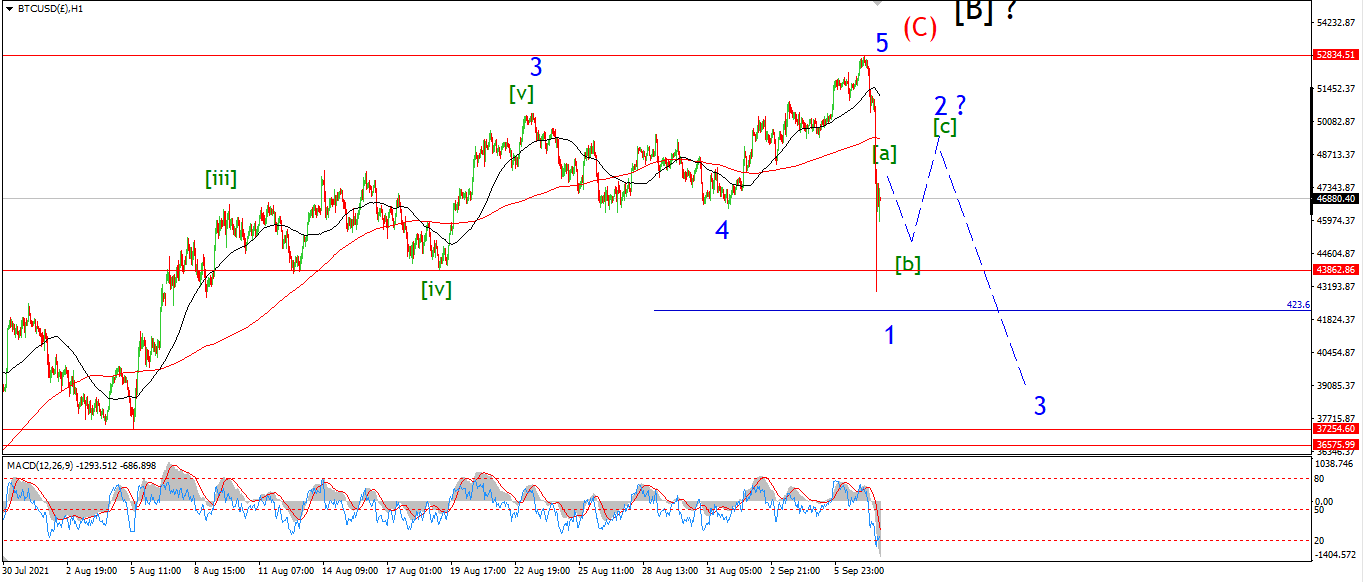
BITCOIN 1hr.
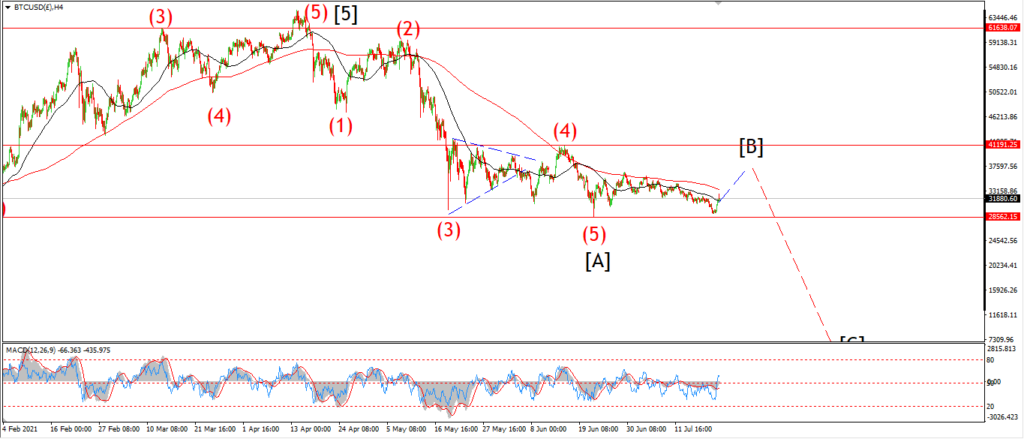
BITCOIN 4hr.
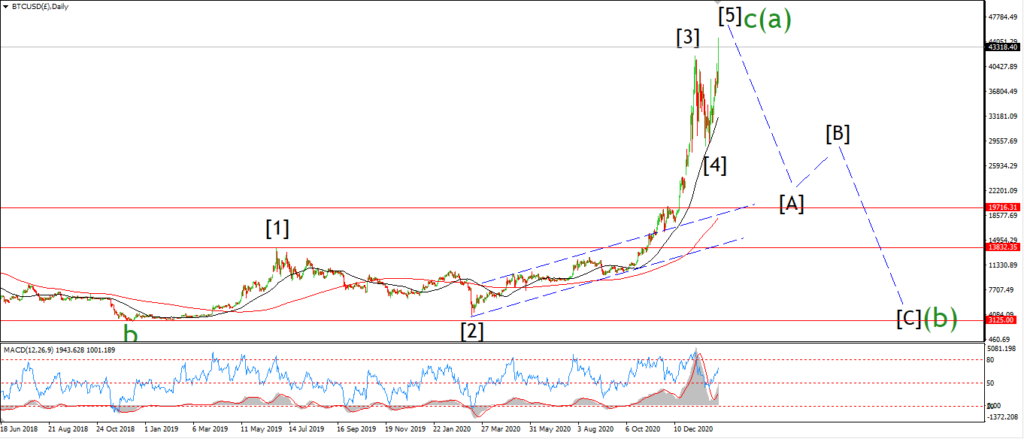
BITCOIN daily.
Topping in wave [B].
FTSE 100.
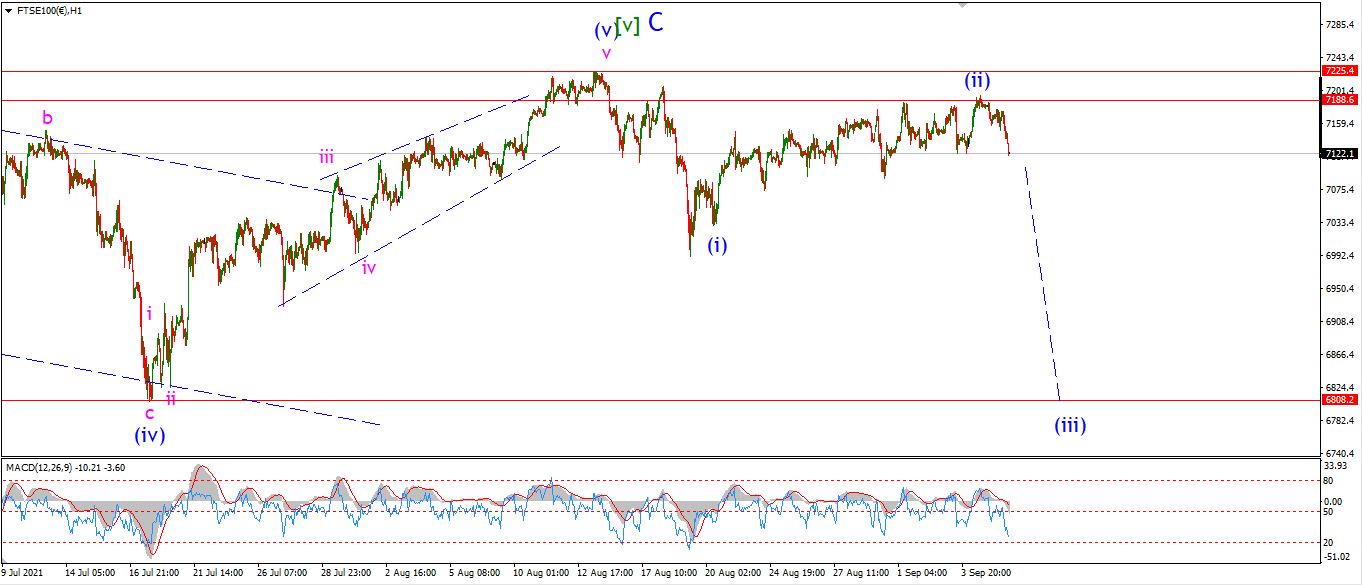
FTSE 100 1hr.
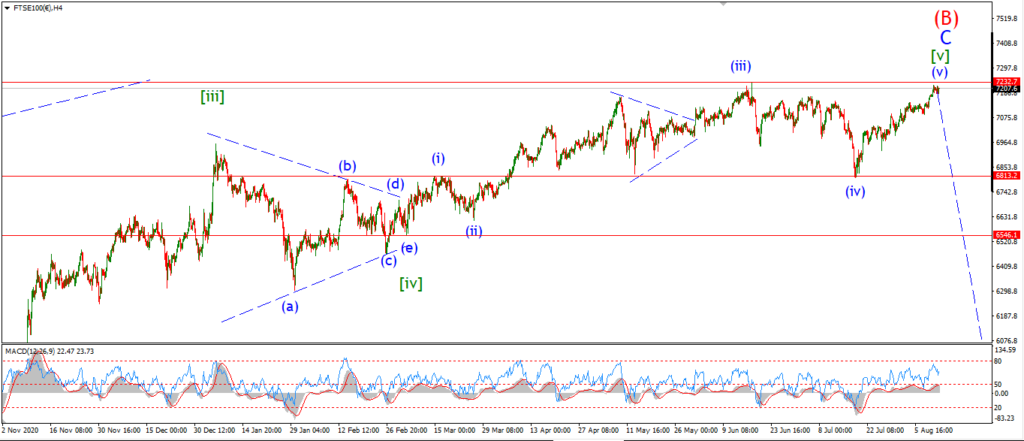
FTSE 100 4hr.

FTSE 100 daily.
Complete wave (B).
DAX.
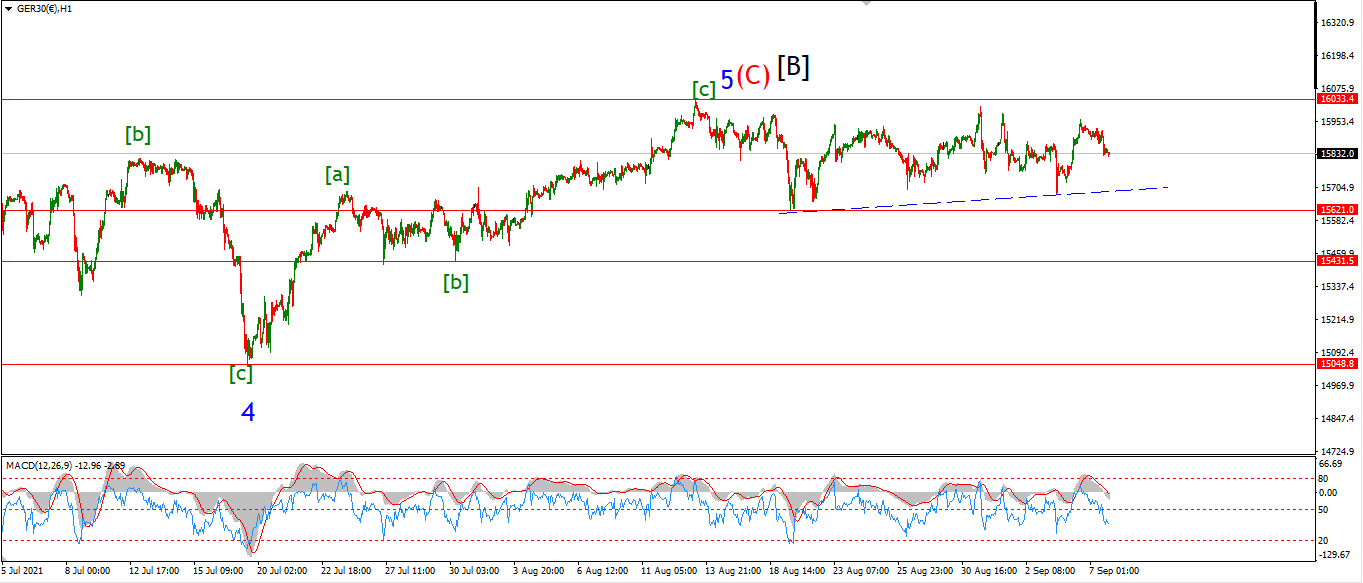
DAX 1hr
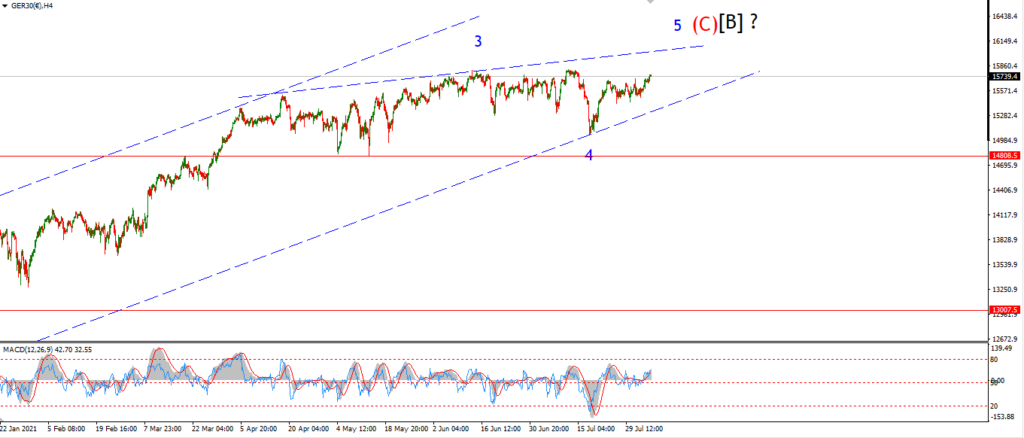
DAX 4hr
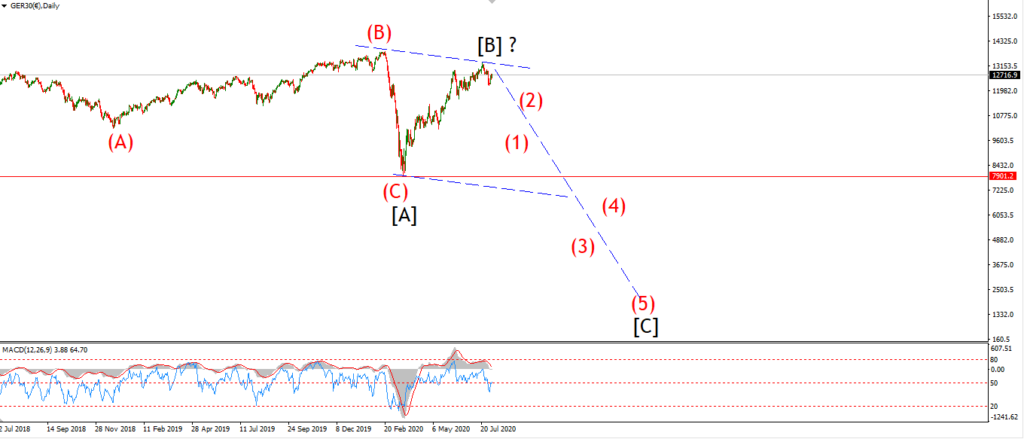
DAX daily.
Topping out in wave [B].
NASDAQ 100.
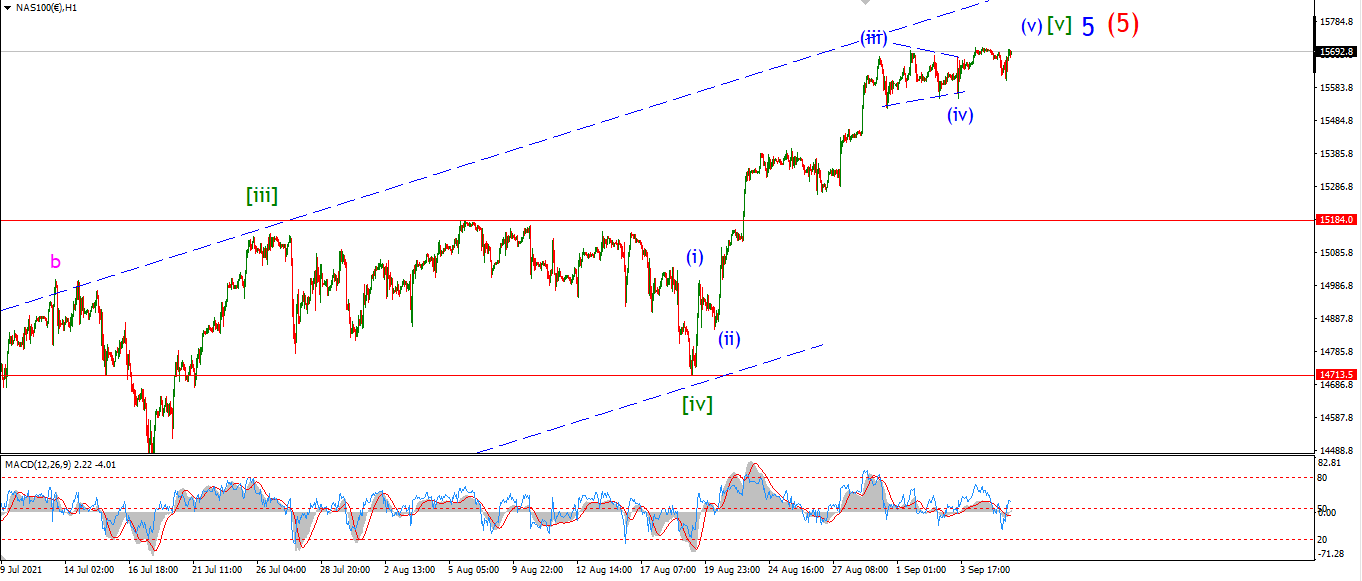
NASDAQ 1hr
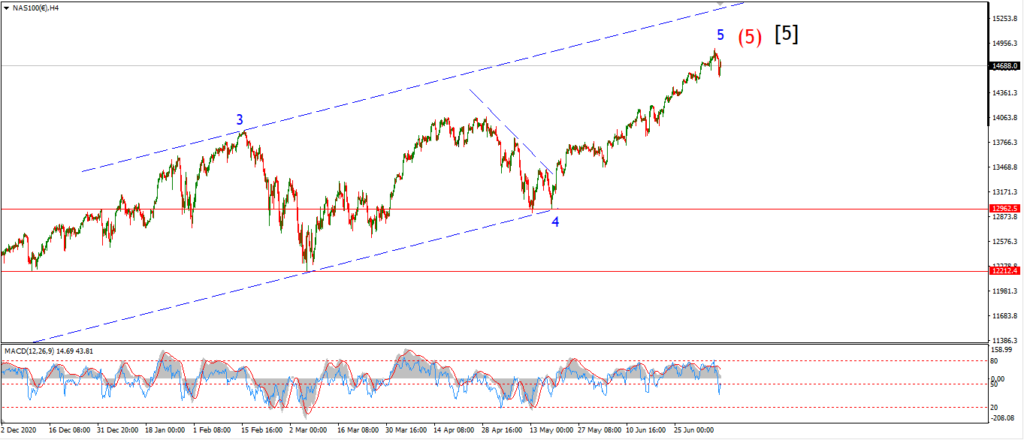
NASDAQ 4hr.
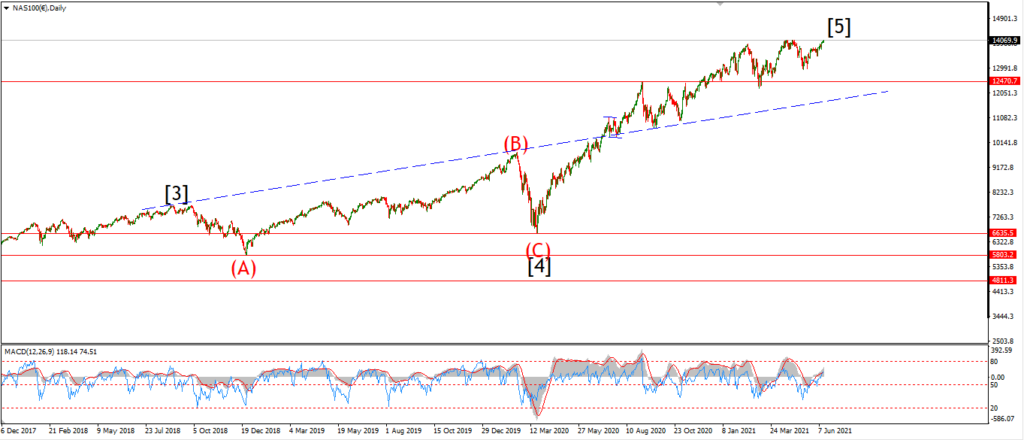
NASDAQ daily.
Is this it for the Nasdaq??