I use the MACD indicator along with my Elliott wave counts,
every day,
on every time frame chart,
in every market that I follow!
That shows how important a good momentum indicator like MACD is to help you figure out the developing price trend.
Here’s a quick example:
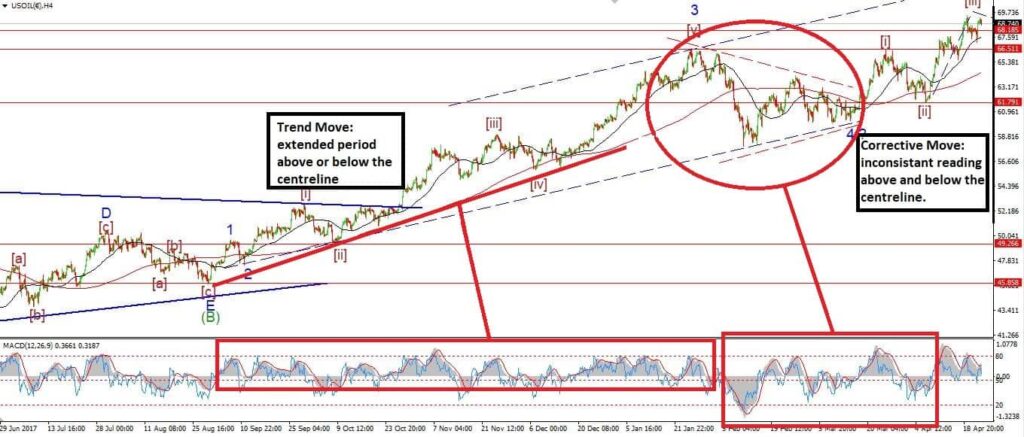
Counting Elliott waves with MACD is also helpful way to increase your confidence in an Elliott wave count.
The MACD indicator acts differently at different points in the five wave structure.
So, it can be used to identify the main waves in a structure.
Here are some guidelines for using MACD with Elliott wave analysis:
- 1. MACD helps distinguish a trend move from a correction.
- 2. The MACD indicator displays different characteristics within different waves.
- 3. MACD diverged from the price direction at the end of a uniform price move.
In this article I will expand on each of those guidelines.
First, sort out your MACD settings.
.Here are the standard settings for the MACD indicator.
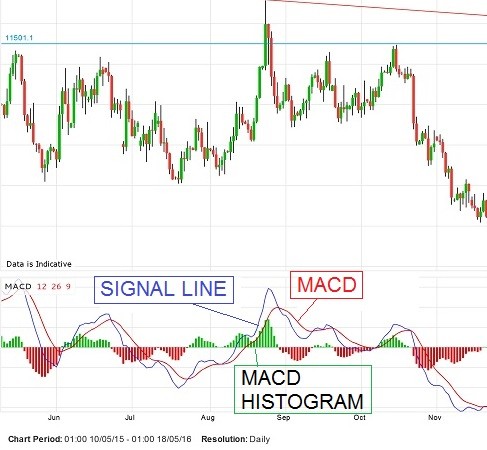
MACD Line: (12-day EMA – 26-day EMA)
Signal Line: 9-day EMA of the MACD.
MACD Histogram: MACD Line – Signal Line
Plug these in to start with and you are good to go!
.MACD helps distinguish a trend move from a correction.
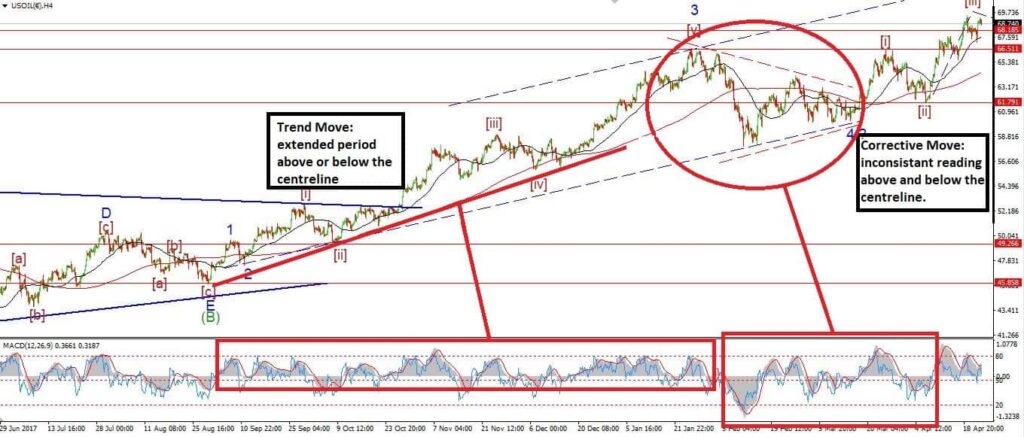
During a trend move, MACD will remain at or above the centreline in an uptrend, or at or below the centreline in a downtrend.
The first serious break of the trend will cause the MACD line to break to the opposite extreme of the indicator.
In a corrective phase, the MACD line will erratically jump above and below the center line without any real uniformity.
The MACD indicator displays different characteristics within different waves.
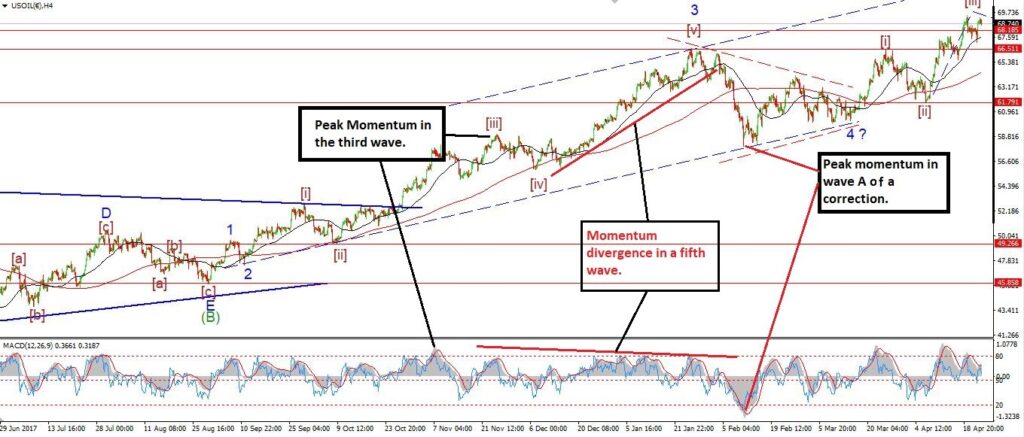
In a five wave Elliott wave structure, the third wave is usually the longest and strongest wave.
The MACD line will show a peak in momentum within that third wave.
This can help you identify the third wave within a structure.
In a corrective phase, wave ‘A’ is usually the point of peak momentum.
This again is useful when trying to orientate yourself in the wave structure.
MACD divergence from the price direction at the end of a uniform price move.
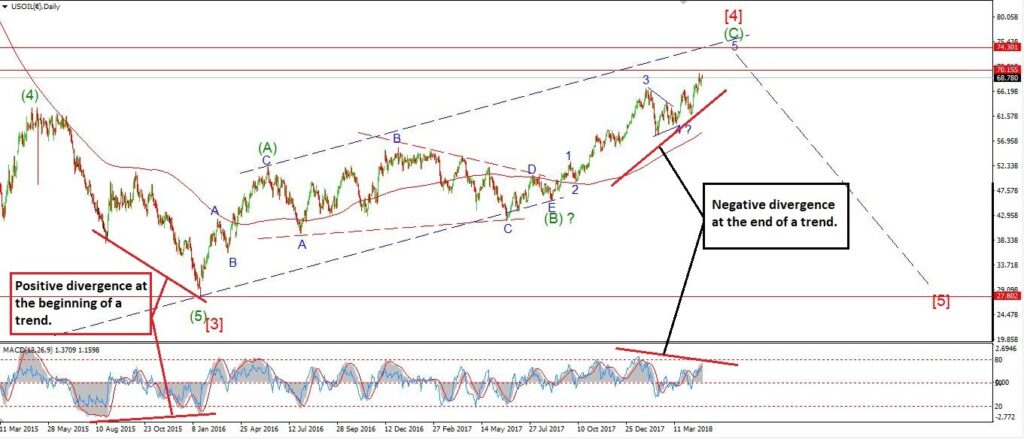
At the end of every trend move, either declining or rising, MACD will diverge the opposite direction before the price reaches the end of that trend.
When a downtrend is reaching the end of the wave structure, the MACD line will diverge upwards creating higher lows before the price finally bottoms out.
In an uptrend, the MACD line will usually top out in the third wave of the final move up.
And the MACD line will create lower highs as the price moves to the final high.
MACD INDICATOR EXPLAINED
.
In short, we use the MACD as a technical indicator in the hope of figuring out whether an asset is overbought or oversold.
Traders then try to generate buy-and-sell signals from interpreting the movement of the indicator.
The more practical application of the MACD indicator, may be best used as an indication trend strength.
As the name suggests, the MACD is about the convergence and divergence of two exponential moving averages. The indicator attempts to capture short term price movements relative to a longer term average price.
So;
Convergence happens when the moving averages are moving towards each other. Divergence occurs when the moving averages move away from one another.
The fast moving average is set to 12 days, and is responsible for most of the MACD changes and the slower moving average is set to 26-days and less sensitive to price changes.
These indicator subtracts the value of the averages and then we get the MACD line. This is how the lines cross each other in the indicator.
The MACD Line is plotted around a centreline and oscillates above and below that zero line. When the MACD is on the zero line it means there is no difference in the value of both EMA’s.
SO;
The zero line is significant because it can show areas of price support and resistance.
.
POSITIVE AND NEGATIVE MCAD.
.
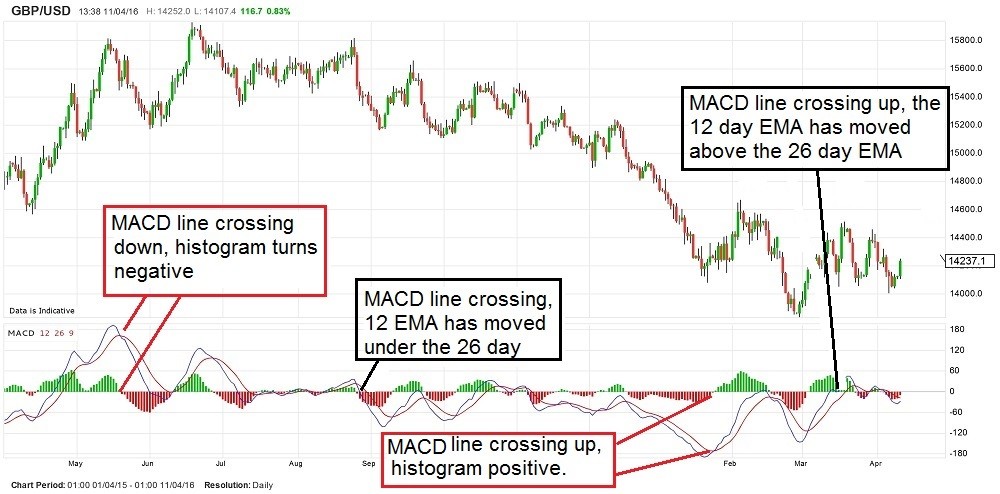
A positive MACD shows us that the 12-day EMA is above the 26-day EMA.
As upside momentum increases, the faster EMA moves away from the slower EMA thereby increasing the value of the MACD line.
On the opposite side;
A negative MACD shows us that the 12-day EMA is below the 26-day EMA.
And as downside momentum increases, the faster EMA moves away from the slower EMA thereby increasing the value of the MACD line on the negative side.
The other line on the indicator is the signal line, the Signal Line shows the 9-day EMA of the MACD Line.
So;
Because of this, the Signal Line lags behind the MACD line.
Buy-and-sell signals are generated by these two lines interacting with each other. These two lines fluctuate around the zero line which is found on the y axis on the right side of the chart.
APO
The MACD is classed as an absolute price oscillator (APO), because it deals with actual prices of the security rather than percentage changes.
So;
You should never use the MACD indicator to compare the relative value of two different securities. Because, an APO will show greater levels for higher priced securities and smaller levels for lower priced securities.
.
MACD INDICATOR STRATEGY
.
The MACD indicator is generates three types of basic signals;
- Signal Line Crossovers,
- Zero Line Crossovers, and
- Divergence’s
.
SIGNAL LINE CROSSOVERS
.
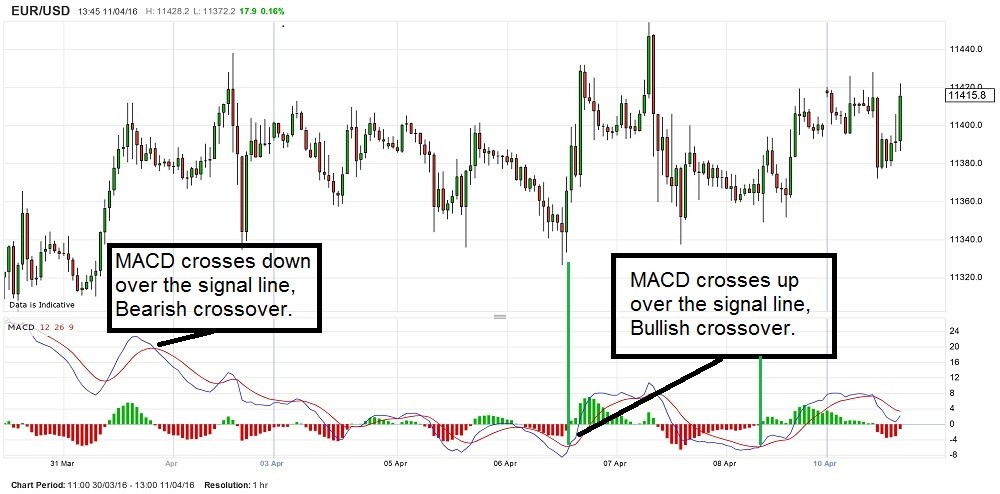
- When the MACD line declines below the signal line, it is taken as a bearish signal, which tell us that it might be time to sell.
- When the MACD line rises above the signal line on the other hand, the indicator generates a bullish signal, this is a hint that the prices are likely to accelerate higher.
Most traders wait for a definite cross above the signal line before entering into a position to avoid getting caught by a false breakout, or entering into a position too early.
Signal line crossovers, as opposed to zero line crossovers, are more frequent and possibly more actionable to a trader.
..
ZERO LINE CROSSOVER SIGNALS.
.
.
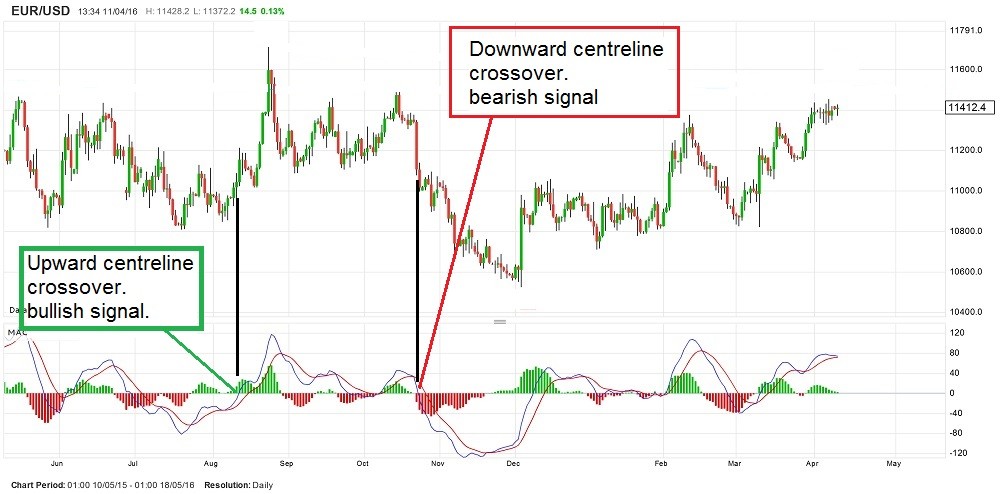
A zero Line Crossover signal occurs when the MACD Line crosses the Zero Line in either direction.
A bullish Zero Line crossover occurs when the MACD Line crosses above the Zero Line and goes from negative to positive, this is indicative of increasing positive price momentum.
Conversly;
A bearish zero Line crossover happens when the MACD Line crosses below the Zero Line and goes from positive to negative, this is shows us that negative price momentum. Increasing.
.
DIVERGENCE
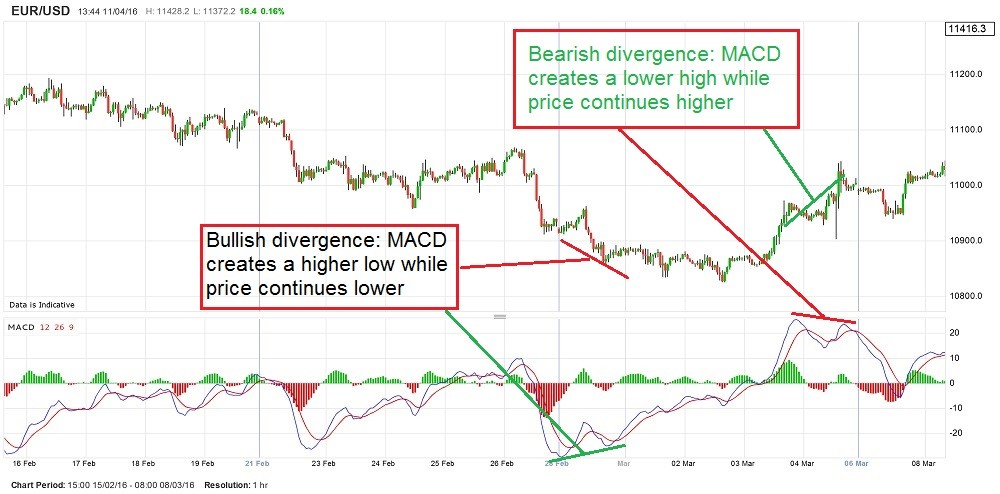
Divergence occurs when the movements of the MACD and the price action differ from each other.
- A Bullish Divergence happens when a price dips to a lower low, but the MACD instead, stops at a higher low.
A bearish Divergence is the exact opposite:
- This happens when price prints a higher high but the MACD line records a lower high,
These momentum shifts shown by the divergence of the MACD can alert traders to take note and watch for price reversals to follow.
.
MACD HISTOGRAM
.
.
The MACD histogram is a bar chart, that’s it!
It measures the height difference between the MACD line and the signal line.
When the histogram is on the zero line, it shows us that the signal line and the macd are equal, so a signal line cross might be about to happen.
Many traders like to enter a trade shortly after the histogram has plateaued but before the MACD has crossed the signal line, thereby getting ahead of a substantial move in prices.
There have been studies that show greater returns have been made over time,when traders buy and sell on reversals in the MACD histogram,
rather than waiting on signal line crossings, that is something to note.
.
TIPS FOR USING THE MACD INDICATOR In Your Wave Count..
If you want a more sensitive indicator, try a experimenting with a more sensitive setup such as 5,35,5 this might be better suited for longer timeframe charts.
If you are a trend trader and want a less fidgety setup, try lengthening the settings. A less reactive MACD will still oscillate above/below zero.
But centerline crossovers signals will be less frequent.
Remember that an indicator is just a function of the price, it will not always be correct, In fact more often than not, it will be wrong when you need it most!
That is just personal experience talking.
The real value In the macd comes in the form of a momentum test.
While using it as a trade entry tool is questionable, It cannot be beaten as a tool to show you whether the trend has legs to continue or not.
At least that where I find it is most valuable in my trading.
So there you have it, It’s not voodoo or rocket science,
Now, get to it and incorporate the MACD into your trading strategy today.
How to use Elliott wave signals in your trading.
