
Good evening folks, and may the Lord of hosts Bless you all this fine night.
Adding some more charts and links to the intro tonight;
Here’s another in the long line of correlations with the 2000 highs in this chart.

https://twitter.com/EconguyRosie/status/1400064931060387840/photo/1
Guess what? The demand boom is over. Charts don’t lie – once supply comes back on stream, the demand downturn will cause inflation to morph into deflation. Definitely out of consensus and not priced into anything. Treasuries will rally and cyclical-value equity trade will fade.

Beware The BIS: Macleod Warns “We’re At The Top Of The Bubble”
And what about that DXY setup????
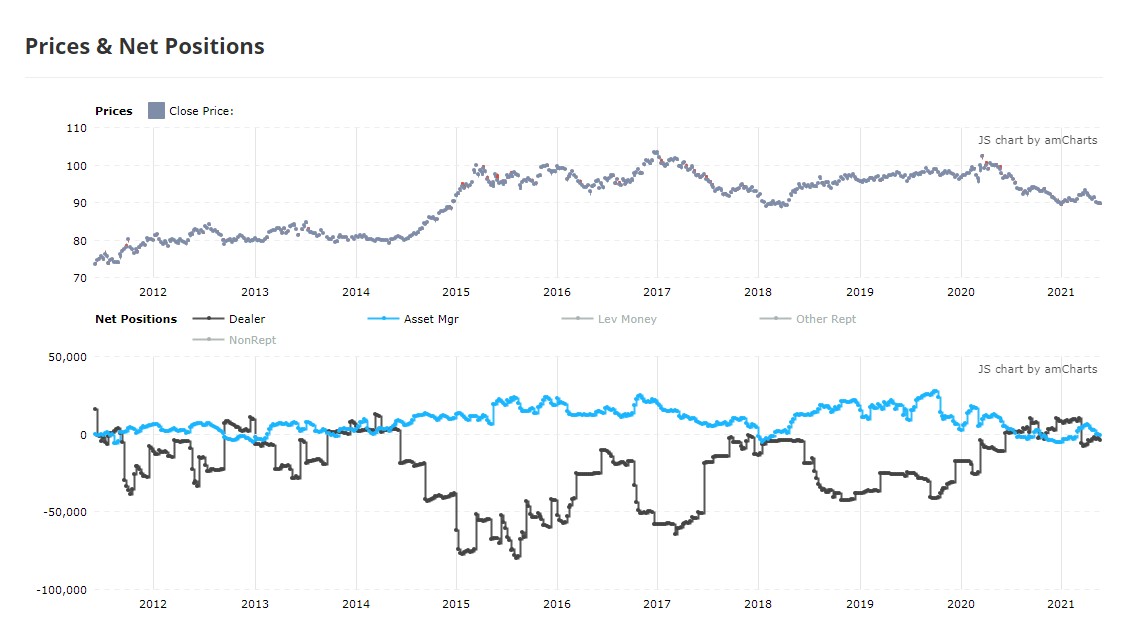
EURUSD.
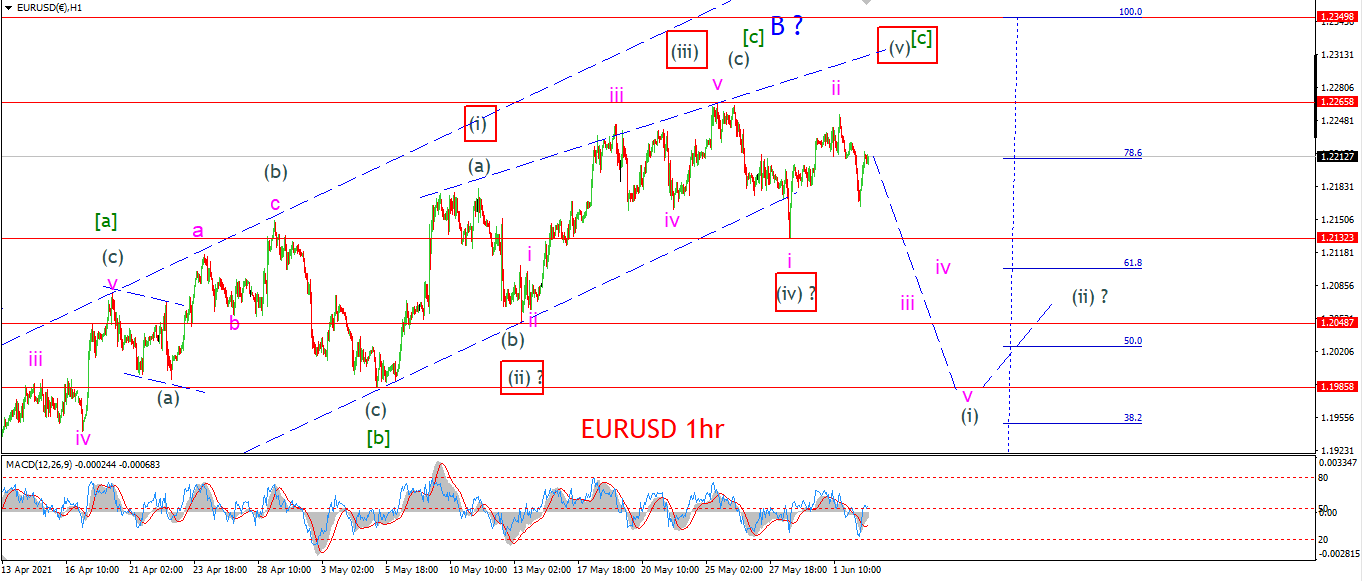
EURUSD 1hr.
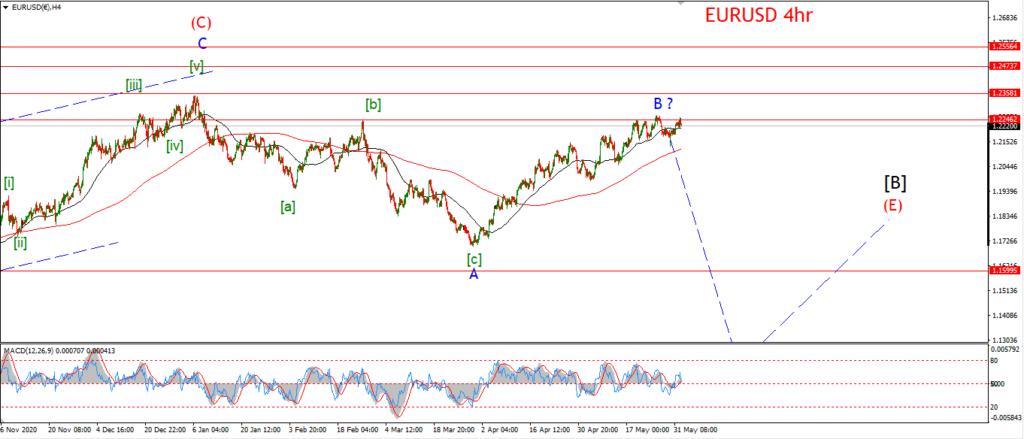
EURUSD 4hr.
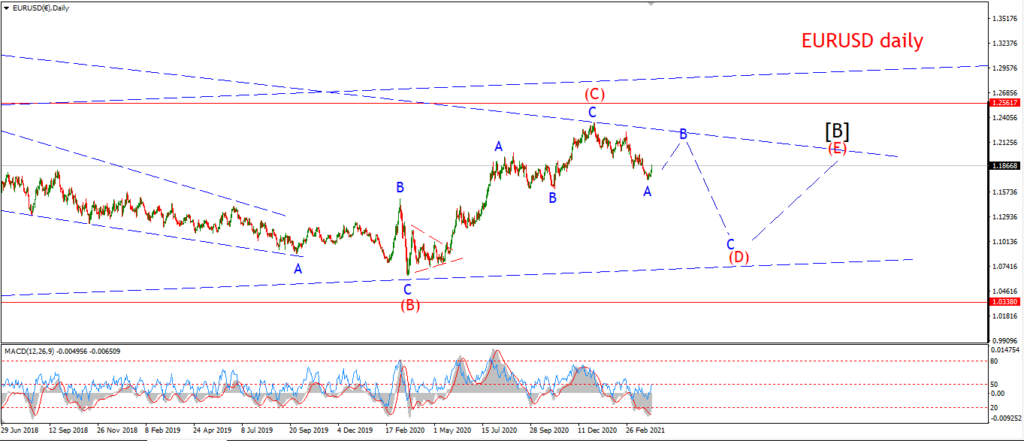
EURUSD daily.
EURUSD has retreated from the invalidation level at 1.2265 today,
however this decline is only in three waves so far.
I want to see the decline continue and break below 1.2132 to signal wave ‘iii’ down has begun.
And of course the high at 1.2265 must continue to hold.
I have shown a possible alternate count for wave [c] if the price breaks above 1.2265.
This involves a wedge pattern to complete wave [c] of ‘B’.
In this case the price must hold below 1.2349.
Tomorrow;
Watch for wave ‘iii’ of (i) to break 1.2132.
GBPUSD
GBPUSD 1hr.
GBPUSD 4hr.
GBPUSD daily.
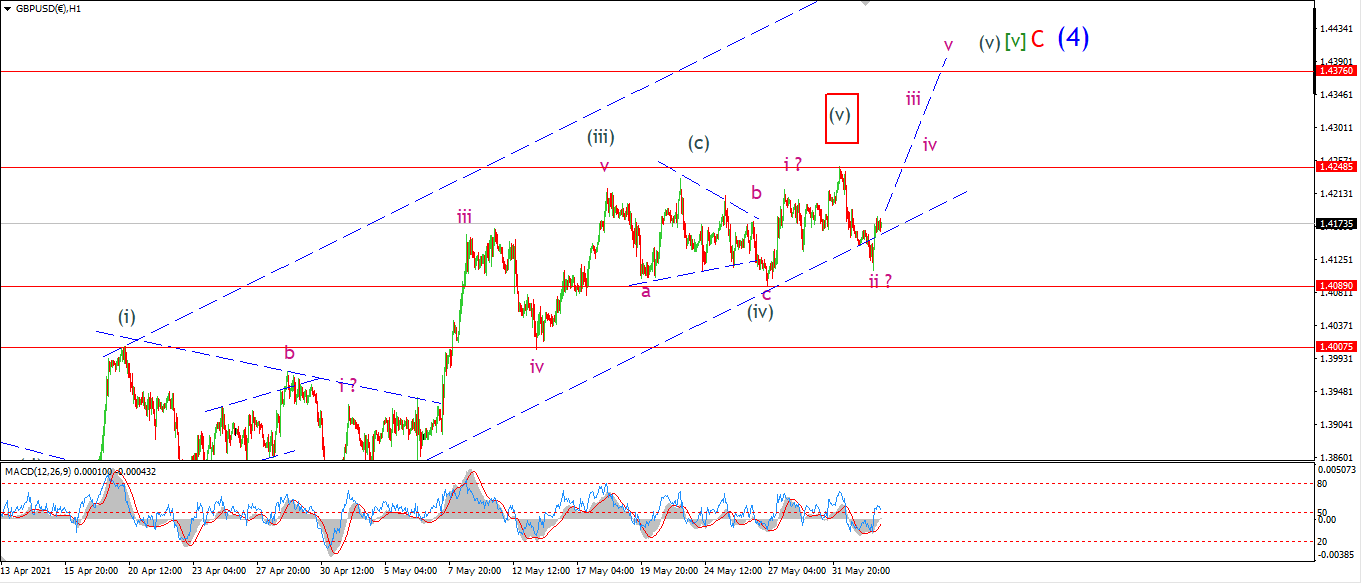
Cable came close to the initial support level at 1.4089 today reaching a low at 1.4107.
The ‘i’ ‘ii’ pattern is still intact within wave (v),
but if that initial support does break at 1.4089,
then I will switch back to my previous bearish short term view.
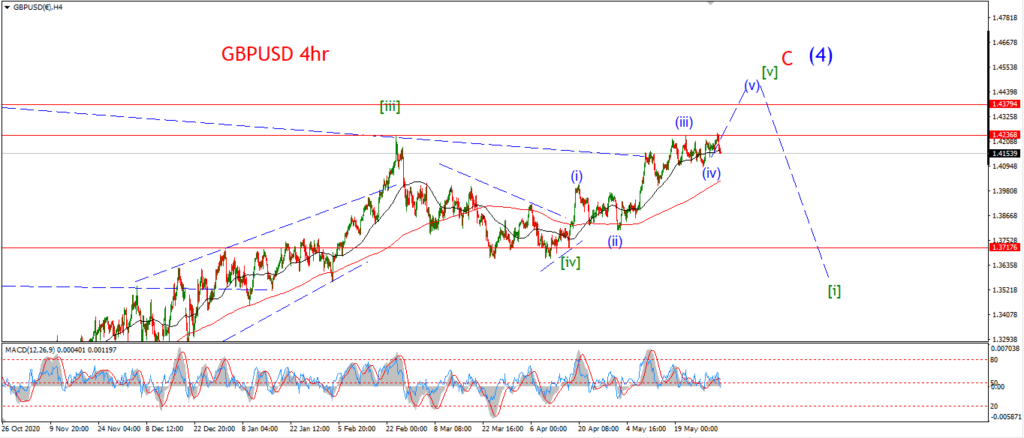
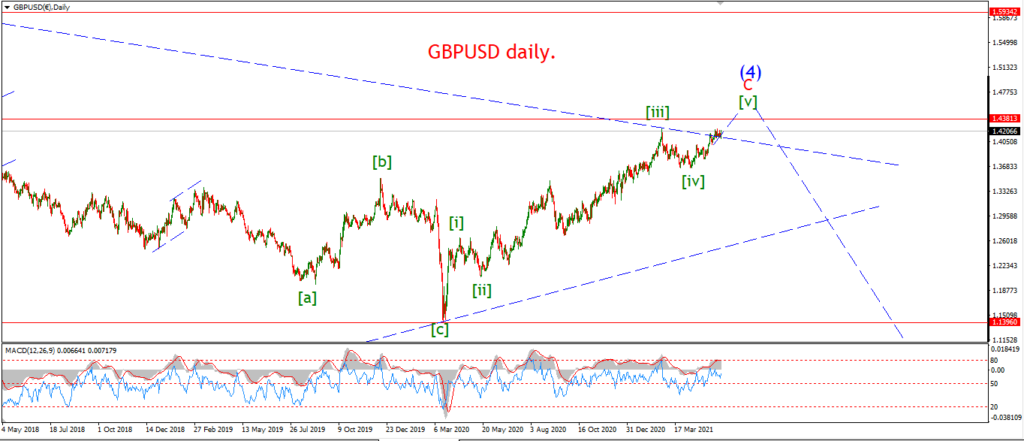
And then we could be looking at that long awaited decline to begin wave (5) blue.
Tomorrow;
Lets see if wave (v) will push to that new target level first at 1.4376.
Watch for wave ‘iii’ of (v) to break above 1.4248 at this weeks high.
USDJPY.
USDJPY 1hr.
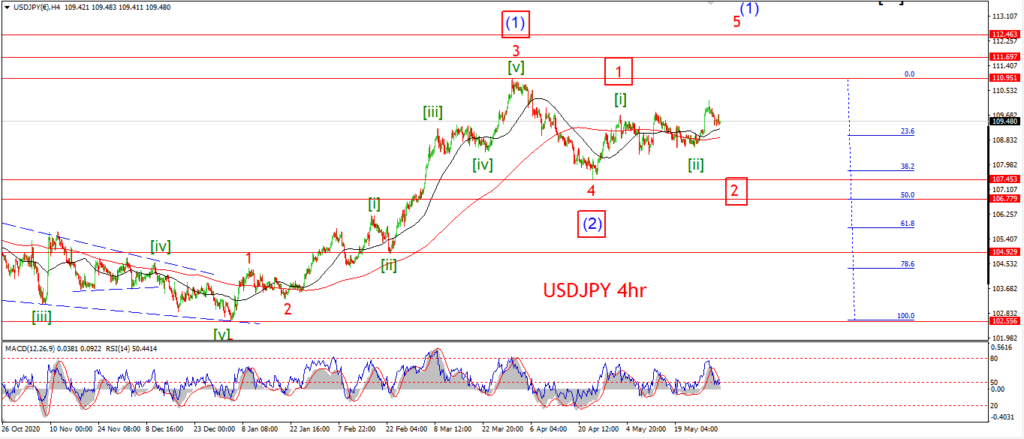
USDJPY 4hr.
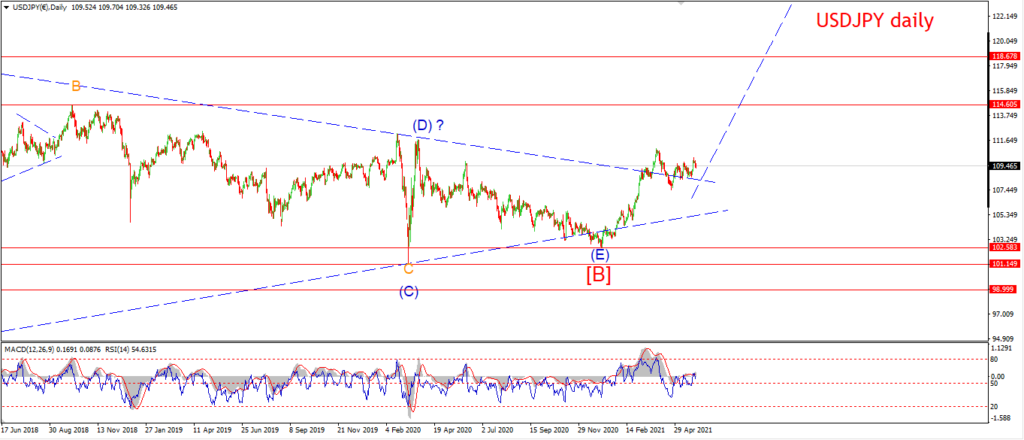
USDJPY daily.
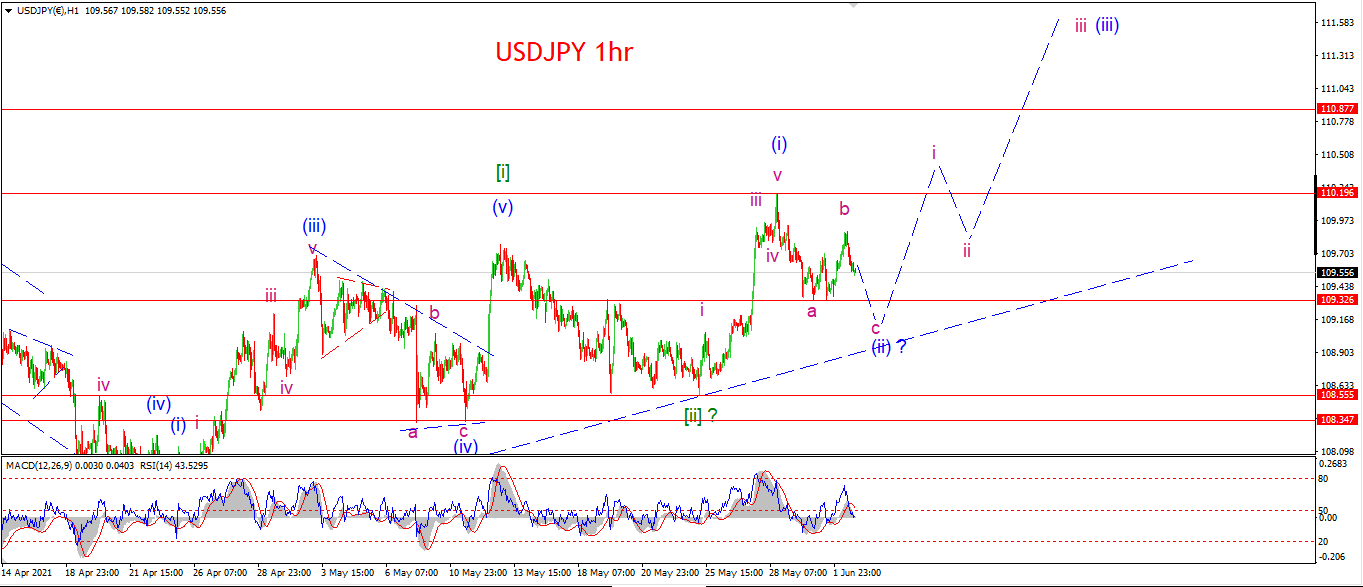
I am tempted to view wave (iii) underway after todays spike to another higher low this evening,
but the pattern off the recent wave (i) high just does not look complete yet.
So,
I am allowing for a clear three wave pattern in wave (ii) which should fall into the rising trend line again.
This count will be confirmed with a break of 109.32 again.
And a break above 110.19 again will signal wave (iii) is underway.
Tomorrow;
watch for wave ‘c’ of (ii) to break 109.32 and fall into the 109.00 area to complete.
DOW JONES.
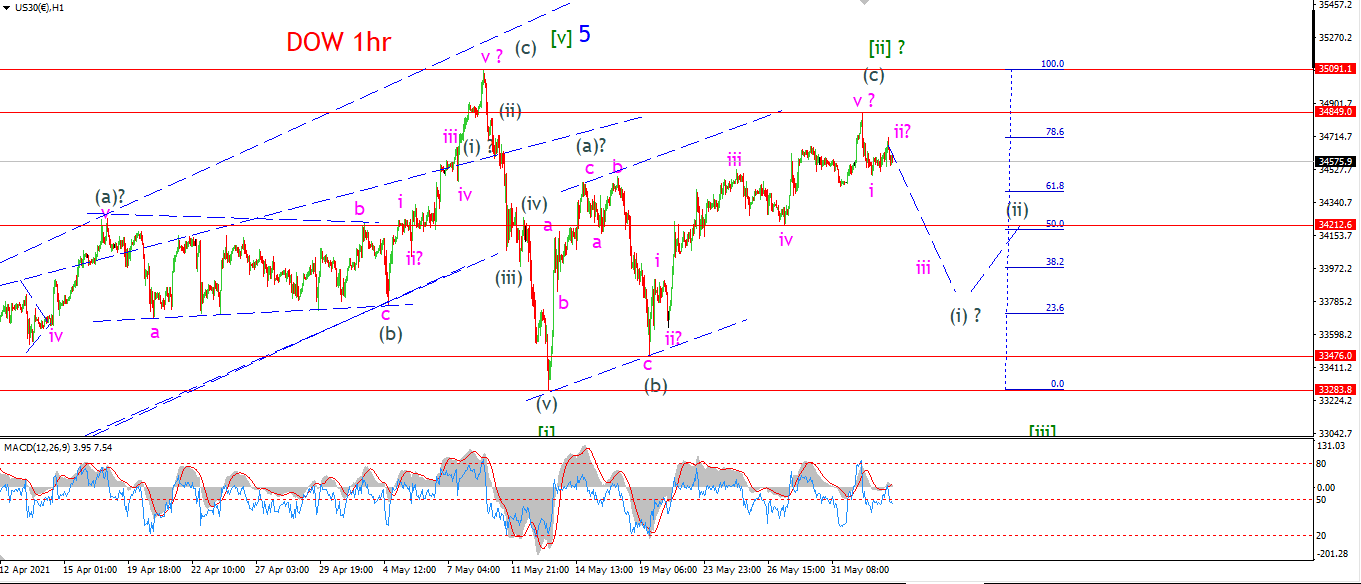
DOW 1hr.
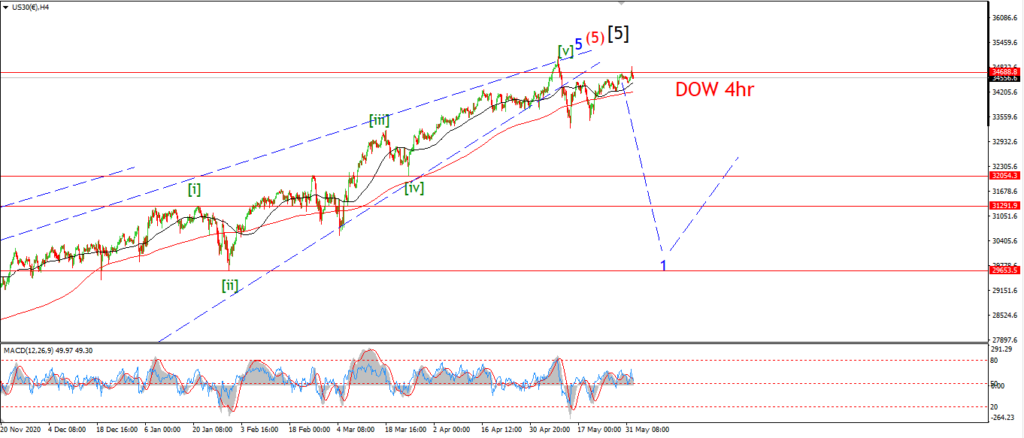
DOW 4hr
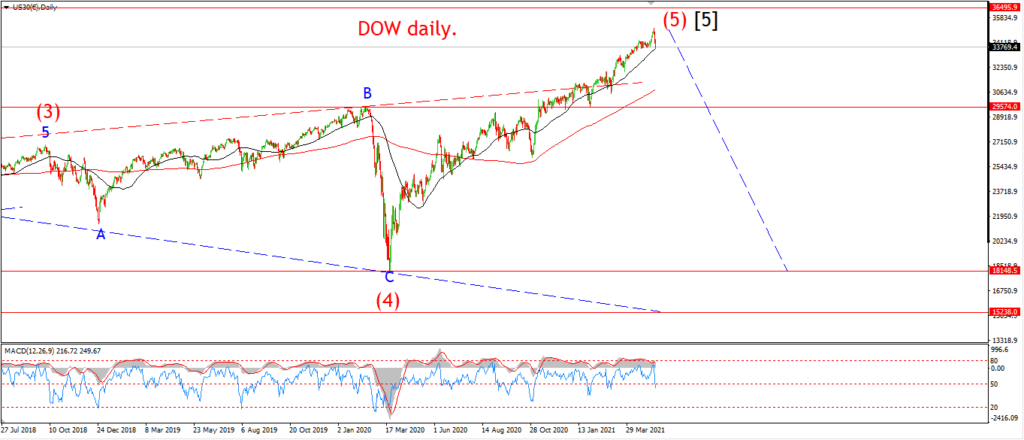
DOW daily.
Well,
the market is pointing lower again after a close call into wave [ii] green on Tuesday.
This bearish count still stands until we see a break above 34849 at least.
Todays trade was flat and corrective looking off a lower high.
So right now we have the possibility of a small impulse wave building to the downside labelled waves ‘i’ and ‘ii’ of (i) of [iii].
If this is correct,
then we are about to get a shock to the downside and wave (i) will retrace much of the gains in wave [ii] over the last weeks.
Tomorrow;
Watch for wave ‘iii’ of (i) to break 34212 to signal that the market is turning down into wave (i).
34849 must hold.
GOLD
GOLD 1hr.
GOLD 4hr.
GOLD daily.
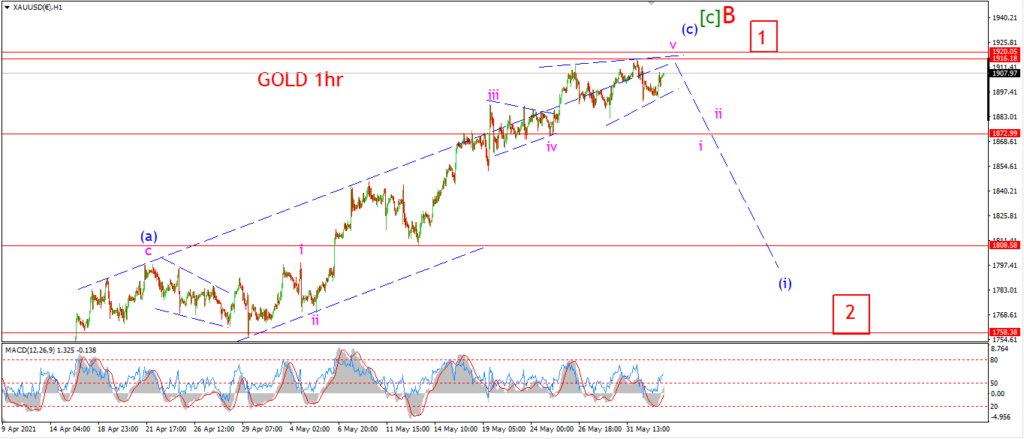
The options for higher gold prices in the short term are very limited indeed given the recent action.
Momentum has waned significantly over the last week on the short term chart,
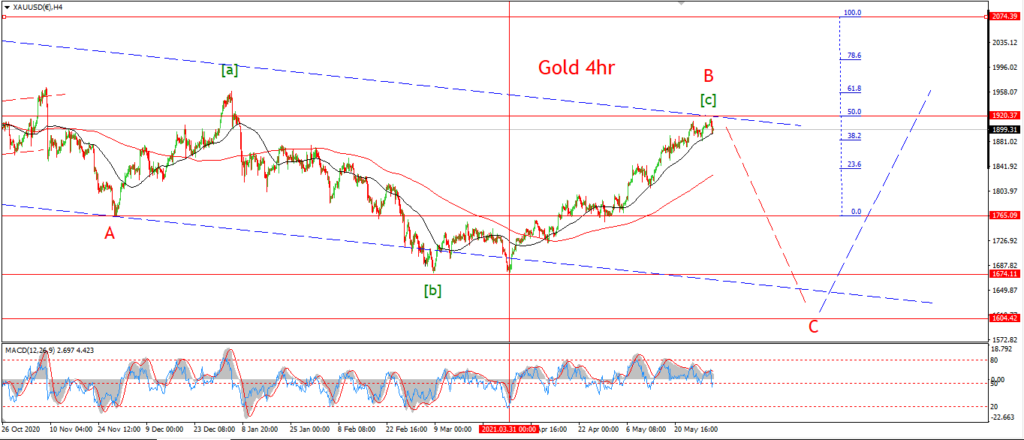
and the 4hr chart shows a worrying bearish divergence as we hit the top of wave ‘B’.
Both charts are signaling a rally that has now come to an end and.
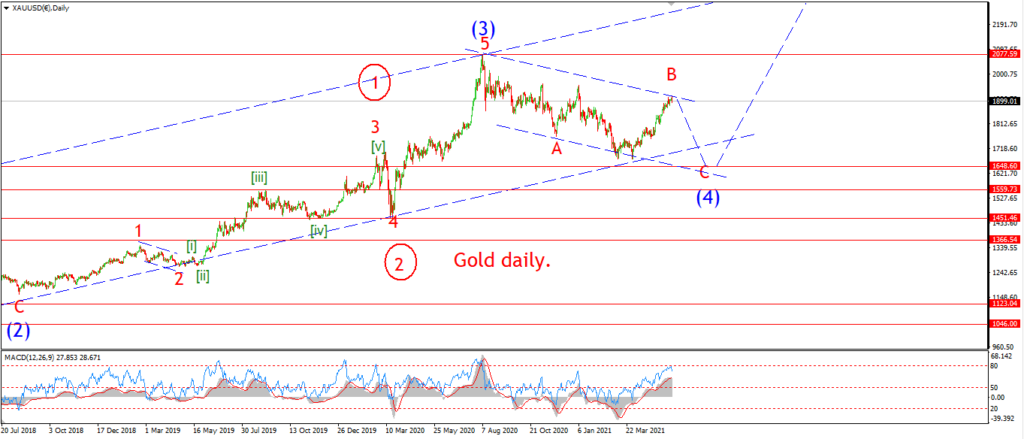
And if wave ‘C’ is ahead of us here,
then we will see at least a 15% decline over the coming months.
The alternate count calls for a more shallow decline in wave ‘2’,
but this can easily bring us down into the 1750 area for sure.
I have shown another possibility for wave ‘v’ pink this evening.
This is an ending diagonal pattern which is just skirting along the upper trend channel line as a guide.
Wave ‘v’ pink will top out tomorrow close to 1920 and then turn lower in five waves.
Tomorrow;
Watch for wave ‘v’ of (v) to complete an ending diagonal pattern and then reverse into wave ‘i’ down.
CRUDE OIL.
CRUDE OIL 1hr.
CRUDE OIL 4hr.
CRUDE OIL daily.
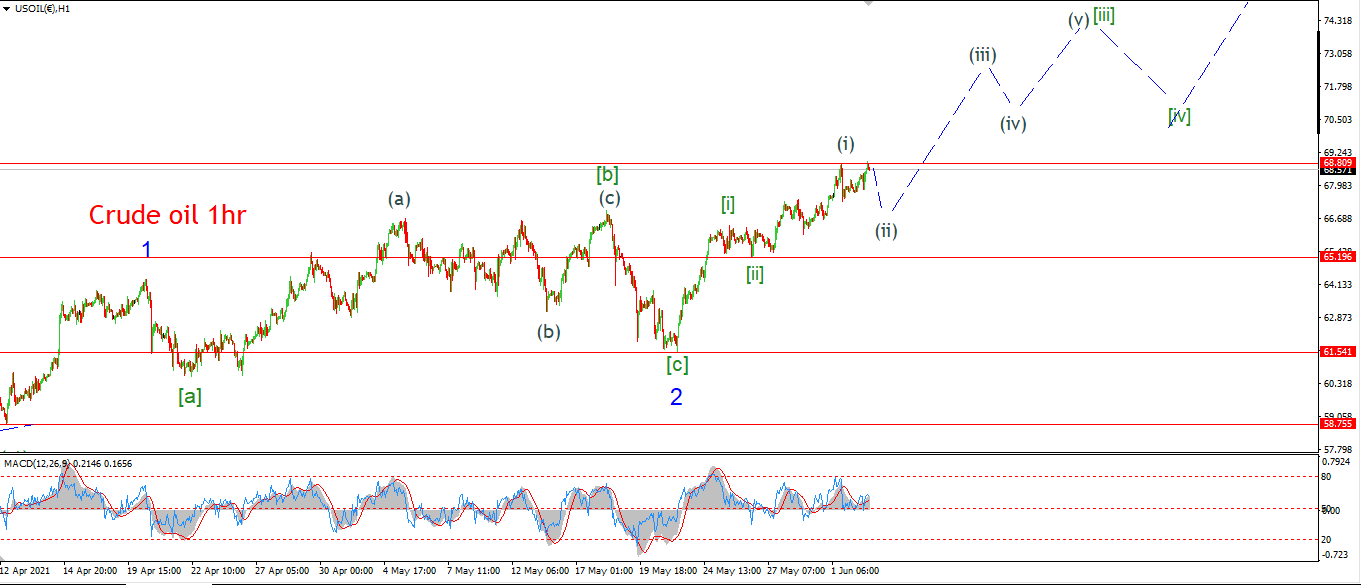
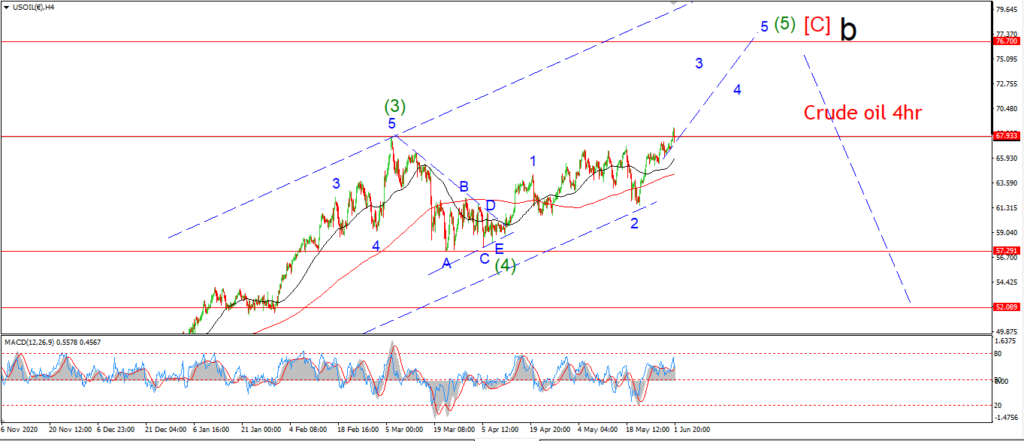
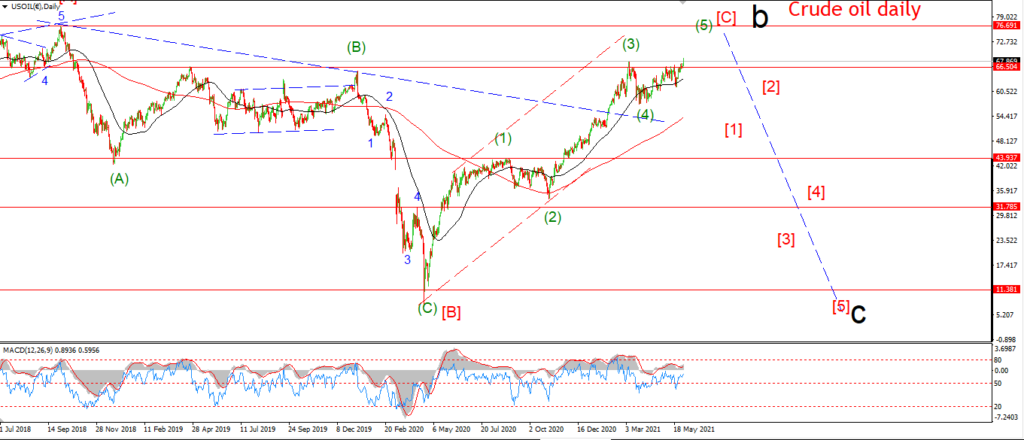
The lack of a reasonable size pull back over the last week has opened up the possibility of a series of 1,2 waves up to begin wave ‘3’ of (5).
I have shown wave (i) of [iii] complete and wave (ii) underway as an expanded flat correction this evening.
Wave (ii) must hold above 65.20 for this count to remain valid.
Wave (ii) should complete by tomorrow evening.
And then the price should turn higher into wave (iii) of [iii] by Friday evening again.
Tomorrow;
Watch for wave (ii) of [iii] to complete above 65.20.
S&P 500.
S&P 500 1hr
S&P 500 4hr
S&P 500 daily.
Much like the Dow,
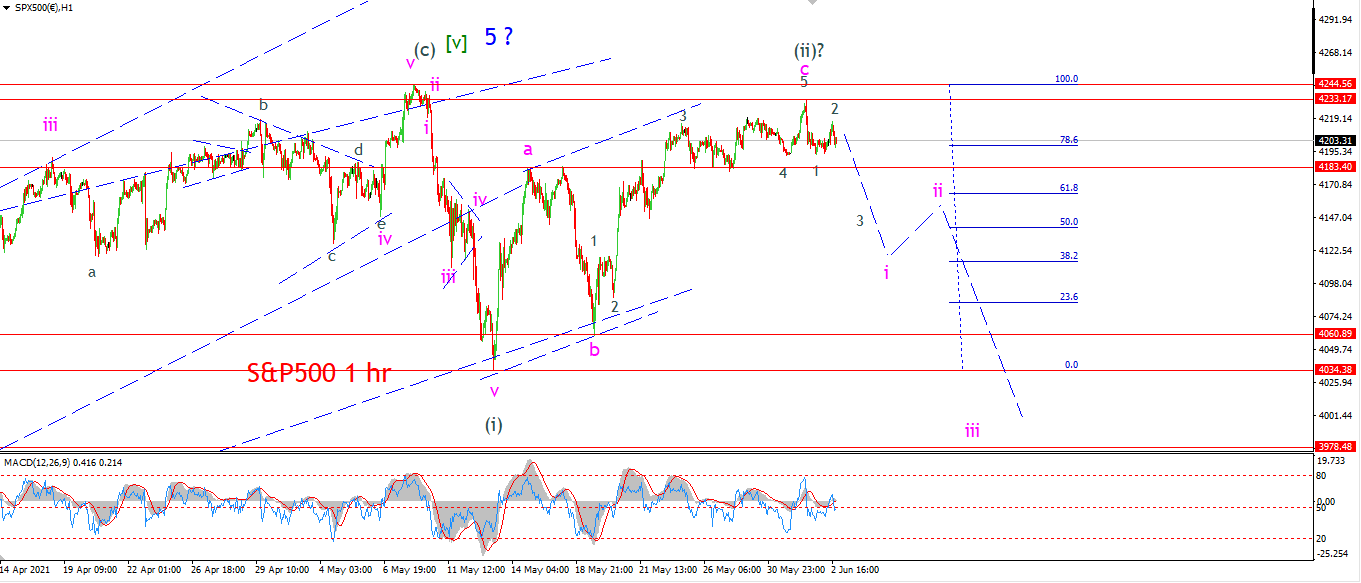
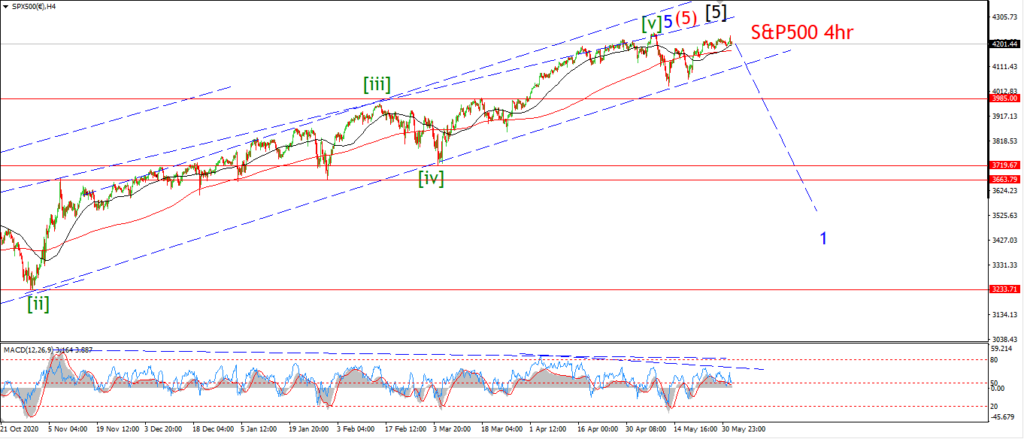
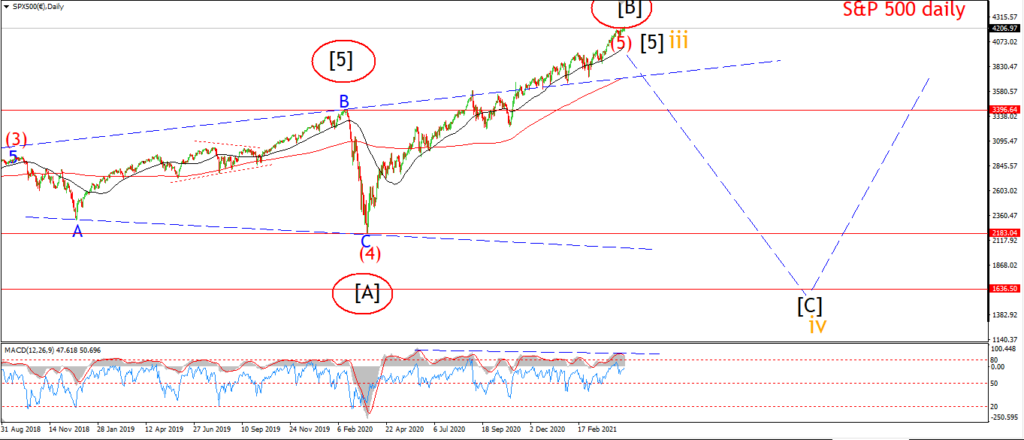
we have the possibility for a impulsive reversal building in the S&P also today.
The price holding below the all time high again today,
and we have a small corrective lower high in wave ‘2’ in the making also.
I would like to see a break of that shoulder of support at 4180 again to signal wave ‘i’ is in play now.
So tomorrows action is critical to proving this wave count correct.
Wave ‘i’ down must continue to build a five wave pattern lower and a break of support to signal that the tide is turning again.
Tomorrow;
4233 must hold and 4183 must break.
SILVER.
SILVER 1hr
SILVER 4hr.
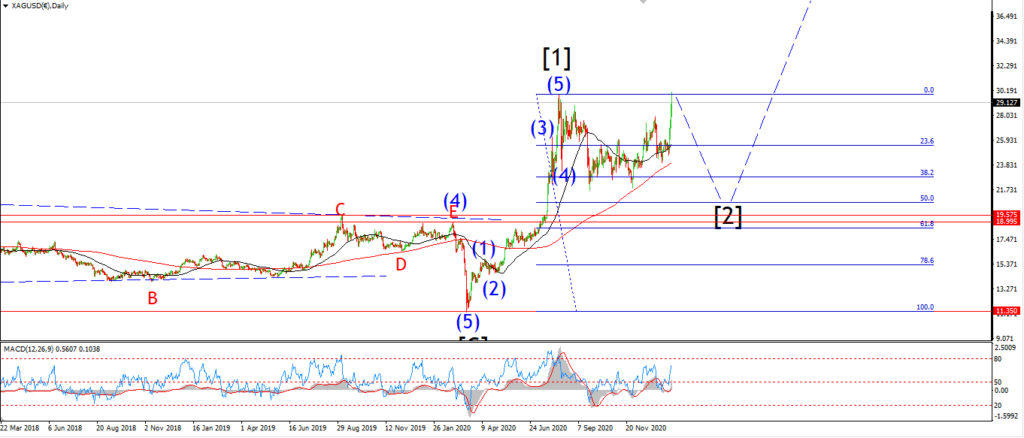
SILVER daily.
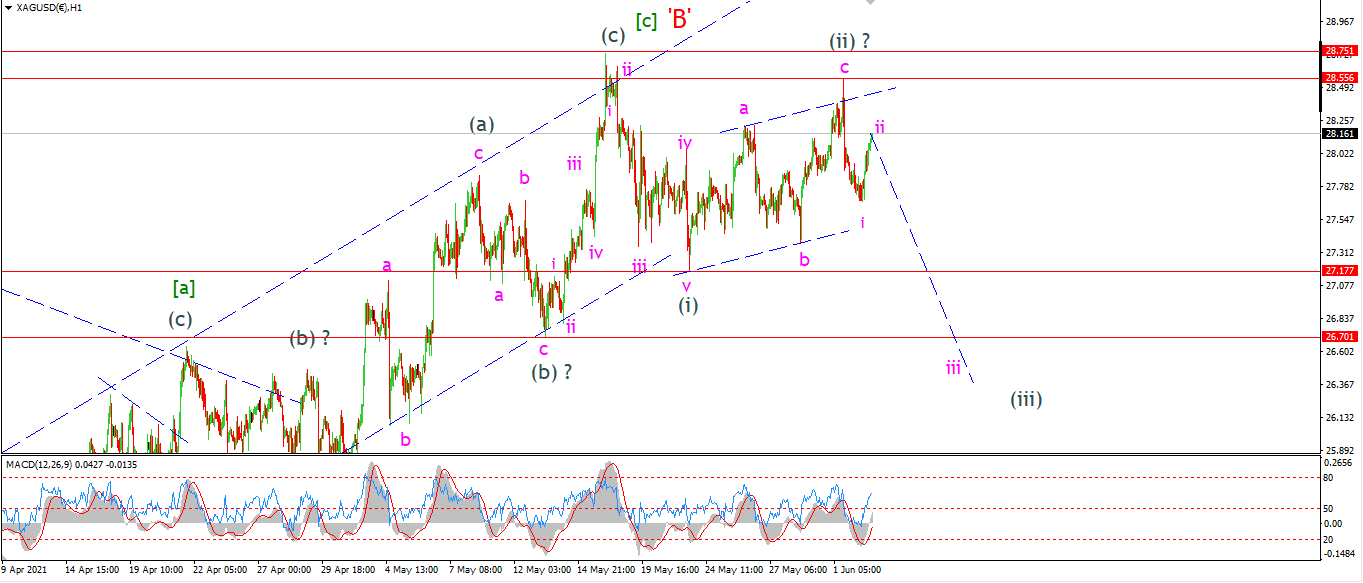
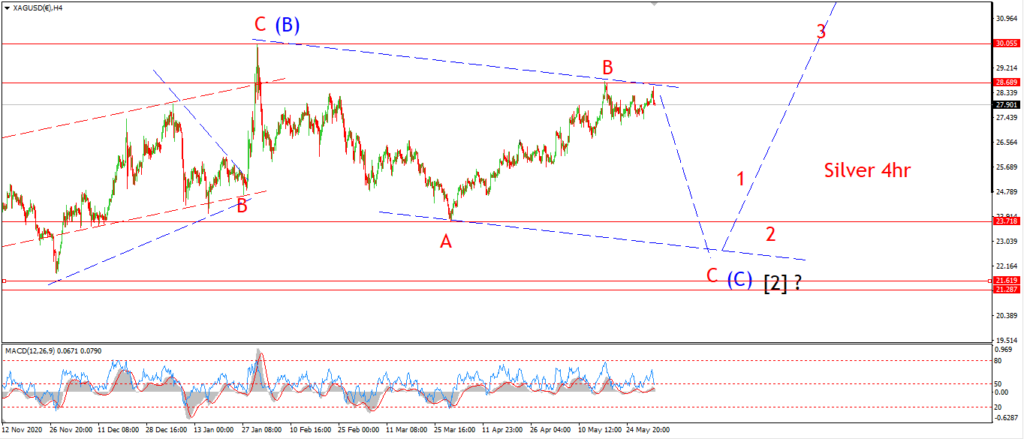
Silver has also put in a reasonable ‘i’ ‘ii’ pattern down with todays lower high.
Wave ‘ii’ could expand into a more complete three wave pattern of course,
but given that the price has already retraced 50% of the wave ‘i’ decline,
it is possible that wave ‘ii’ is already complete at todays high.
In this case we should see declines take over again tomorrow into wave ‘iii’ down.
A break of 27.17 again will confirm wave ‘iii’ of (iii) is underway.
And a break of 26.70 again will confirm the larger wave (iii) is in force.
Tomorrow;
watch for wave (iii) down to begin with a break of 27.17.
28.55 must hold.
BITCOIN
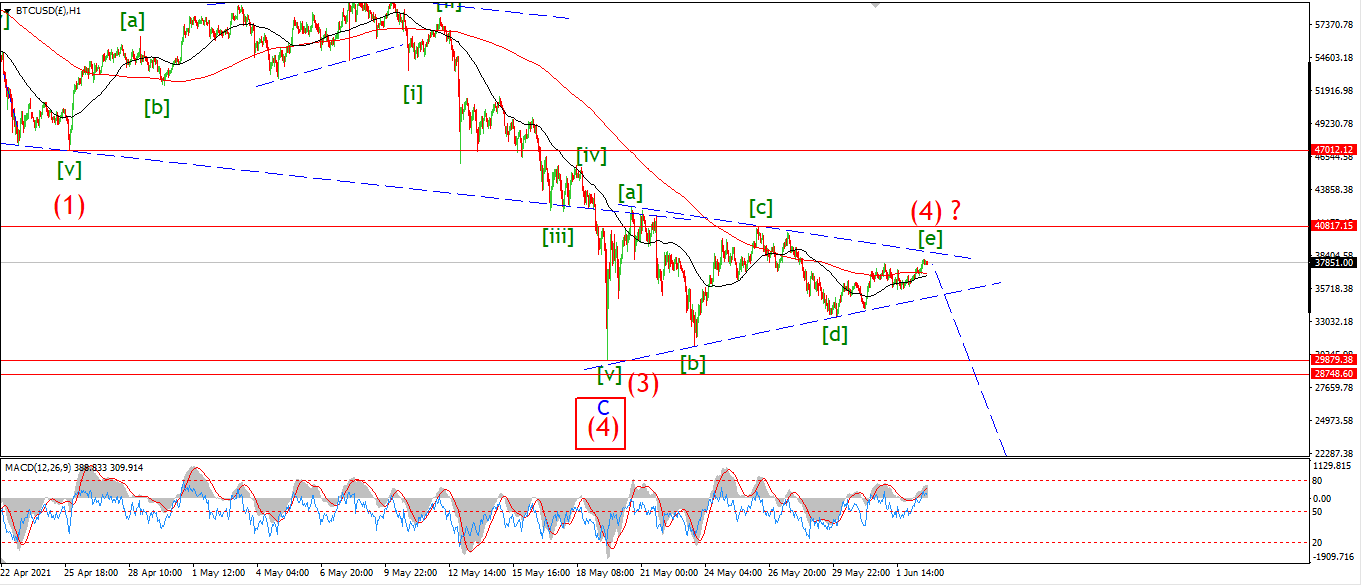
BITCOIN 1hr.
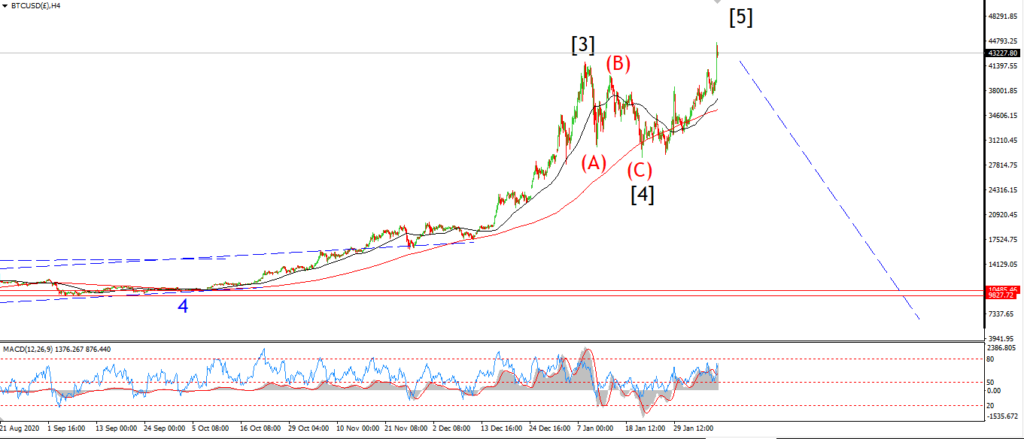
BITCOIN 4hr.
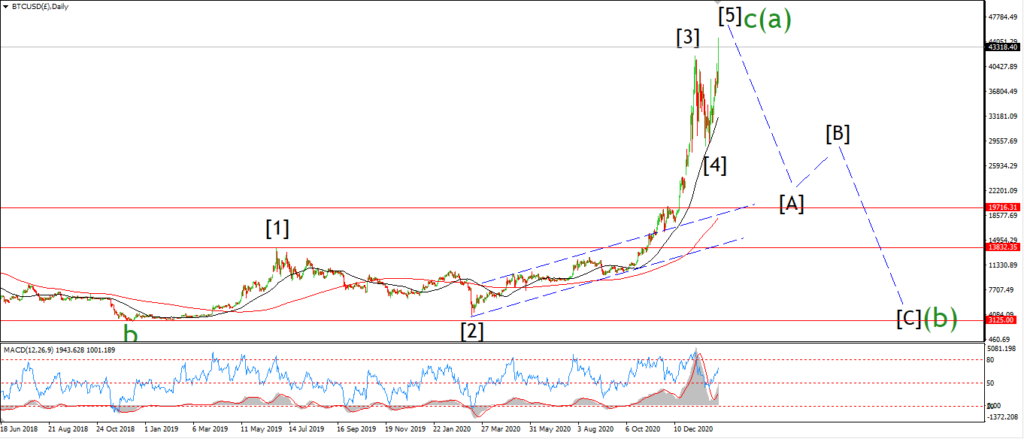
BITCOIN daily.
Topping in wave (a).
FTSE 100.
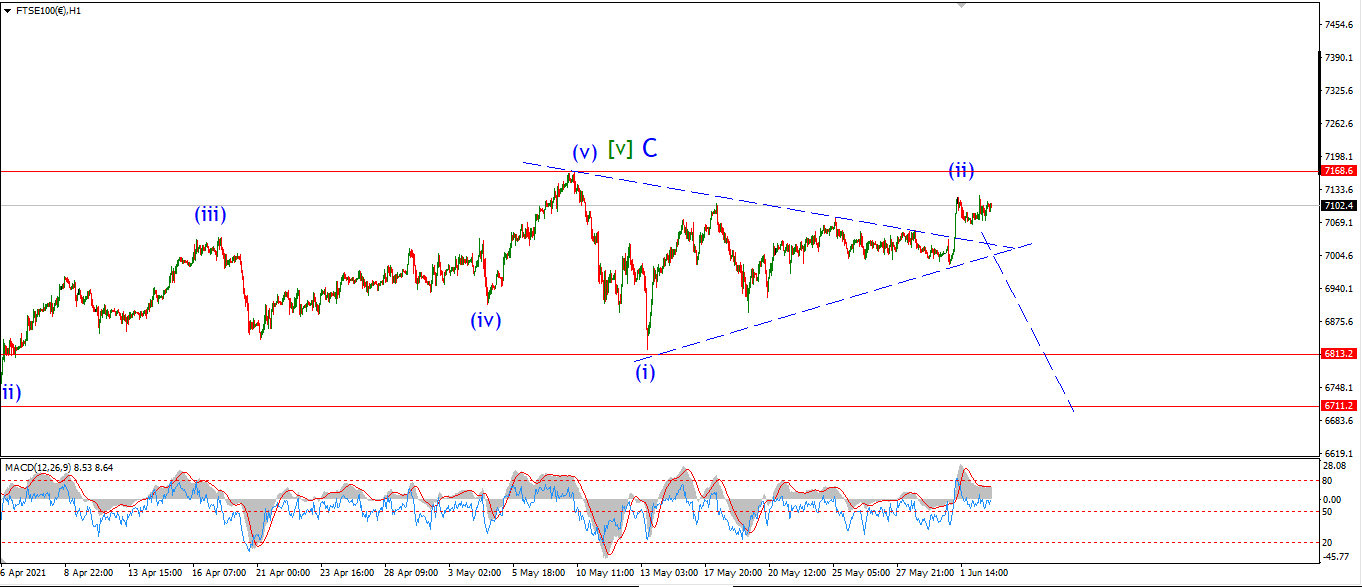
FTSE 100 1hr.
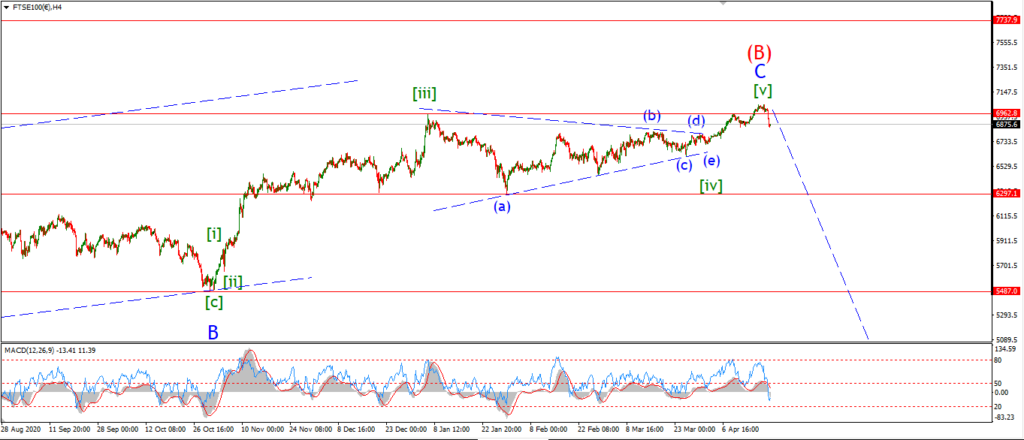
FTSE 100 4hr.

FTSE 100 daily.
Completing a fourth wave.
DAX.
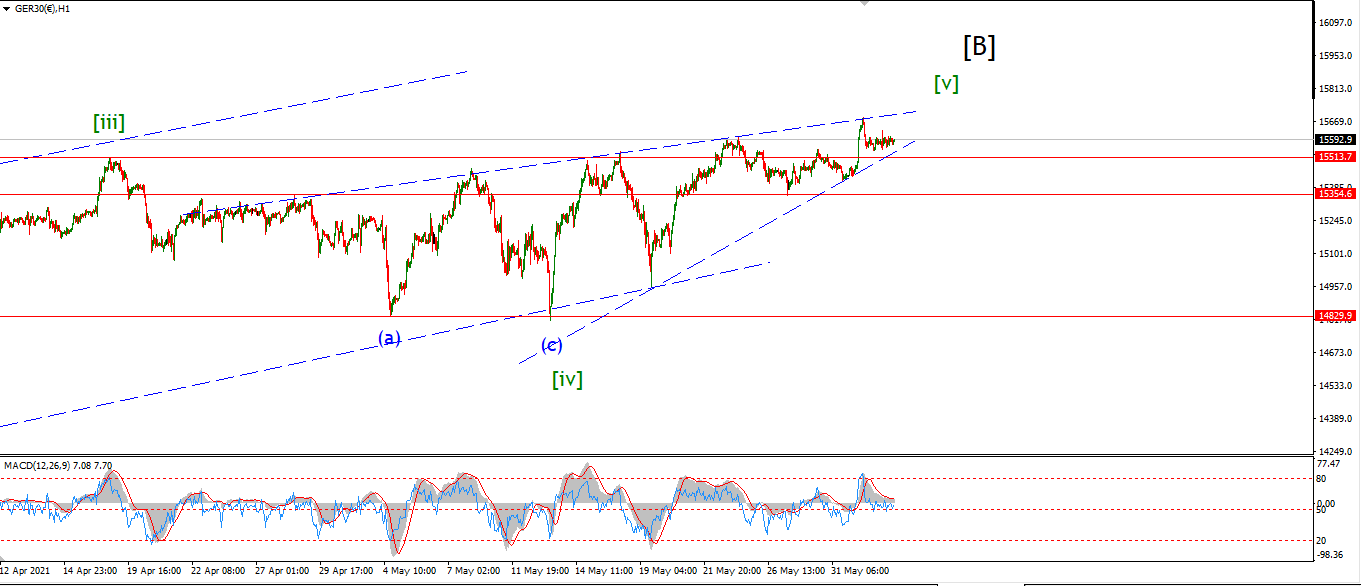
DAX 1hr
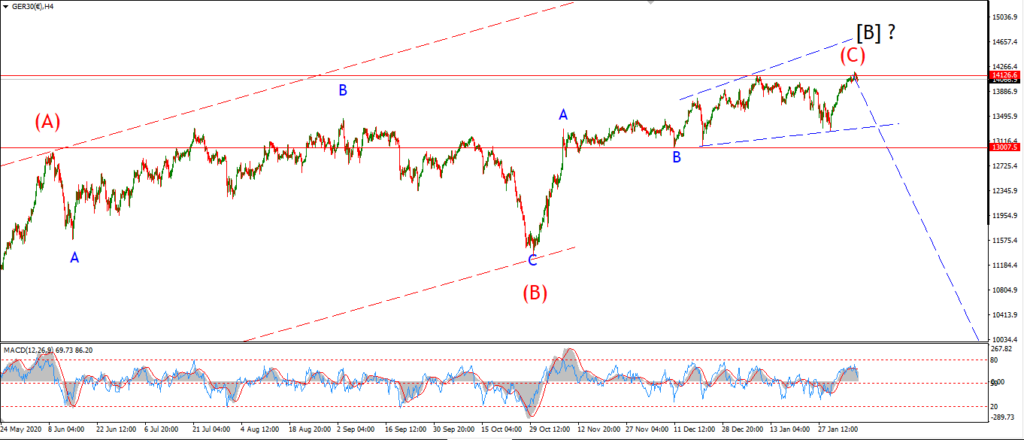
DAX 4hr
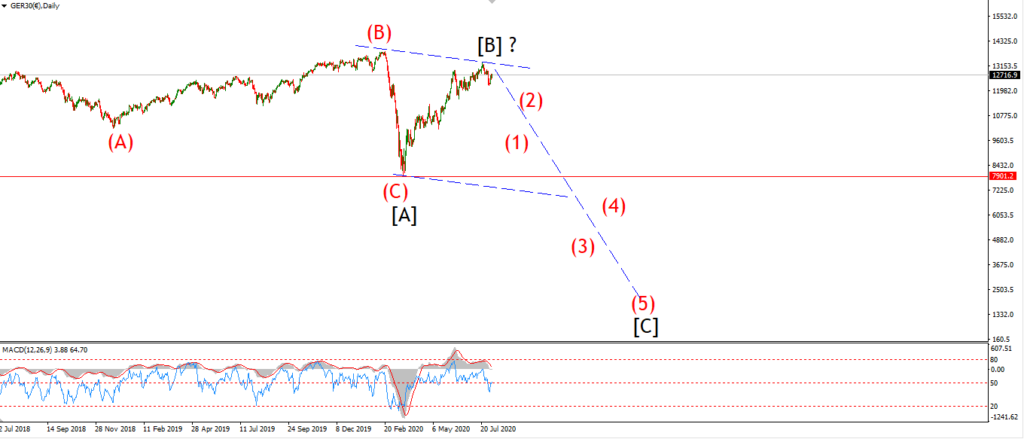
DAX daily.
Topping out in wave [B].
NASDAQ 100.
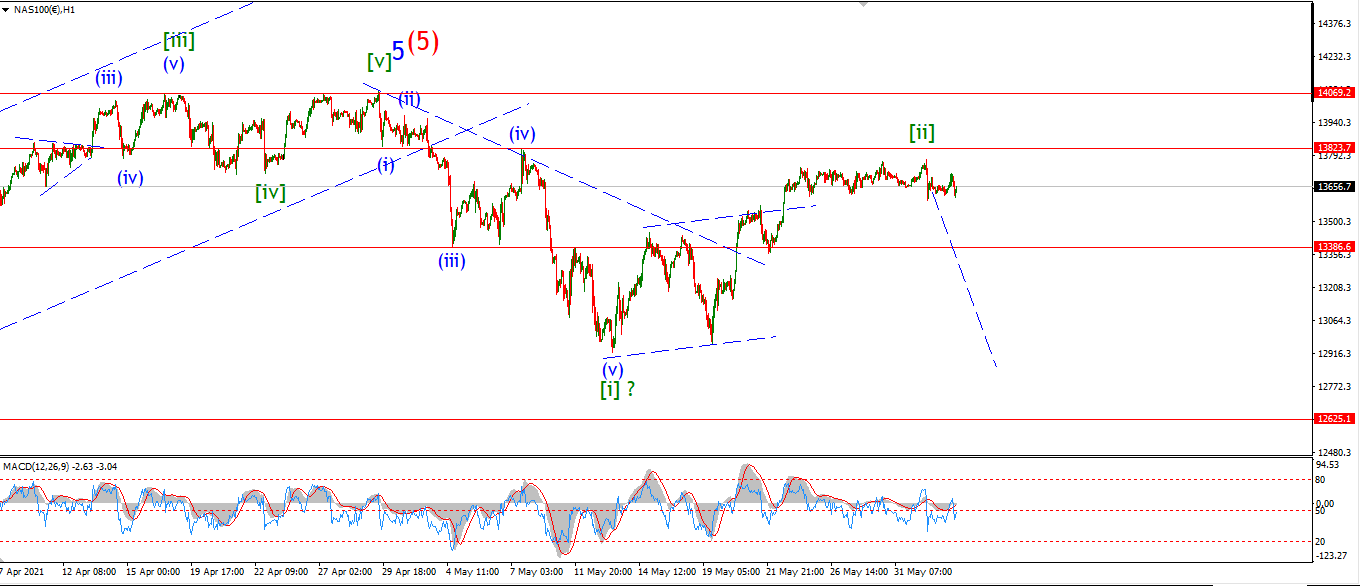
NASDAQ 1hr
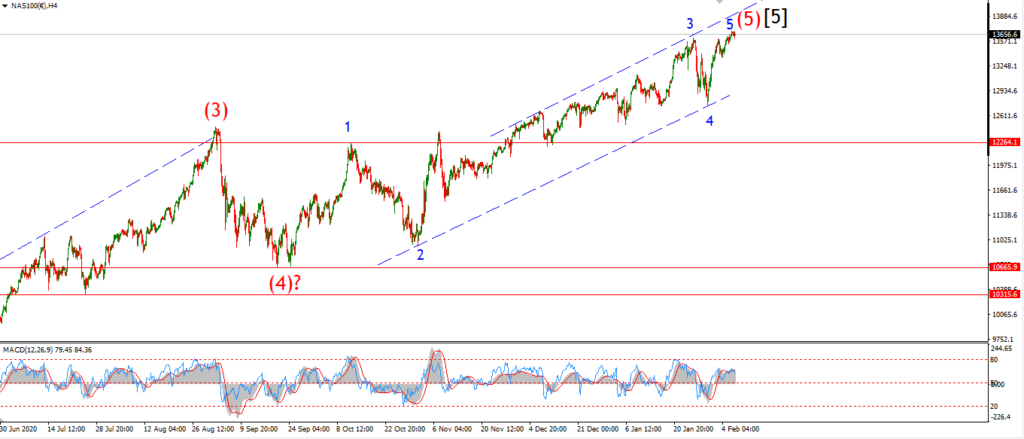
NASDAQ 4hr.
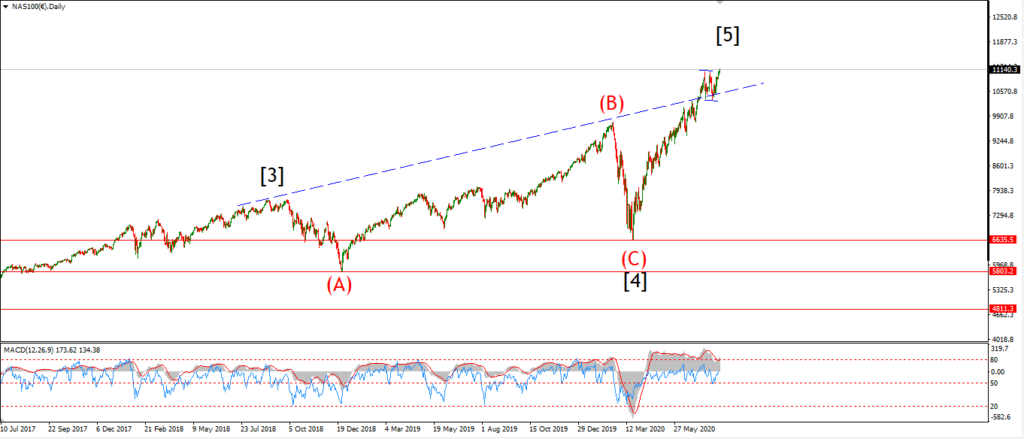
NASDAQ daily.
Topping out at all time high.