
Good evening folks.
Here’s another in the long line of correlations with the 2000 highs in this chart.

EURUSD.
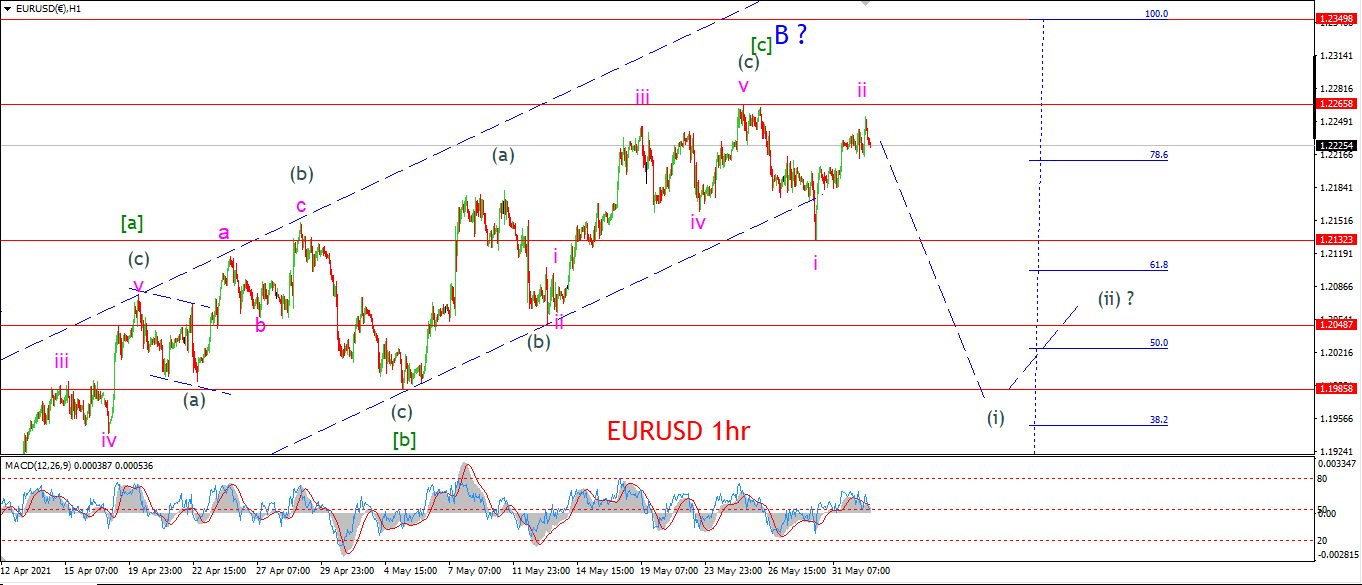
EURUSD 1hr.
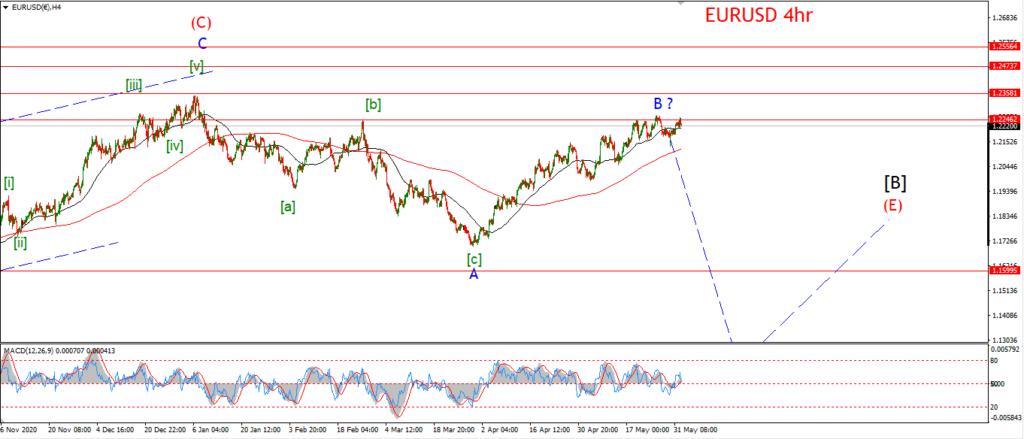
EURUSD 4hr.
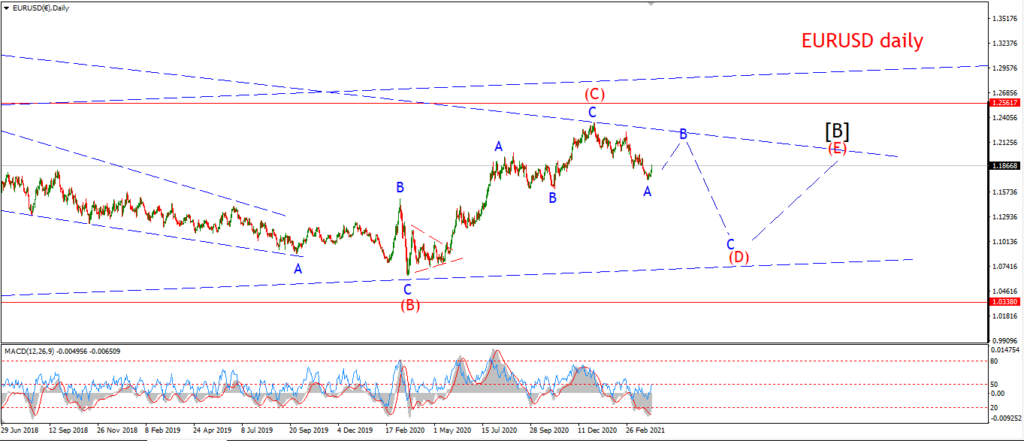
EURUSD daily.
We still have a small lower high in place this evening in a possible wave ‘ii’ pink.
The price is getting close to invalidating this ‘i’ ‘ii’ pattern though,
and if we see a break of 1.2265 again that will force a rethink of the pattern in wave ‘B’.
A break of the high at 1.22675 may even cause me to switch to the alternate count for wave [B] on the daily chart.
In that case wave [B] is a flat correction with a rally into 1.30 possible.
Tomorrow;
If the rally fails below 1.2265 and we see a break of 1.2132,
that will signal wave ‘iii’ of (i) is underway.
So last weeks high is critical here,
1.2265 must hold.
GBPUSD
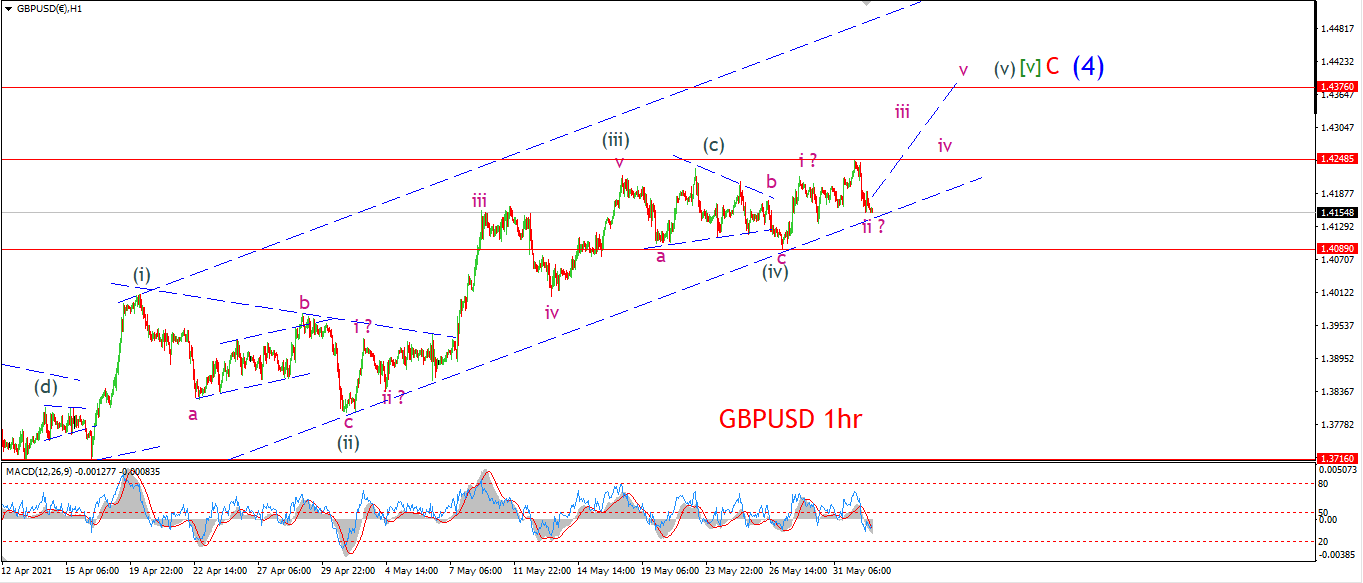
GBPUSD 1hr.
GBPUSD 4hr.
GBPUSD daily.
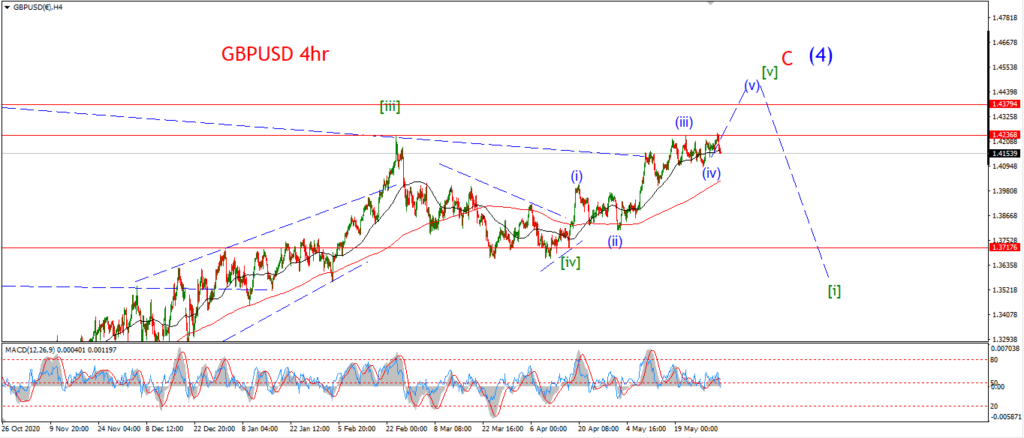
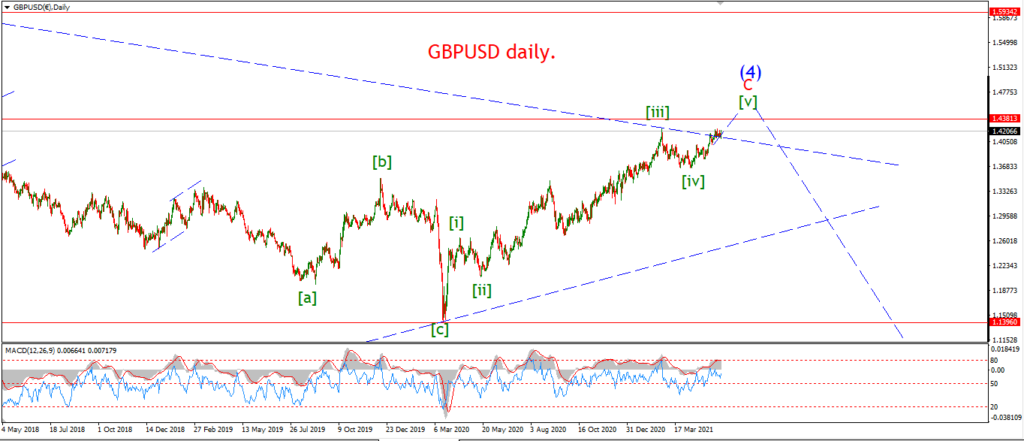
Despite the drop today I still think the price is moving within wave (v) of [v] to the upside.
This small decline is viewed as wave ‘ii’ of (v),
where wave ‘ii’ is tracing out a running flat correction.
Wave ‘iii’ of (v) should begin tomorrow and break above 1.4250 to confirm the short term pattern.
1.4376 remains the initial target for wave (v) to complete this week.
Tomorrow;
Watch for wave ‘ii’ to hold above 1.4090 and then head higher into wave ‘iii’ of (v).
USDJPY.
USDJPY 1hr.
USDJPY 4hr.
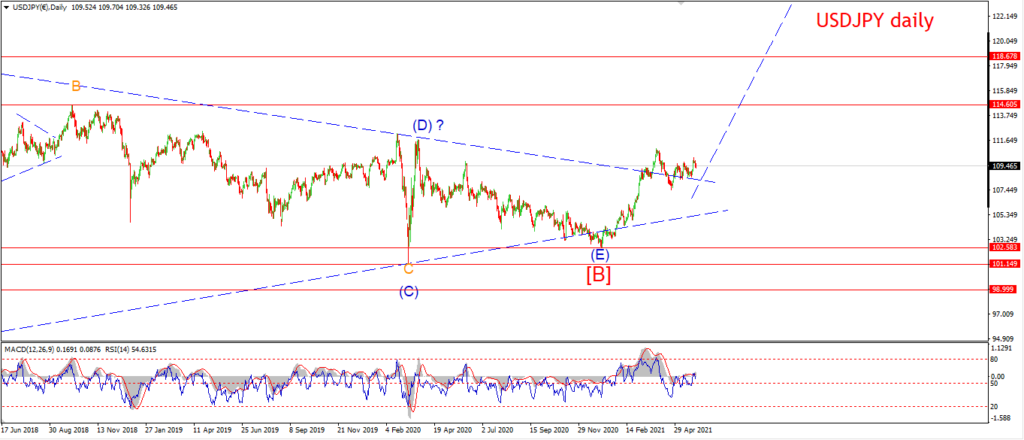
USDJPY daily.
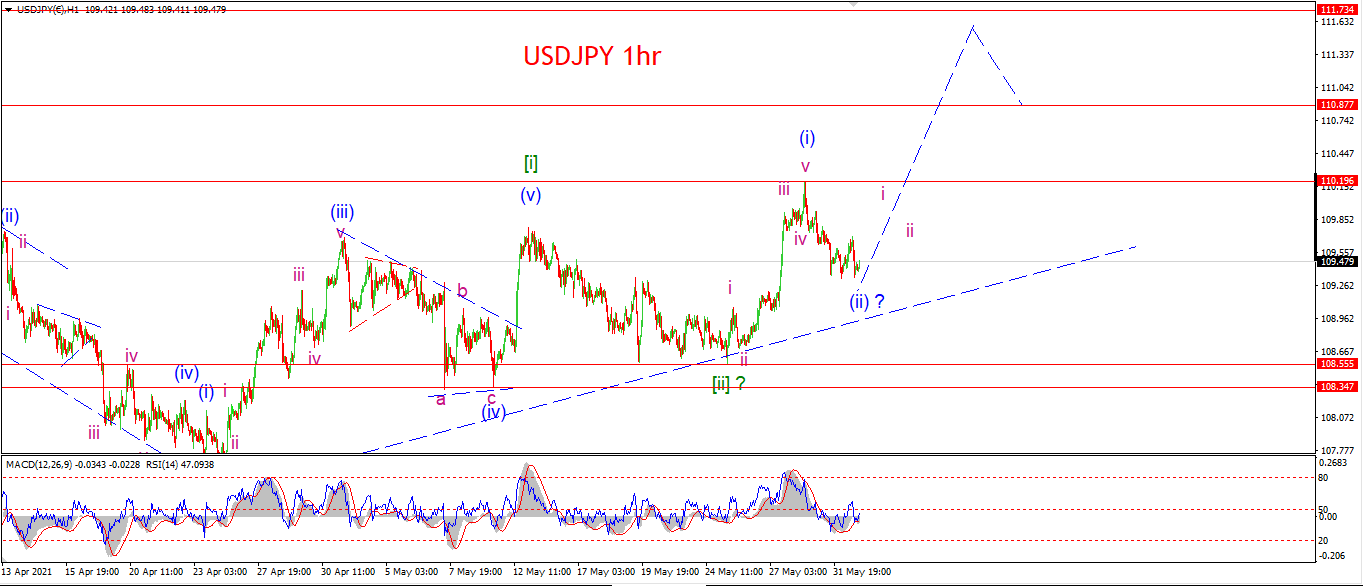
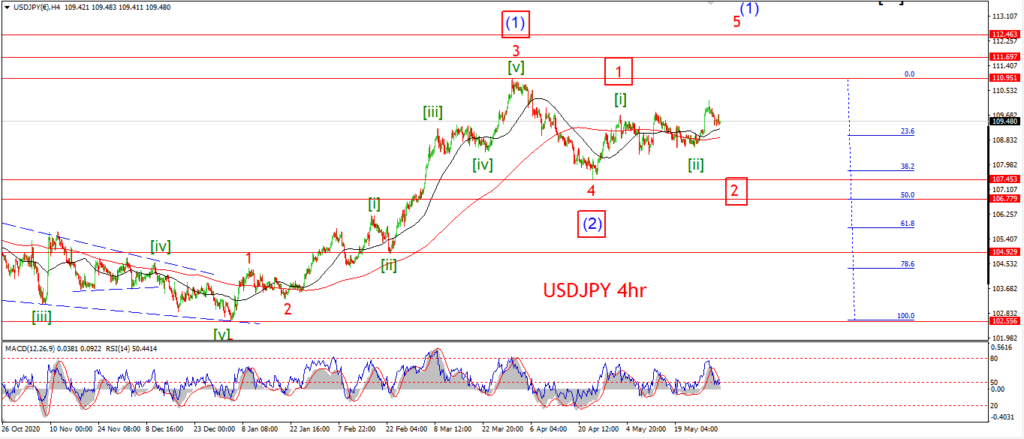
The action over the last few days has created another higher low above the wave [ii] high.
I now view this step higher as wave (ii) of [iii].
And this correction should be complete.
Wave (iii) up is expected this week.
If the price pushes above 110.20 over the coming days that will confirm wave (iii) is underway.
Tomorrow;
Watch for wave ‘i’ of (iii) to push up into the 110.00 handle again.
The price should create a further bullish impulse wave higher in waves ‘i’ and ‘ii’ to begin wave (iii) by Thursday evening at the latest.
DOW JONES.
DOW 1hr.
DOW 4hr
DOW daily.
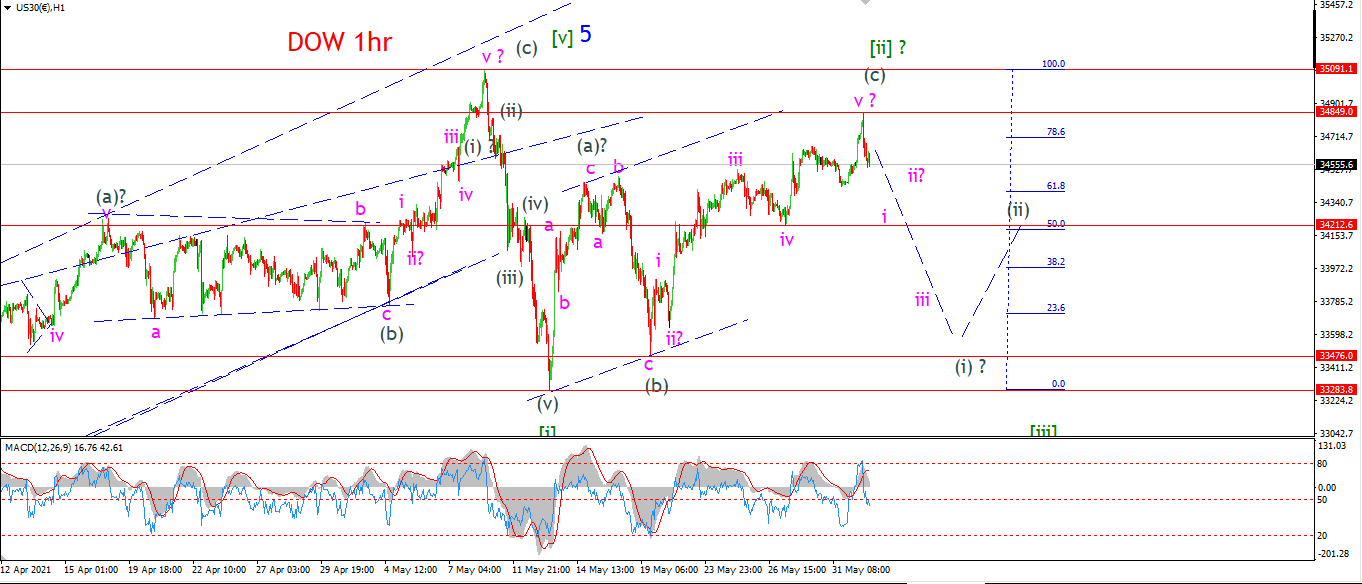
The DOW popped higher in the futures and then opened up before reversing off the high again throughout the day.
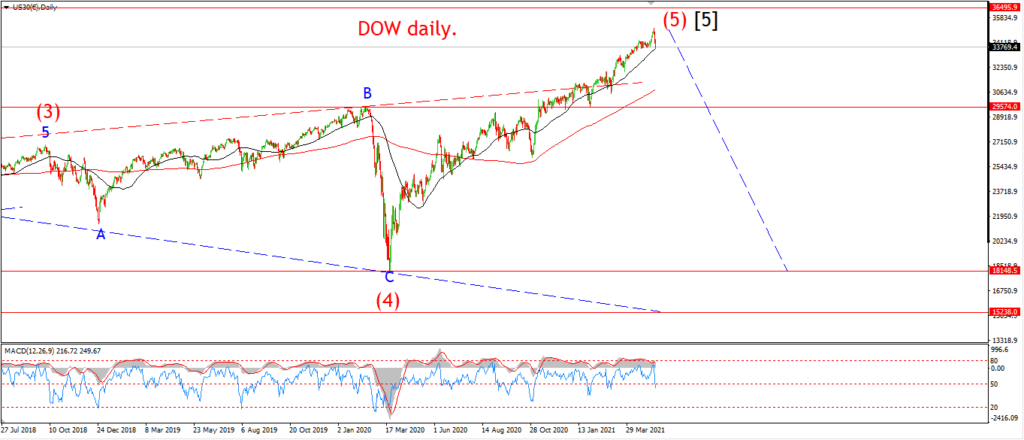
Todays high is dangerously close to that all time high again!
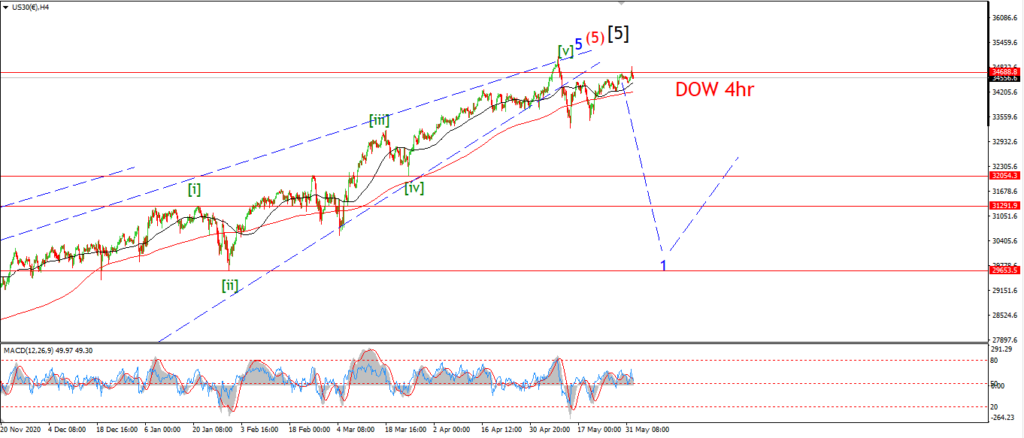
While I do prefer the look of the short term pattern as a bearish impulse wave lower.
I can’t deny the possibility that the market will breach that upper limit above 35000 again.
Give the fact that we have seen another spike lower today,
the balance of probabilities still favors the idea that this is a three wave correction to the upside.
And this pattern will be resolved to the downside again in wave [iii].
Tomorrow;
Todays high printed 34849,
watch for this level to hold now as wave (i) of [iii] develops in five waves to the downside.
GOLD
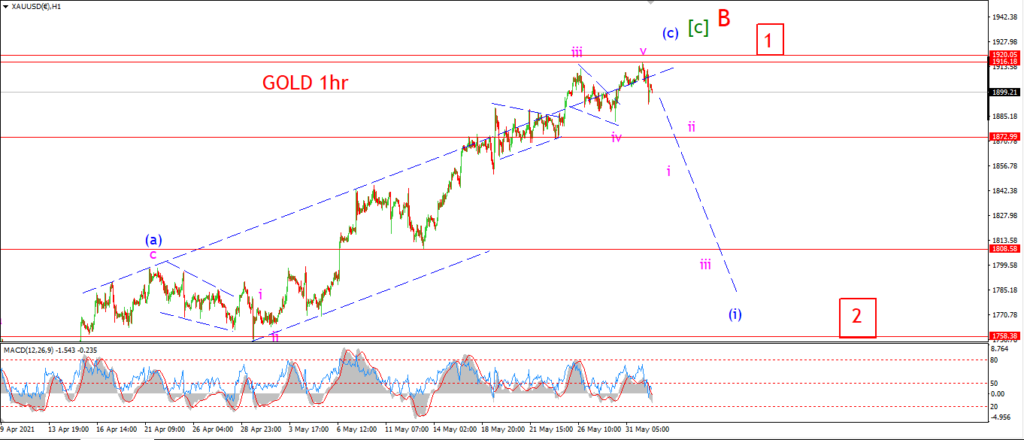
GOLD 1hr.
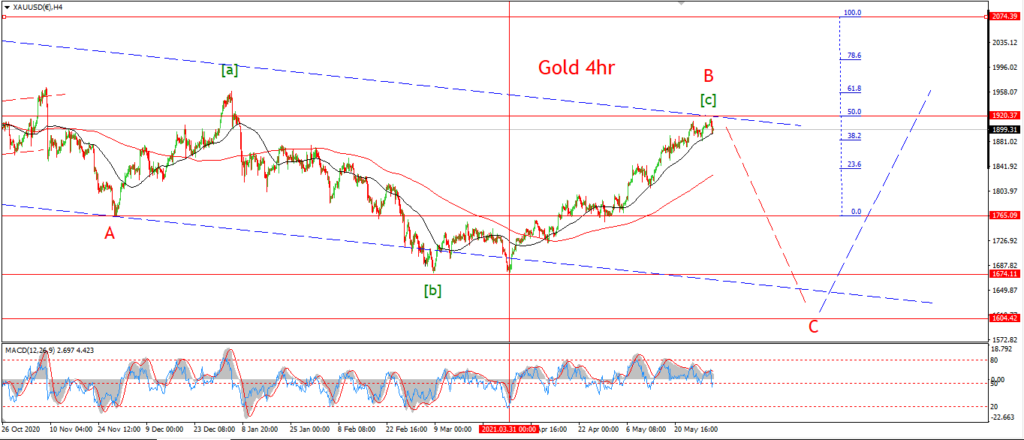
GOLD 4hr.
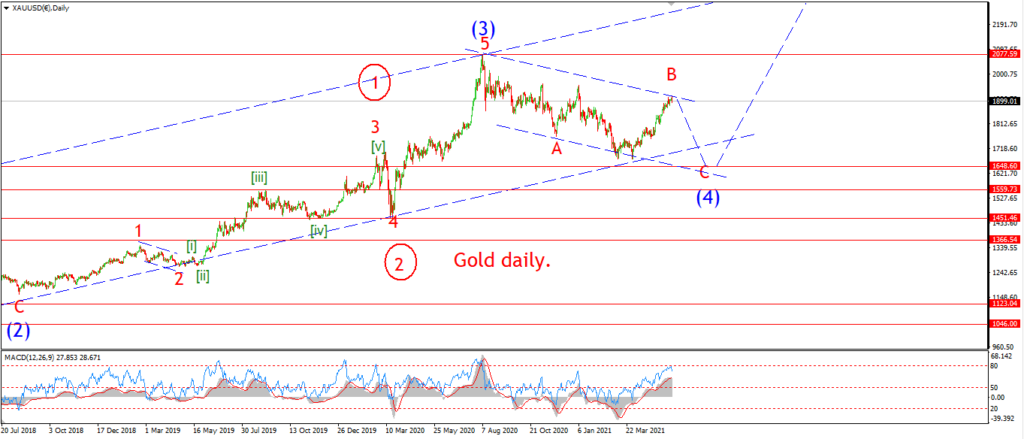
GOLD daily.
On the 4hr chart I have shown another interpretation of the correction in wave (4) blue.
This involves a three wave decline in wave ‘A’,
a running flat correction in wave ‘B’ now completing,
and this pattern suggests a five wave decline into wave ‘C’ coming our way soon.
And the minimum target for wave ‘C’ lies at 1674 at the most recent low.
I will note that todays highs at 1916 came in just below the 50% retracement level of the wave ‘A’ decline.
There is already a significant momentum divergence in place in the 4hr chart.
If wave ‘C’ is now about to get underway,
then we should see a five wave decline off these highs begin this week.
Tomorrow;
Watch for 1916 to hold and wave ‘i’ of (i) down to fall below 1870 to begin the larger pattern.
CRUDE OIL.
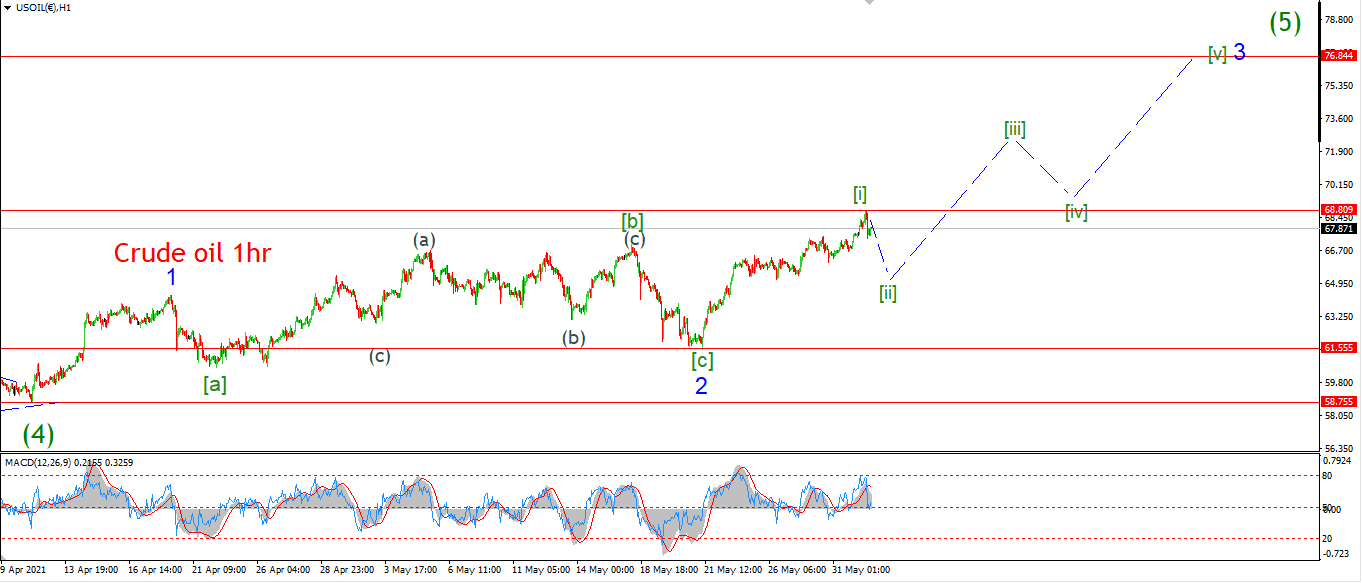
CRUDE OIL 1hr.
CRUDE OIL 4hr.
CRUDE OIL daily.
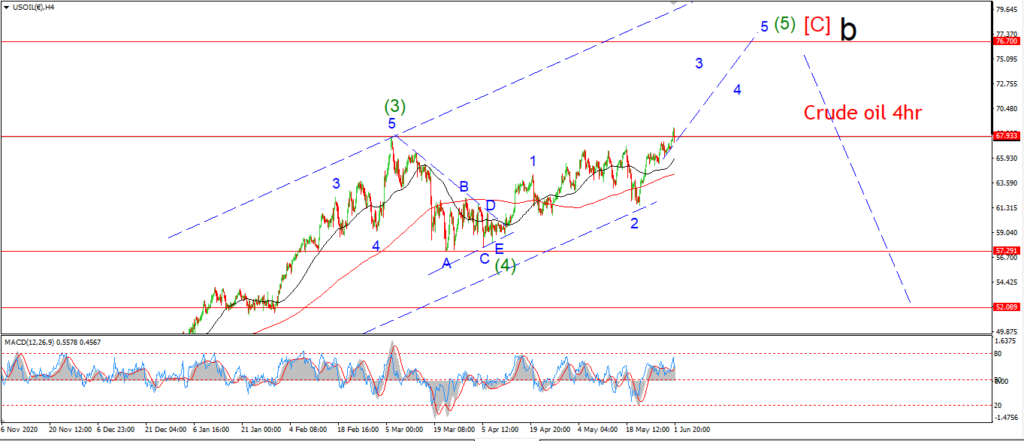
Ok, this crude oil rally is breaking records and causing havoc to my previous wave counts.
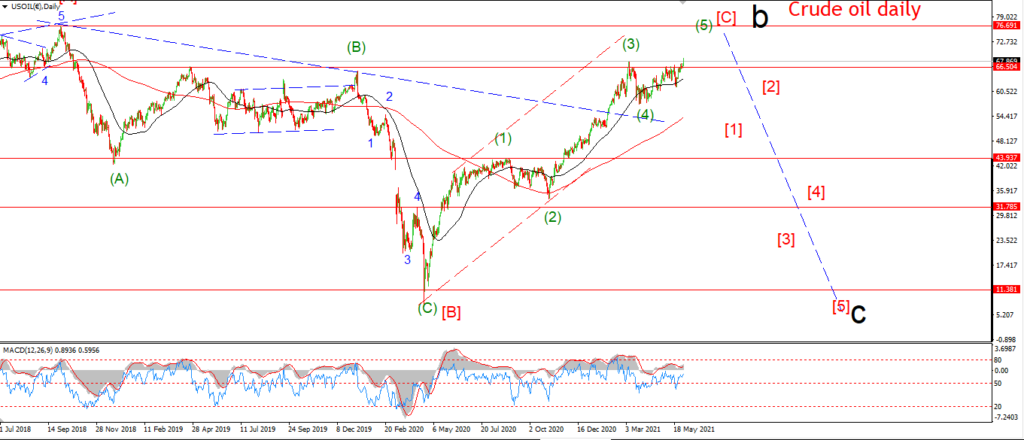
Todays break has cause a complete rethink of the overall patterns from the weekly chart all the wave down.
starting on the weekly;
I am now looking at wave ‘b’ as a larger expanded flat with wave [C] now underway.
Last years decline into negative prices on the forward contract is viewed as wave [B] of ‘b’.
And as such,
this level does not have to be breached again in the next leg down.
Wave ‘c’ down will begin once we have five waves up complete in wave ‘b’.
Daily chart;
I am tracking a five wave rally in wave ‘b’,
with the possibility that wave (5) of [C] is now underway.
Wave (5) of [C] should break above the wave [A] high at 76.70 to complete.
4hr chart;
The correction in wave (4) can be viewed as a triangle.
And wave (5) is now underway off that low.
Todays rally is viewed as wave ‘3’ of (5).
1hr chart;
If weave ‘3’ of (5) is underway now,
then we should see an impulse pattern complete this week in wave [i] and [ii] of ‘3’.
Wave [iii] of ‘3’ of (5) will likely push into that target level at 76.84.
S&P 500.
S&P 500 1hr
S&P 500 4hr
S&P 500 daily.
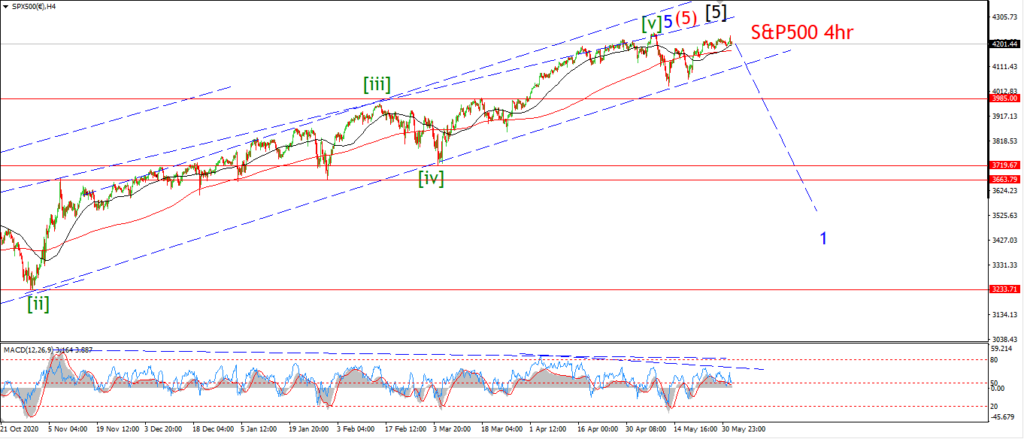
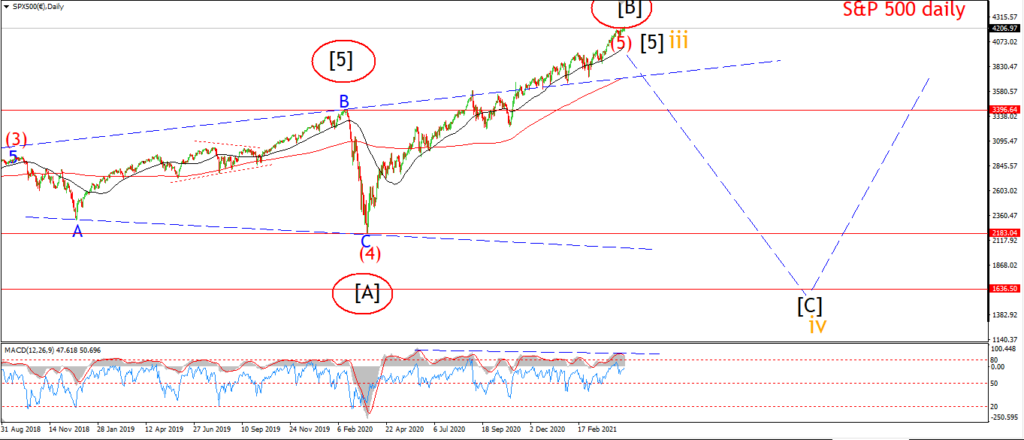
Another day and another attempt to a new all time high.
That rally failed again.
So now we need to see this decline develop into another impulsive move lower to begin wave (iii) down.
Despite todays spike rally,
the market is basically flat for the last week.
If the price does fail to break out to a new all time high this week,
then the market will be in extreme danger of an serious acceleration lower into wave (iii) down.
I will need some evidence of a decline into wave (iii) tomorrow for sure.
The longer we hang near to the highs,
the more likely we will break out to a new high.
The impulsive pattern lower is still intact,
but the confirmation move needs to happen now in order to stick with this view.
Tomorrow;
Watch for wave ‘i’ of (iii) down to begin with a break below that 4180 pivot level.
This marks the high of wave ‘a’ and also support for the sideways track over the last week.
SILVER.
SILVER 1hr
SILVER 4hr.
SILVER daily.
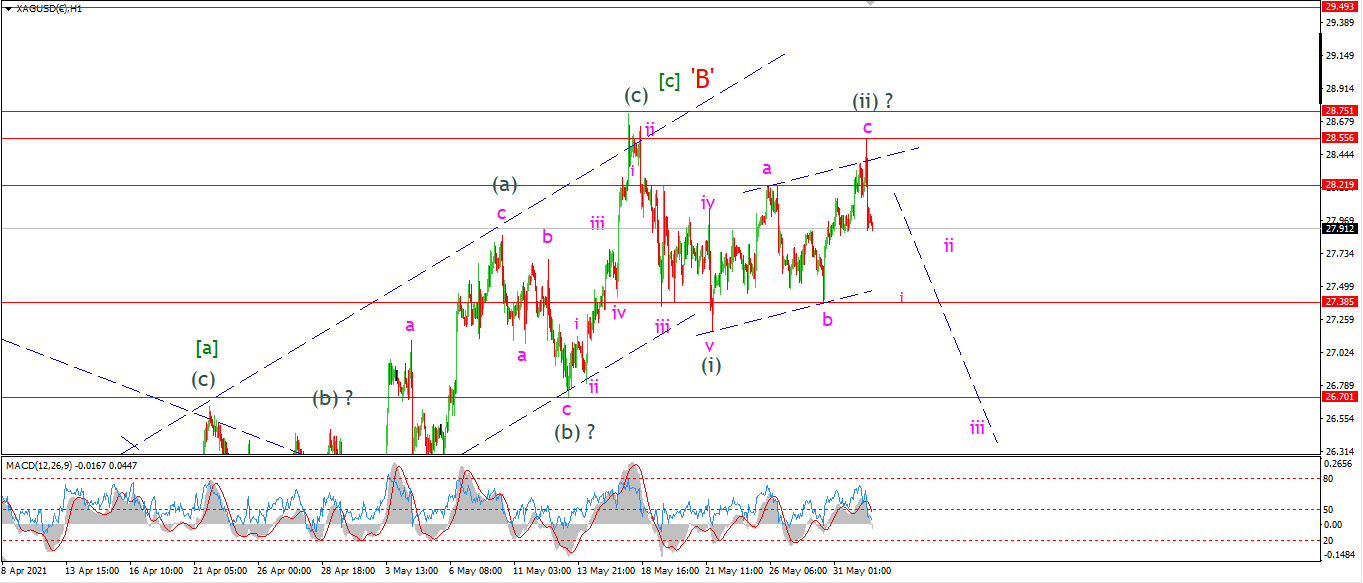
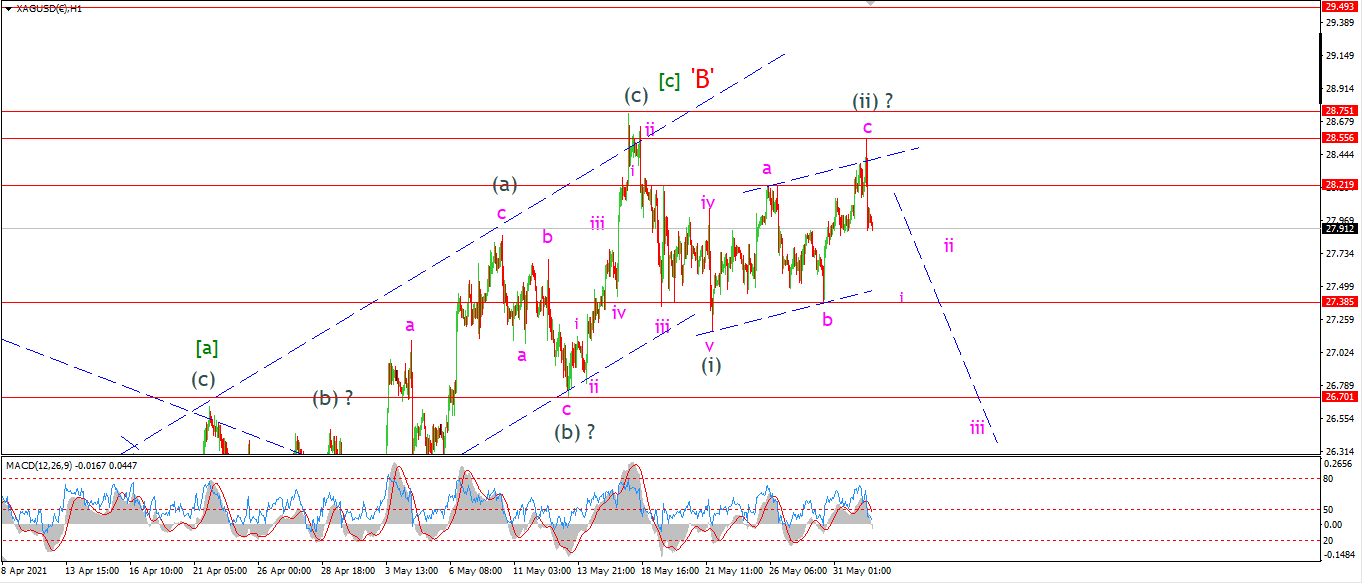
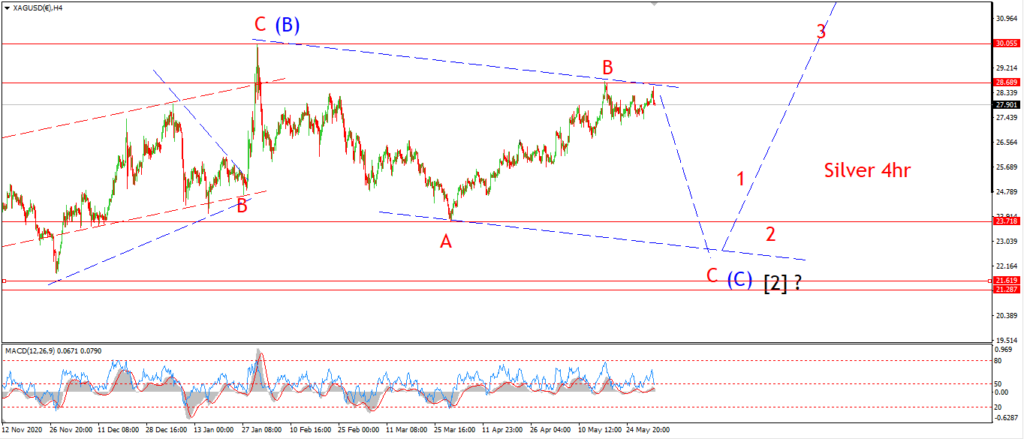
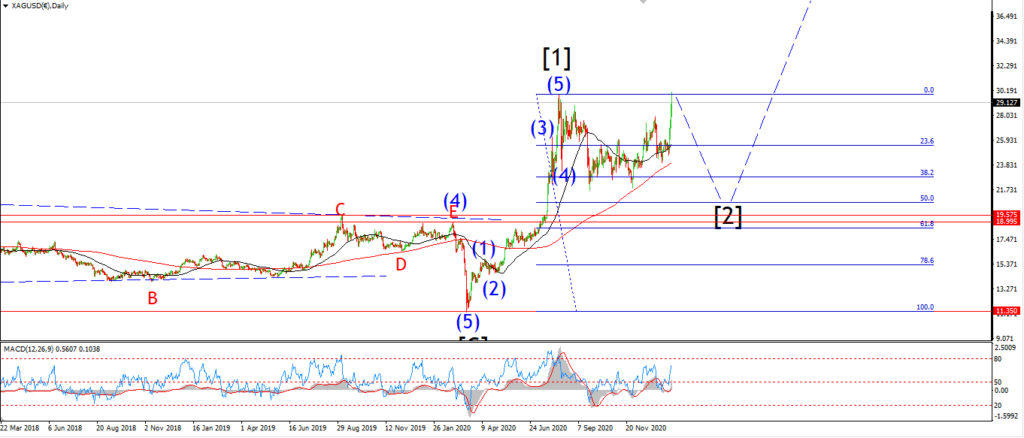
The pattern off the high in silver is not ideal.
But the price has traced out a three wave move to a lower high over the last few sessions.
The price rallied into the upper trend line of that channel today,
and then fell sharply back below 28.00 again.
If this is wave ‘i’ of (iii) now underway,
then we will see a downside follow through this week in wave (iii).
Tomorrow;
Watch for the high at wave (ii) to hold at 28.55 and then wave ‘i’ of (iii) to fall into 27.33 at the wave ‘b’ low.
BITCOIN
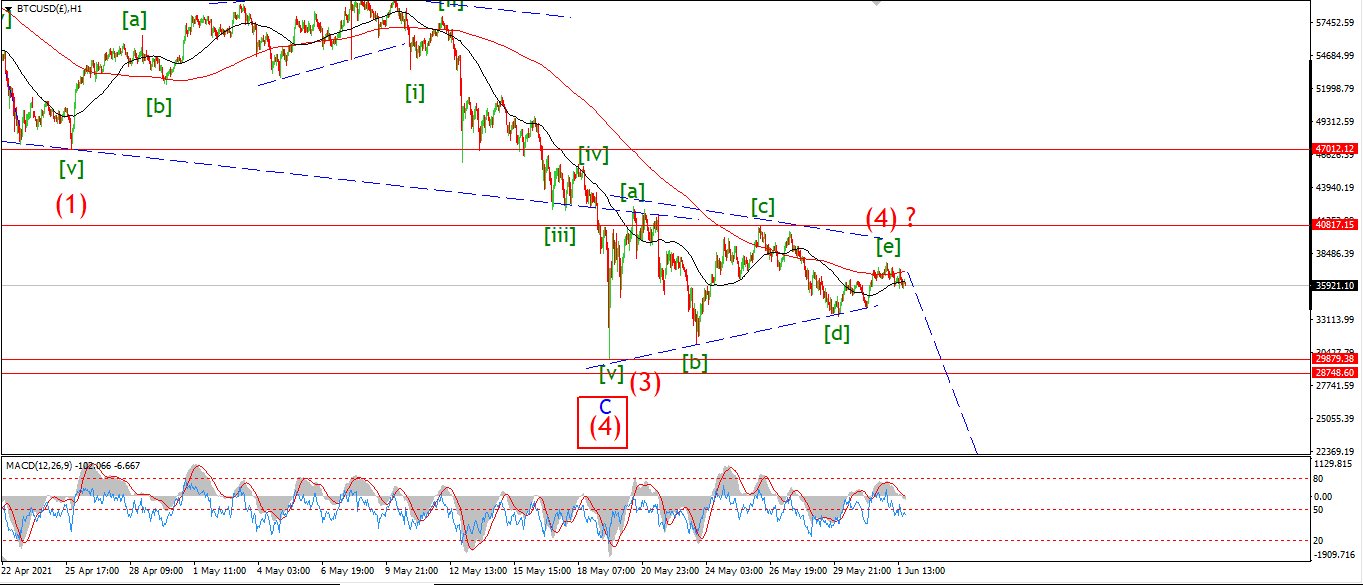
BITCOIN 1hr.
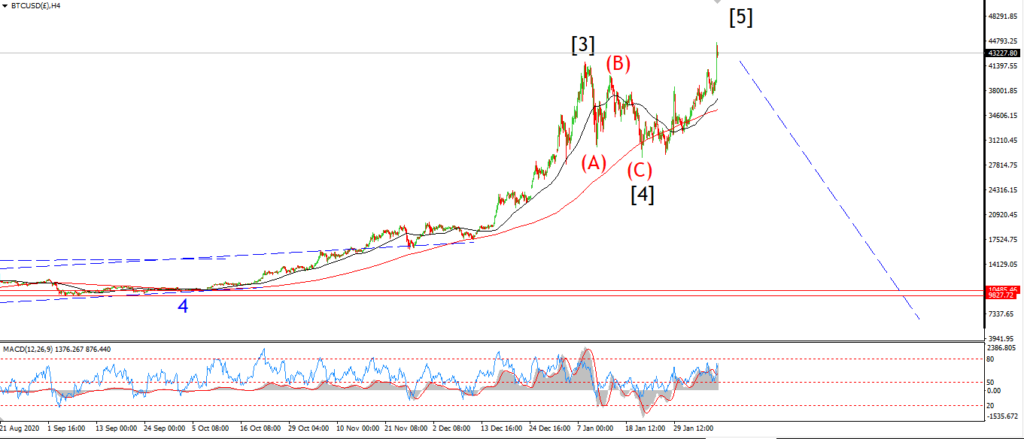
BITCOIN 4hr.
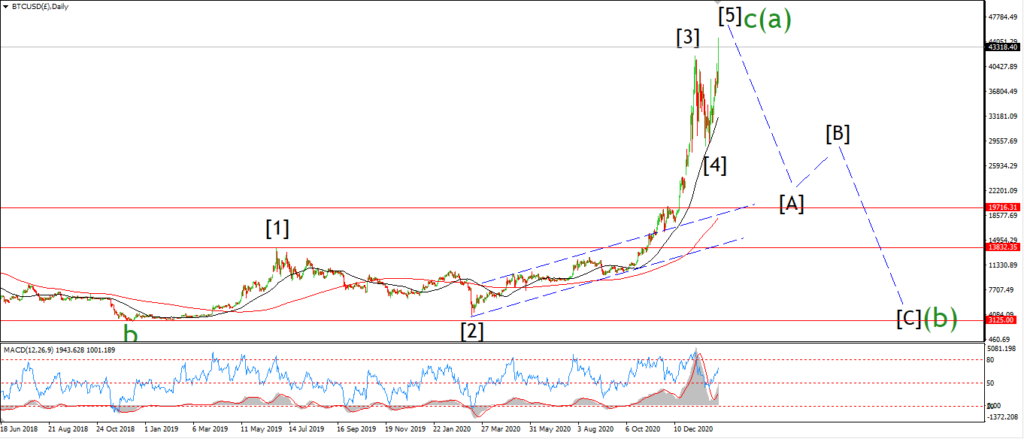
BITCOIN daily.
Topping in wave (a).
FTSE 100.
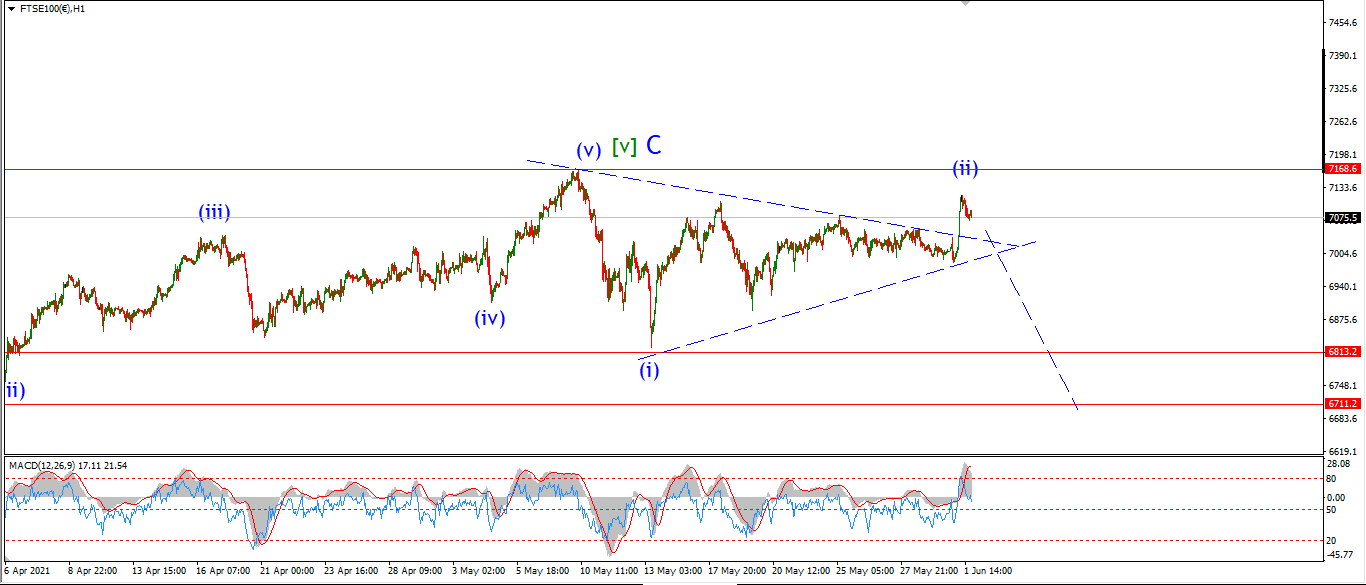
FTSE 100 1hr.
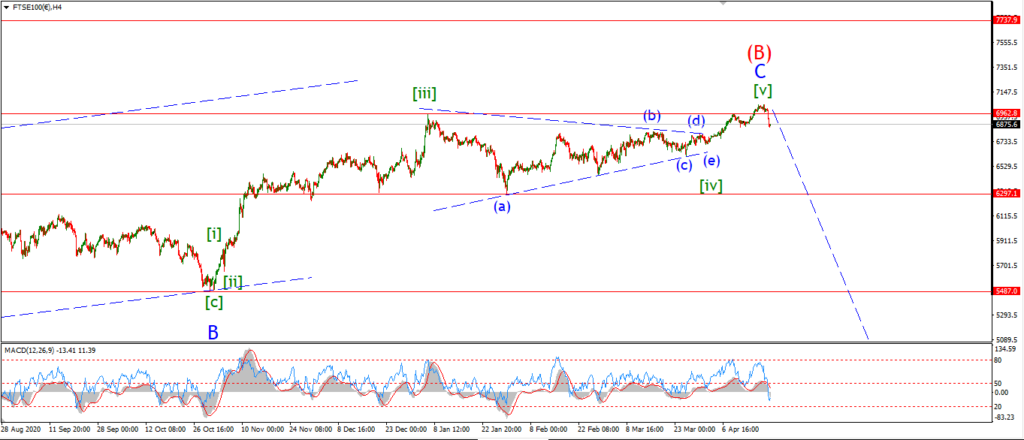
FTSE 100 4hr.

FTSE 100 daily.
Completing a fourth wave.
DAX.
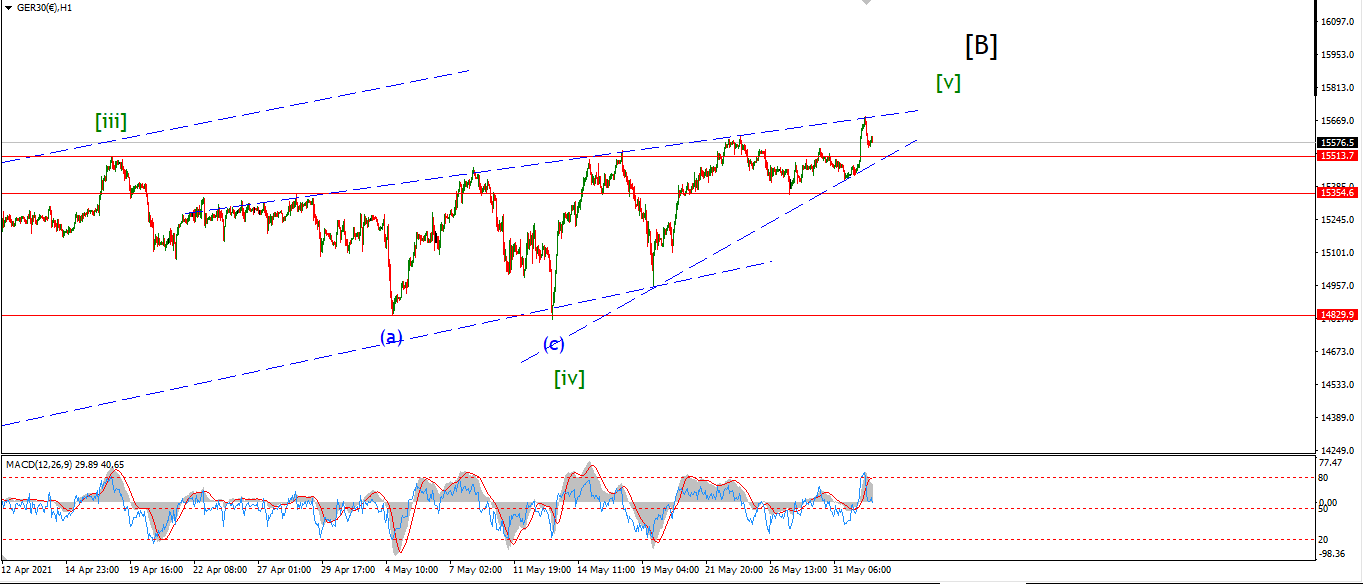
DAX 1hr
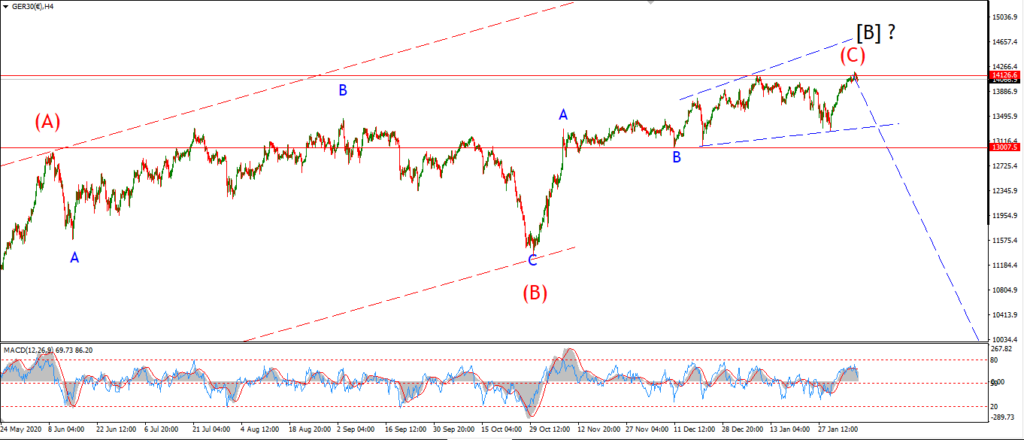
DAX 4hr
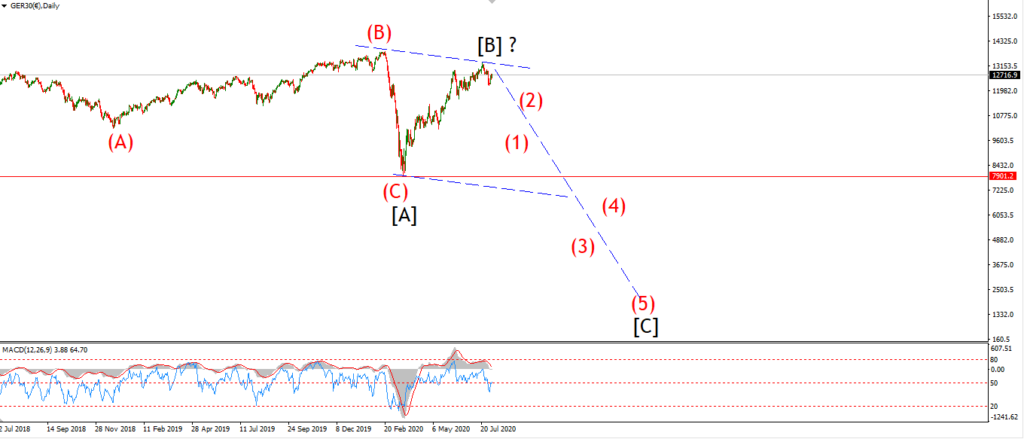
DAX daily.
Topping out in wave [B].
NASDAQ 100.
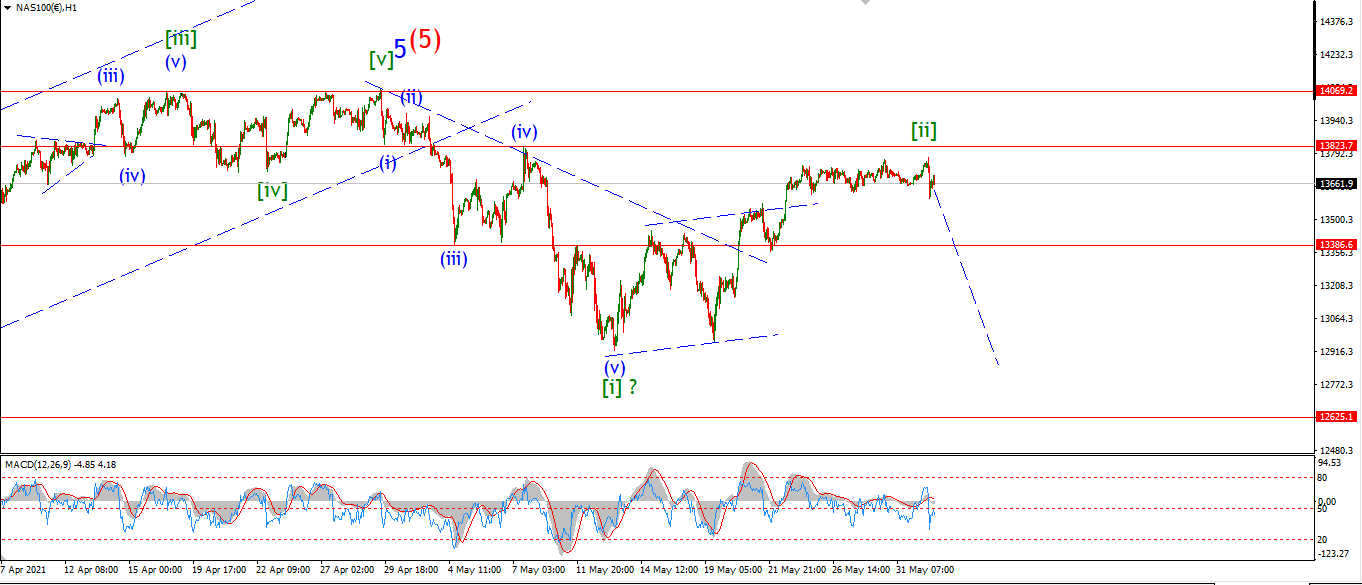
NASDAQ 1hr
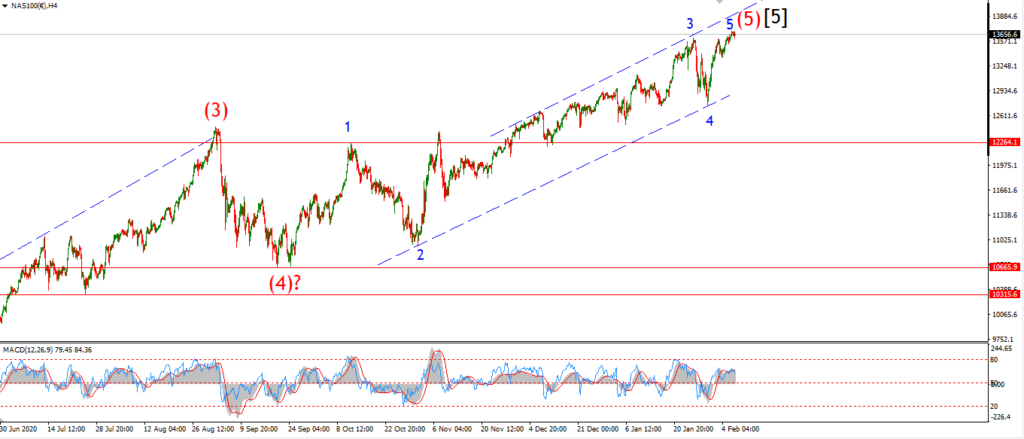
NASDAQ 4hr.
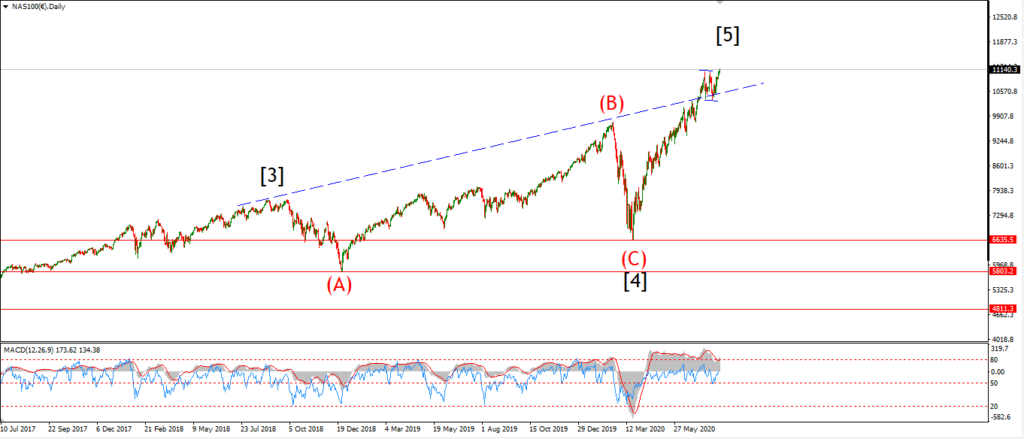
NASDAQ daily.
Topping out at all time high.