
Good evening to one and all.
I was reading John hussmans latest update this weekend, it is a real juicy and comprehensive missive that you can find HERE.
His conclusions are bold to say the least, but his reasoning is undeniably clear.
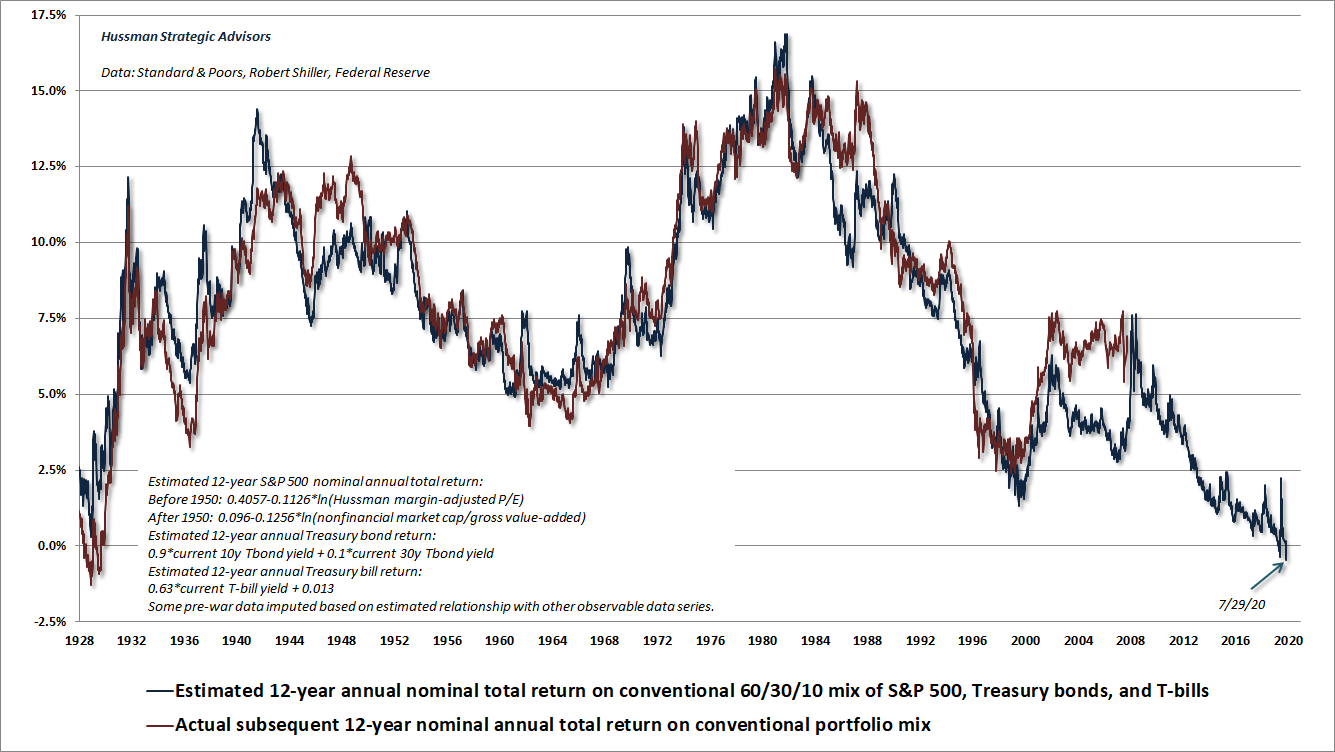
On Wednesday July 29, the U.S. financial markets quietly made history, as our projection of 12-year nominal total returns for a conventional passive portfolio mix (60% S&P 500, 30% Treasury bonds, 10% Treasury bills) fell to -0.45%, the lowest level in history. While 10-year Treasury bond yields are at just 0.6%, we estimate that the 12-year average annual total return of the S&P 500 will fall short of that level by about 2%, producing a very long, but likely interesting, trip to zero or negative returns for more than a decade.
Here we go.
EURUSD.
EURUSD 1hr.
EURUSD 4hr.
EURUSD daily.
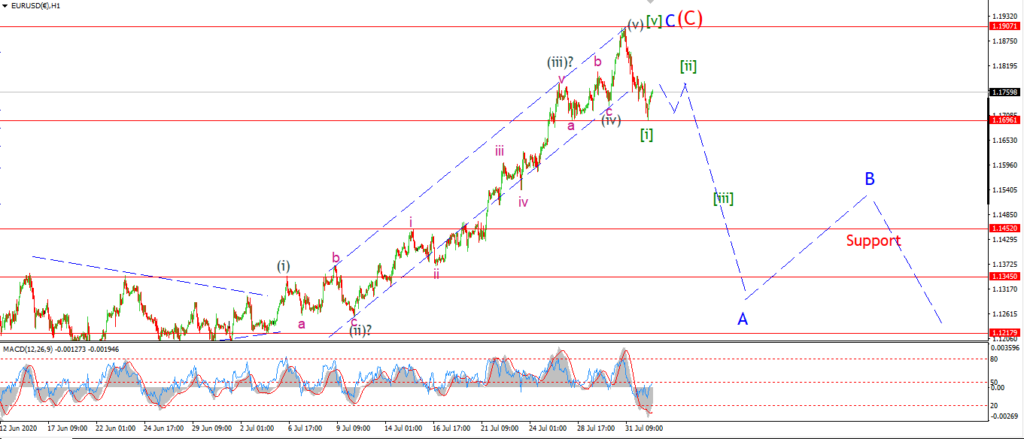
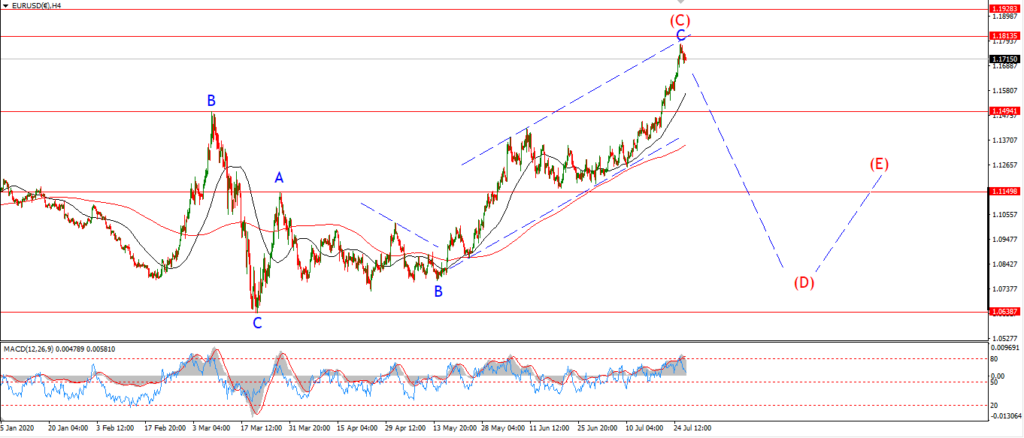
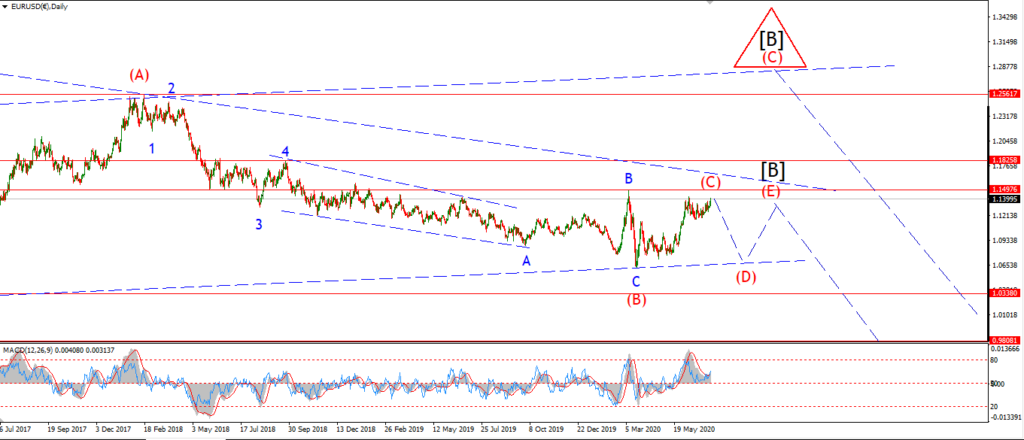
EURUSD rebounded slightly off Fridays selloff today.
I am viewing this as a second wave retracement to a lower high.
Wave [ii] should trace out three waves up over the next few sessions and complete below 1.1907.
Tomorrow;
Watch for wave [ii] to continue sideways.
Wave [iii] down will begin with a break of 1.1696 again at the wave [i] low.
GBPUSD
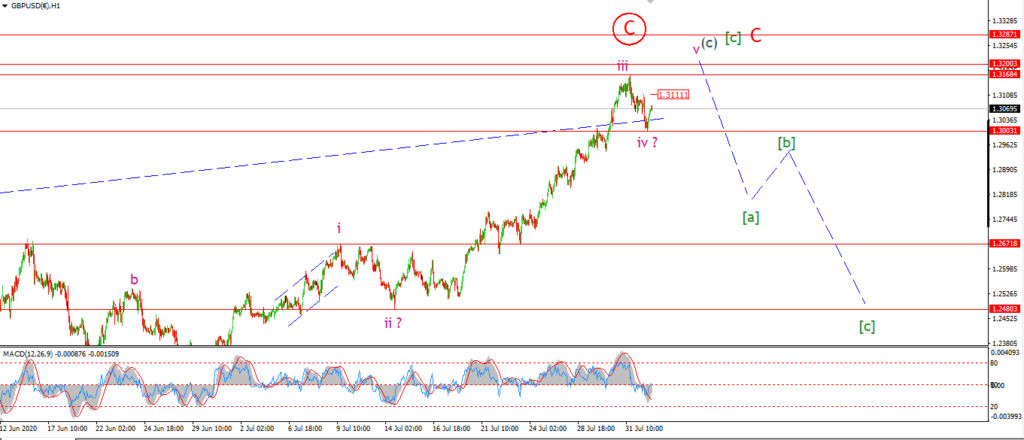
GBPUSD 1hr.
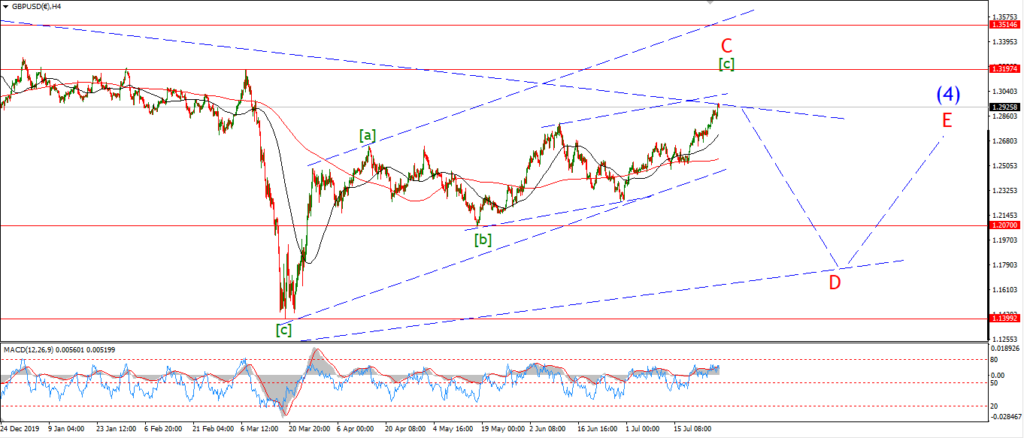
GBPUSD 4hr.

GBPUSD daily.
Cable has only completed a three wave decline into todays lows at 1.3003.
This action has raised the possibility that wave (c) is actually tracing out a five wave rally overall.
The price is hanging right below a resistance zone from 1.3200 to 1.3287.
So I suspect wave ‘v’ will still complete in that area.
The previous count now becomes the alternate showing the recent high as the top of wave ‘C’.
Tomorrow;
If the price breaks above 1.3111 that will signal wave ‘v’ is underway.
Any further declines from this point will favor the alternate count again.
USDJPY.
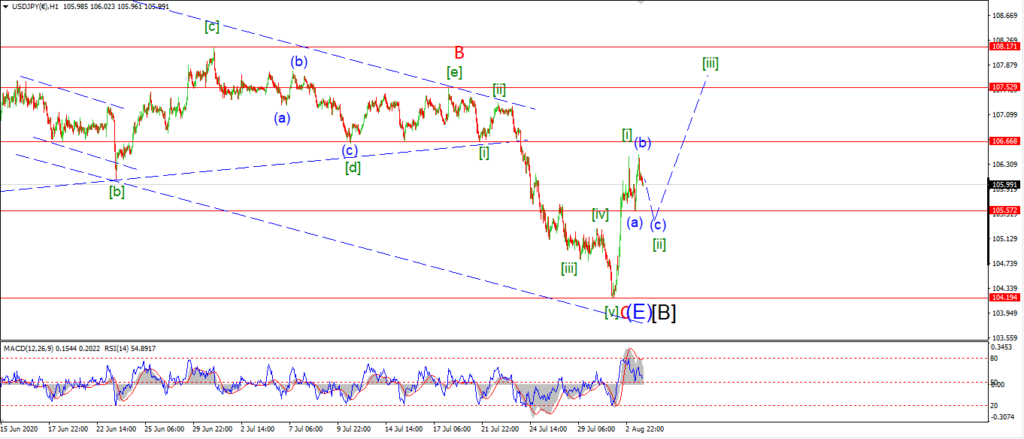
USDJPY 1hr.
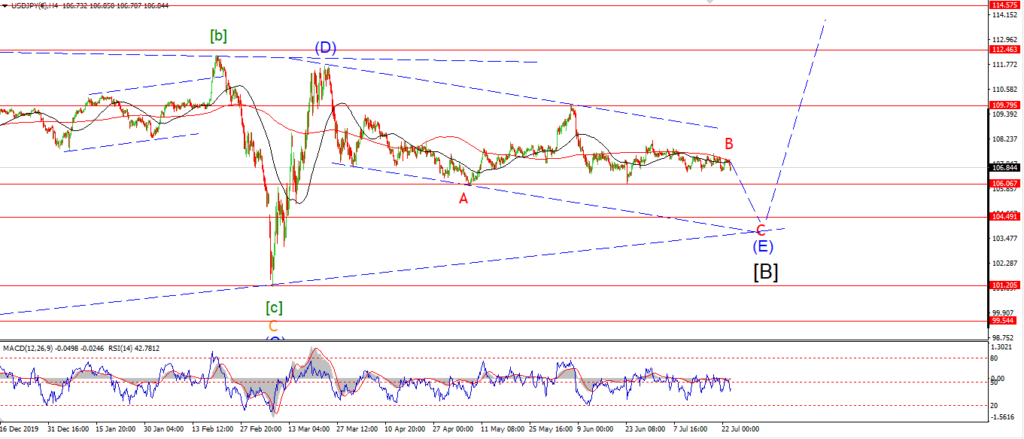
USDJPY 1hr.
USDJPY daily.
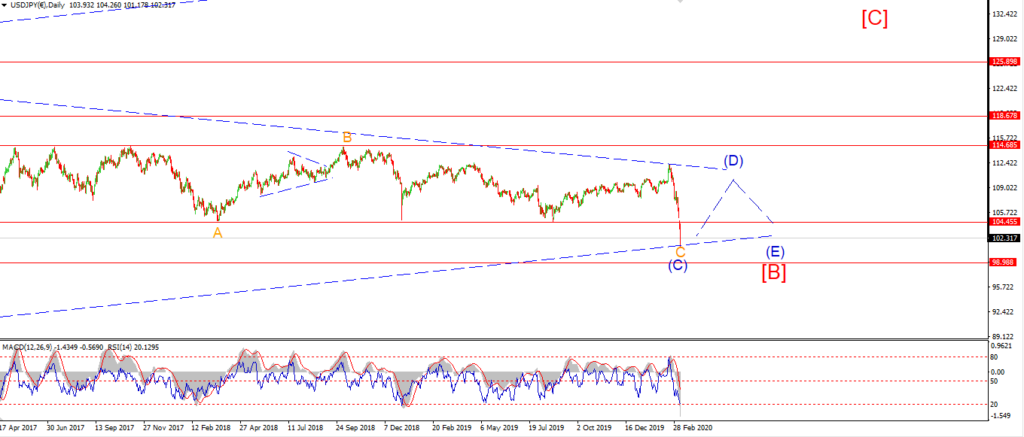
After Fridays big rally in USDJPY this week was always going to start with a correction.
And so it is today.
I have shown the action as a possible three wave flat correction in wave [ii] green.
This count will require wave (c) of [ii] to fall again below 105.57 at the wave (a) low to complete the correction.
Tomorrow;
Watch for wave (c) to continue lower and break 105.57.
At that point USDJPY will have a completed bullish impulse wave in place.
This should lead to a further rally in wave [iii].
DOW JONES.
DOW 1hr.
DOW 4hr
DOW daily.
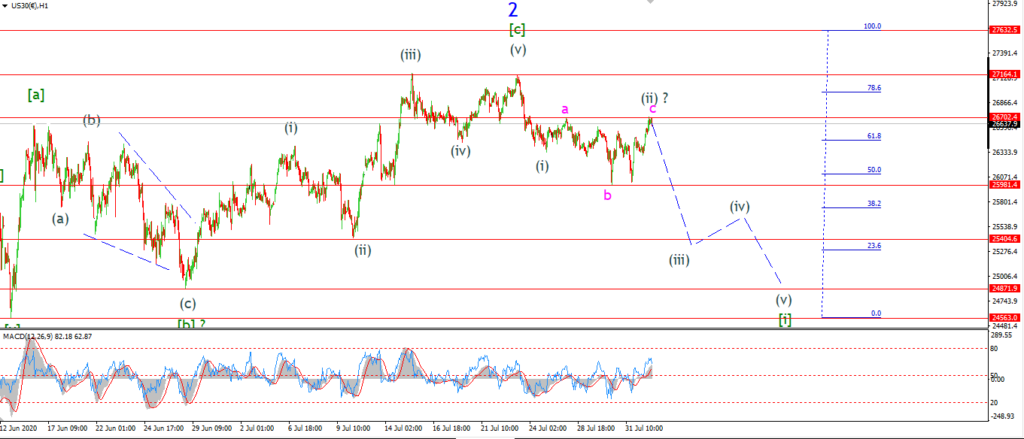
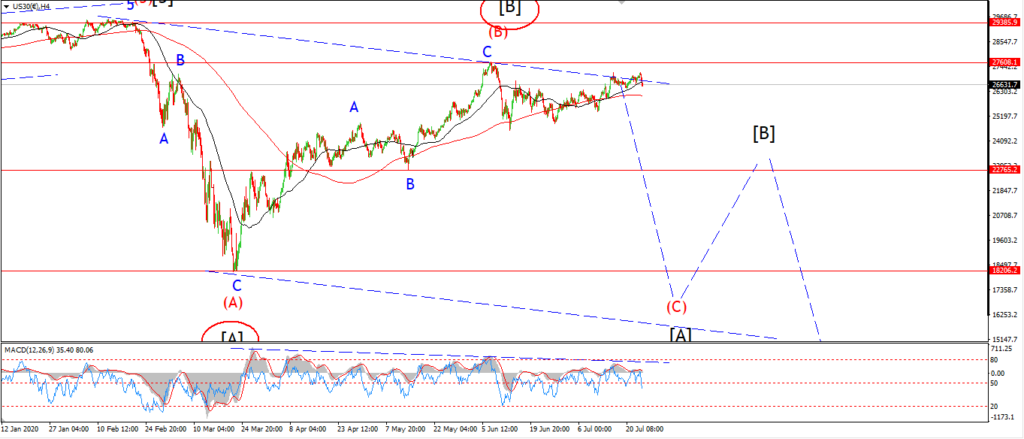
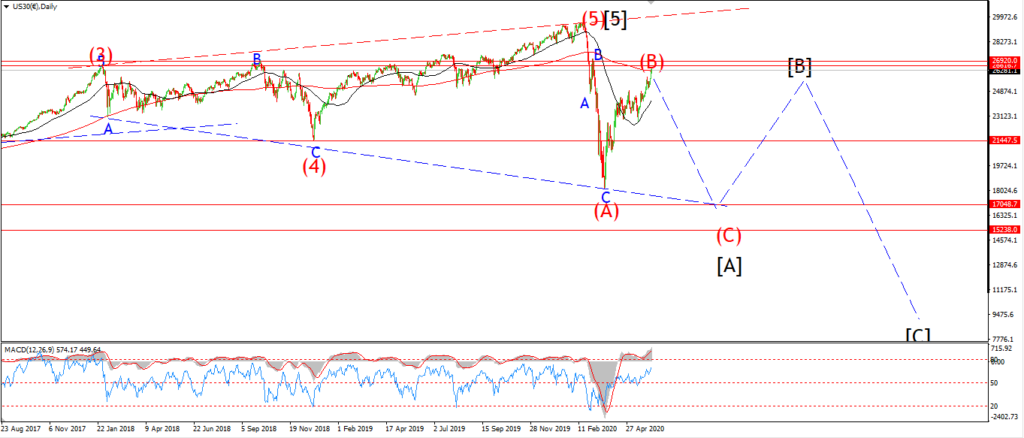
Todays rally in the Dow is against the grain for sure,
and because of that I have to be open to another new high above 27164 to be achieved this week.
There is still one fact in favor of the bearish count.
Todays rally was in three waves so far.
And the price has also halted at the previous wave ‘a’ high from last week.
This action still suggests a complex correction in wave (ii) is underway.
And a decline from this high again will signal wave (iii) has begun.
Tomorrow;
Watch for wave (iii) down to continue back below 26000 again.
27164 must hold.
GOLD
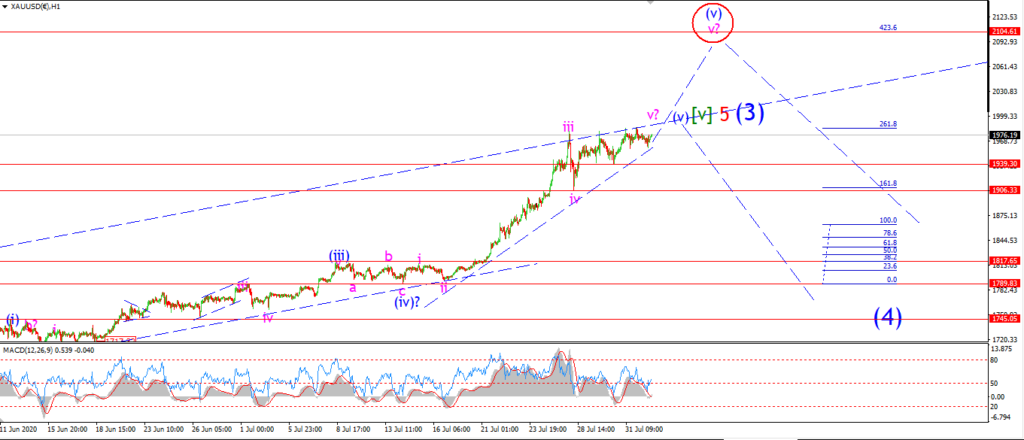
GOLD 1hr.
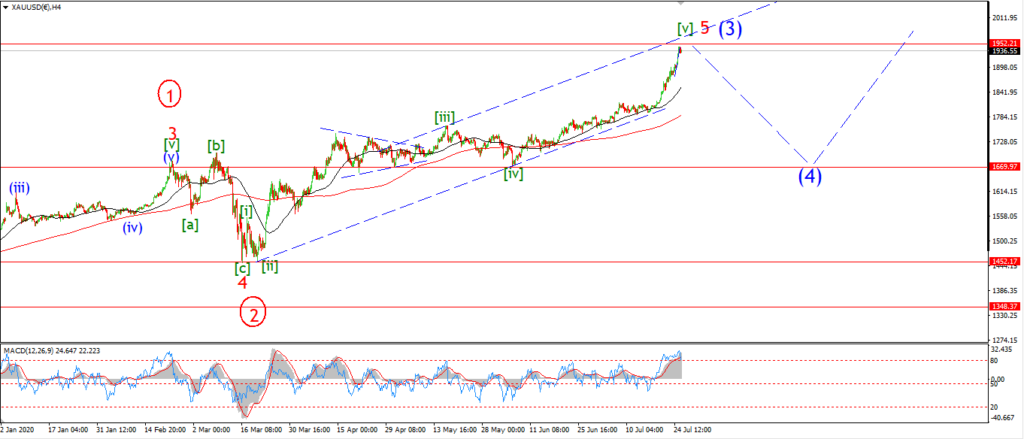
GOLD 4hr.
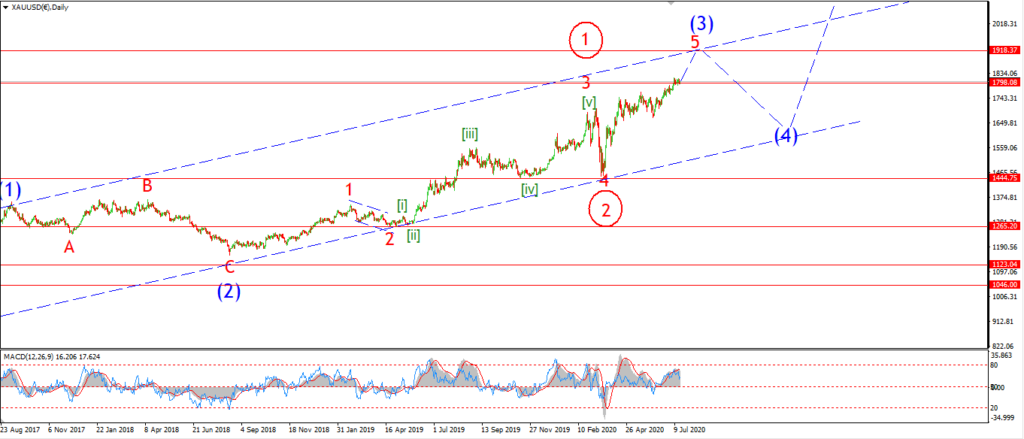
GOLD daily.
Gold has crawled sideways today and the pattern still fits the ending diagonal scenario that I explained last week.
I am not against the alternate count at all really,
but I am aware of the overtly bullish sentiment in the market right now.
and in general this sentiment extreme leans in favor of the idea that the best part of the rally is behind us now.
Tomorrow;
Watch for wave ‘v’ to complete an ending diagonal at the 2000 level and then begin a turn lower into wave ‘A’ of (4).
An acceleration higher from here will favor the alternate extended wave ‘v’ idea.
CRUDE OIL.
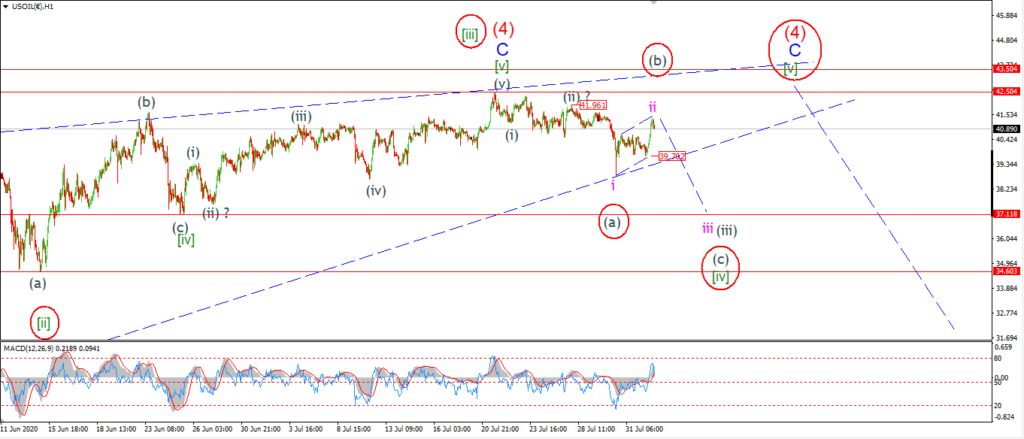
CRUDE OIL 1hr.
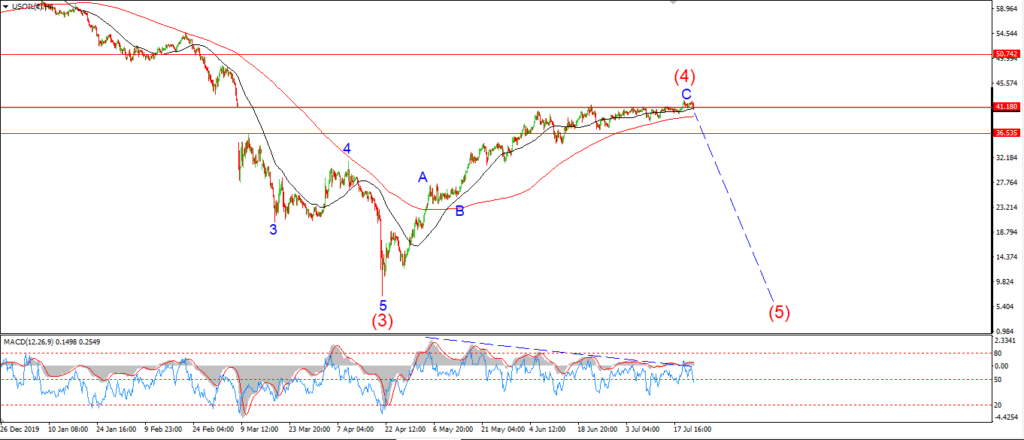
CRUDE OIL 4hr.
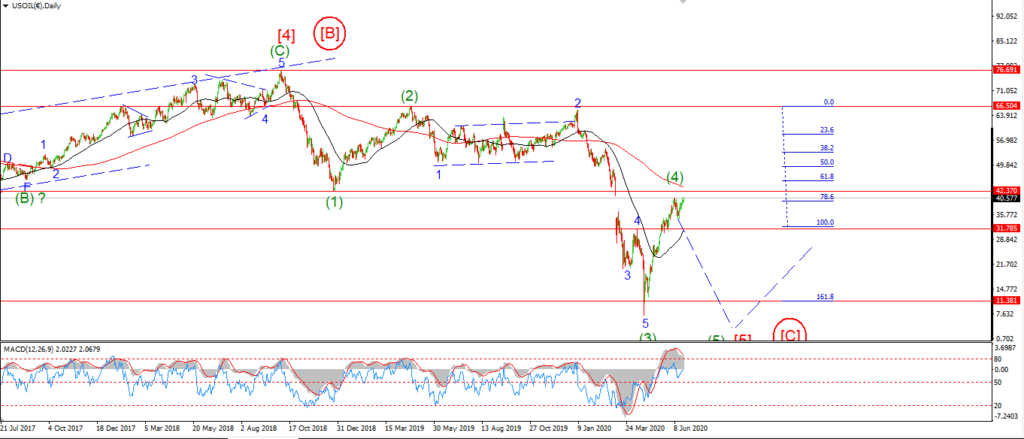
CRUDE OIL daily.
Crude has traced out a three wave rally to the upside over the last two sessions.
This action fits with a correction higher rather than a new rally phase beginning.
With this in mind there are two main ways to interpret this move.
This is either wave ‘ii’ of (iii),
Or,
this is wave (b) of [iv] as per the alternate count circled in red.
Both counts call for a fresh decline tomorrow in wave (iii) or wave (c),
but the alternate count will allow for wave [v] to complete back at the recent highs again.
Tomorrow;
Watch for a break of 39.70 as the first indication that the decline in wave (iii) is beginning.
S&P 500.
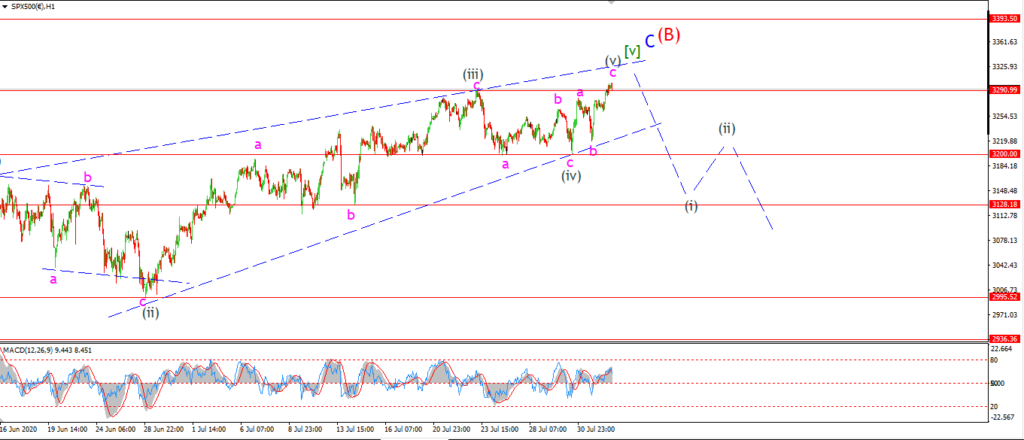
S&P 500 1hr
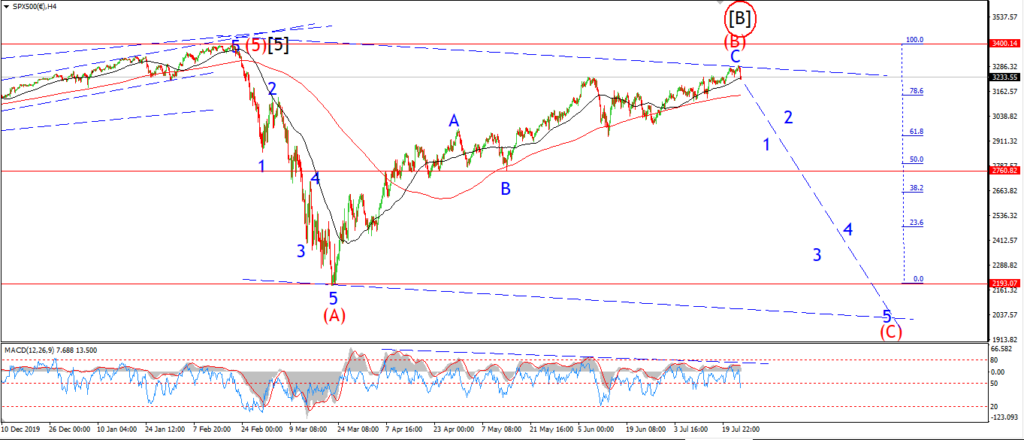
S&P 500 4hr
S&P 500 daily.
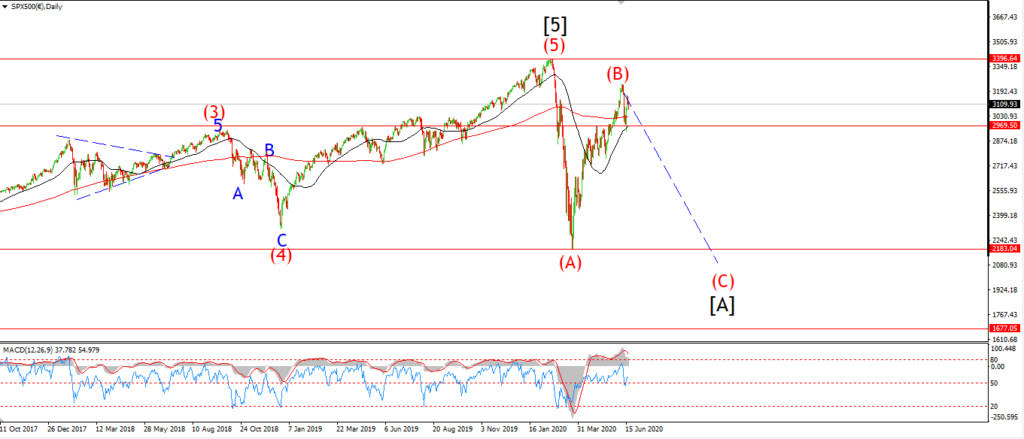
The S&P is back to within a stones throw of the all time highs again.
This is a level which I never thought I would see again in my lifetime!
But the level of fiduciary stupidity that we can reached has really taken my breath away of late.
I will draw your attention to this,
according to John Hussman’s research, the market is now priced for a decade of zero returns!
This implies that we will likely see a major bear market with declines in the regions of 60 -75% in the S&P over the coming few years.
Then a long march higher again back to zero again.
But hey, its always easier to be bullish at the top!
Tomorrow;
The slight new highs registered today happened after a rise in three waves off last Thursdays lows.
Again this pattern fits the ending diagonal idea for wave [v] of ‘C’.
The market has been rising in a narrowing wedge since the end of June.
And now the price is running on empty up to the upper trend line.
This rally is weak, way too concentrated and bleeding momentum by the bucket full! The top 5 stocks in the index account for 23% of the price!
We could see a fast break any day now.
SILVER.
SILVER 1hr
SILVER 4hr.
SILVER daily.
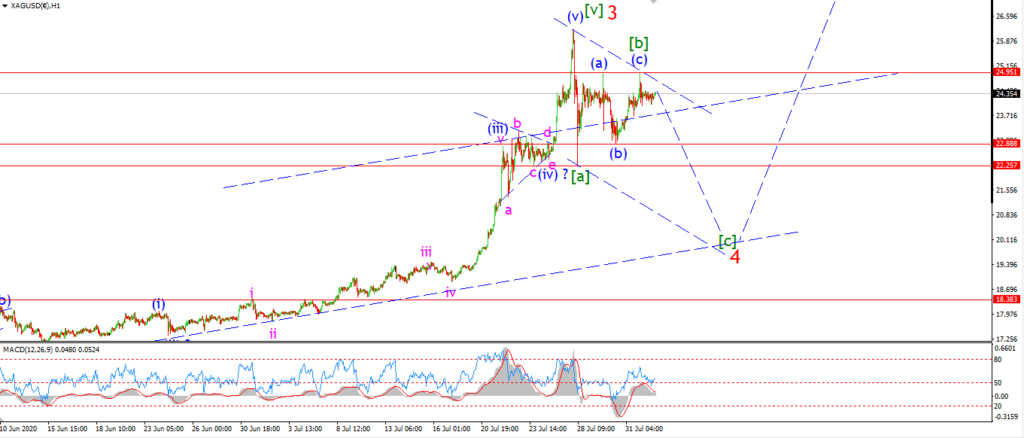
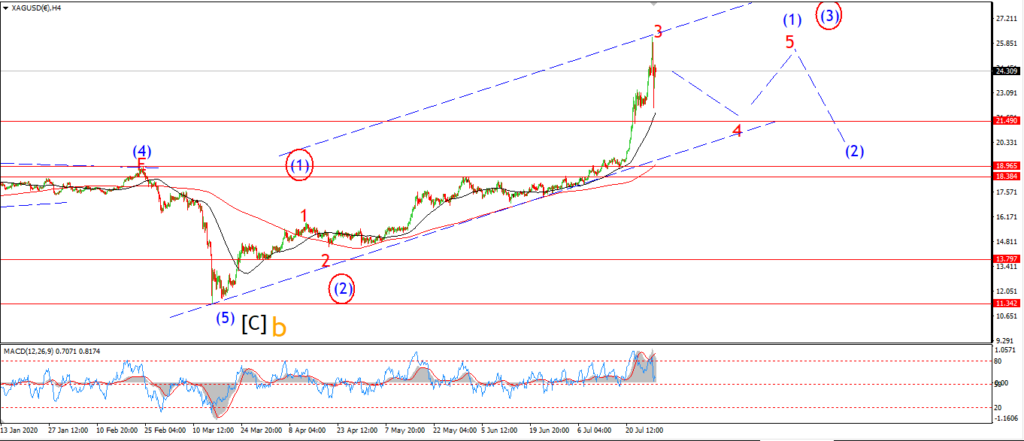
Silver is close to – or has already completed, a lower high in wave [b] this evening.
The price is holding below the overnight highs at the moment.
The current action is labelled as the initial decline into wave [c].
And wave [c] should trace out a five wave decline over the coming few days.
Tomorrow;
A break of the low at 22.88 will signal wave [c] is underway.
I am looking at the 20 handle again for wave [c] to complete.