
Good evening folks.
Welcome back to a new week.
A quick look at USD sentiment before we start.
Over the last few weeks I have seen more and more stories pop up about the ‘dollar collapse’ scenario. This level of sentiment is indicative of a near term bottom in the recent decline.
Add the fact that the Dollar Optimism Index is at the *lowest* 1% of readings over the past 10 years, and we get a picture of at least a medium term oversold environment.
So I think we will have a good bullish case building in the USD over the coming few weeks.
Lets get into it.

EURUSD.
EURUSD 1hr.
EURUSD 4hr.
EURUSD daily.
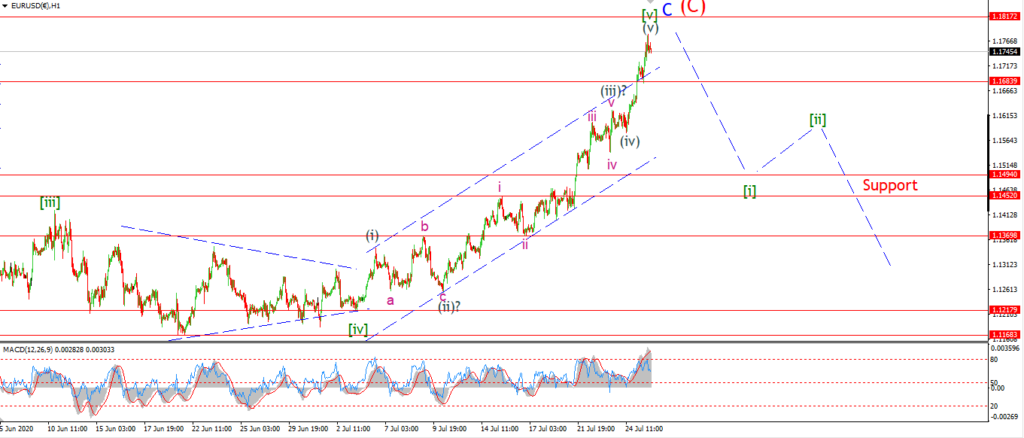
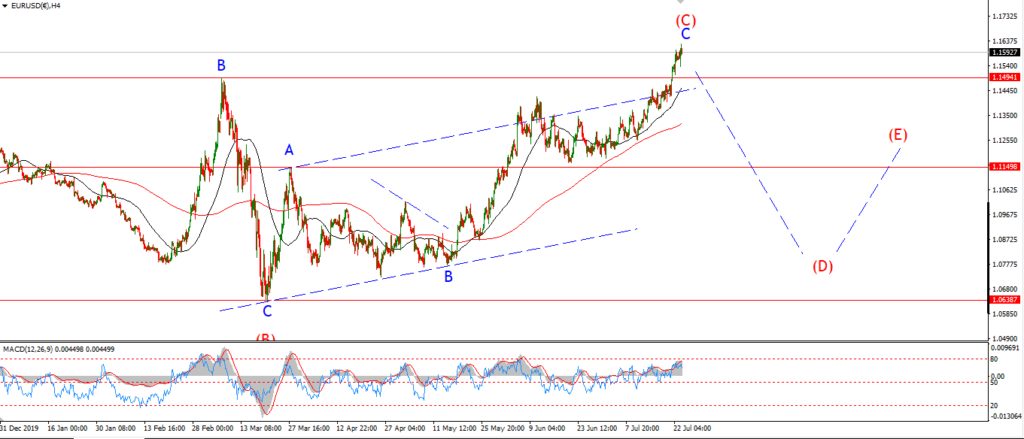
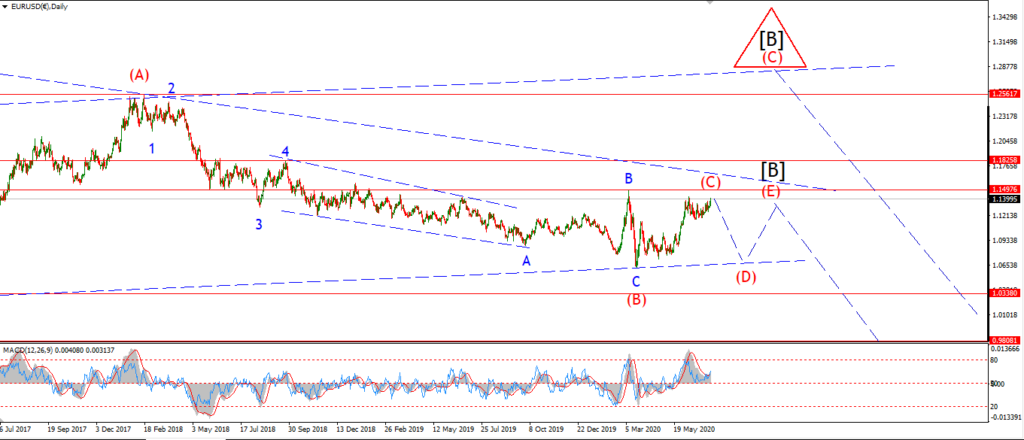
The action that we have seen over the last few days in EURUSD is a typical ‘C’ wave blow off top.
The price has reached the next higher resistance level at 1.1825.
And the action has hit an overbought extreme again.
If we look at the rally in wave (v) into todays highs,
we can see a small five wave pattern also.
I think this will be the week that EURUSD turns into wave (D) of the triangle.
Tomorrow;
watch for weakness to develop off the 1.1800 level.
I will be watching for a reversal lower to begin this week with five waves down
GBPUSD
GBPUSD 1hr.
GBPUSD 4hr.

GBPUSD daily.
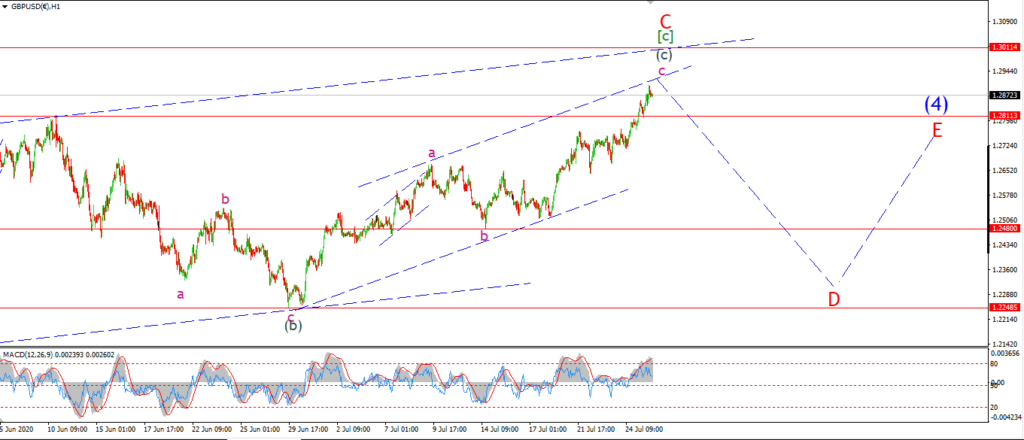
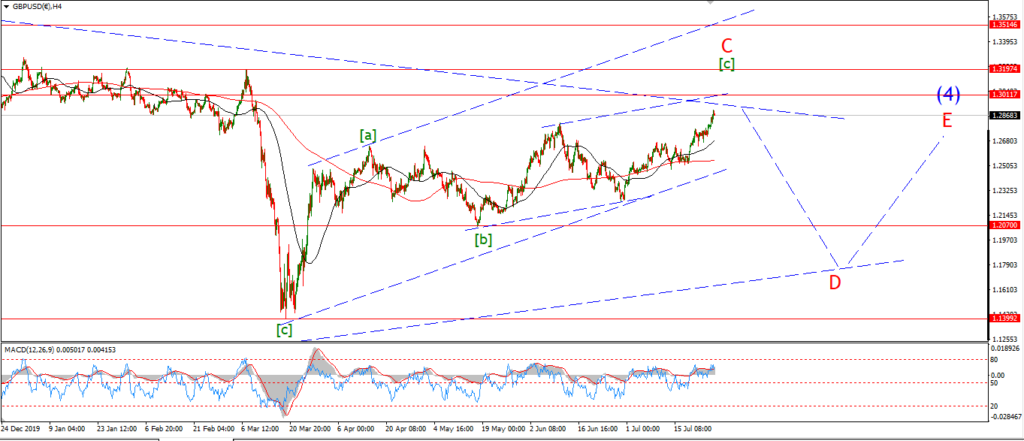
Cable has broken above the invalidation line for the previous version of the triangle wave ($).
On the 4hr chart;
The price is now completing a three wave rally into wave ‘C’.
Wave ‘C’ is labelled as a complex correction higher with three waves within each move.
Wave [c] of ‘C’ is heading towards the upper trend channel line,
and that move could hit at about 1.3000.
It depends if we get a five wave rally in wave (c) or a three wave one as shown.
Once this move completes in wave ‘C’,
I will begin looking lower into wave ‘D’ again.
Tomorrow;
Wave ‘c’ of (c) has completed a five wave pattern now,
so lets see if we get any weakness off the upper trend channel line.
USDJPY.
USDJPY 1hr.
USDJPY 1hr.
USDJPY daily.
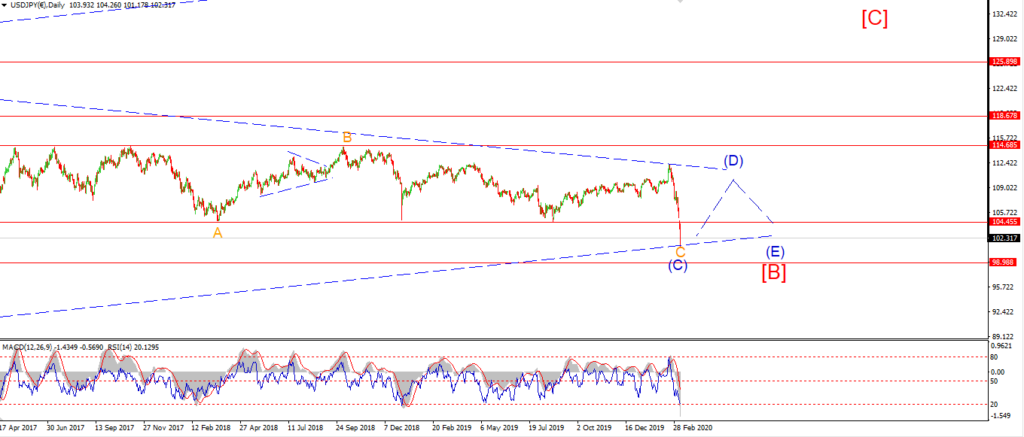
We are approaching a very significant low for USDJPY now as we close out a long term triangle in wave [B].
The next major move will be to the upside,
and it has the potential to run above 125.00 over the next few years.
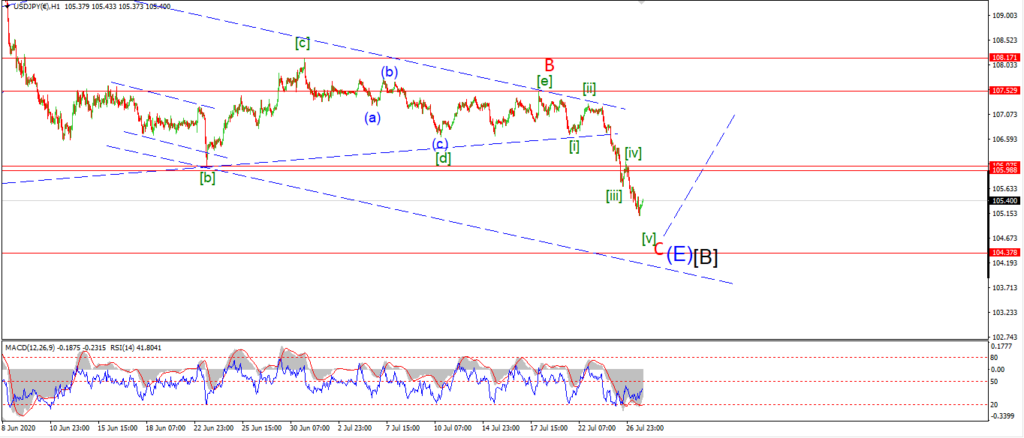
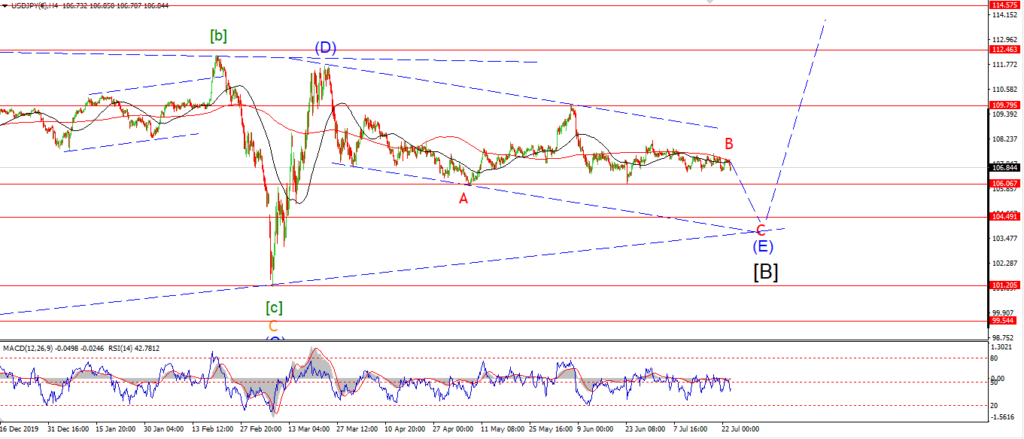
Wave ‘C’ down is now approaching a completed five wave decline off the high.
I have that lower target at about 104.00 for wave ‘C’,
where the price will hit the lower trend line.
We also have a long term rising trend line coming in at that level too.
Tomorrow;
in the short term the price will likely move towards that level.
So I will be watching wave [v] of ‘C’ closing out this week before any move higher can begin.
DOW JONES.
DOW 1hr.
DOW 4hr
DOW daily.
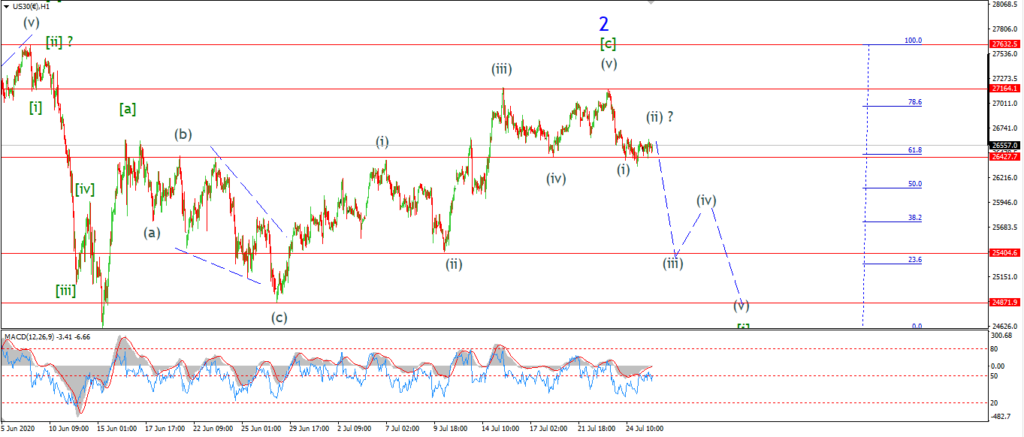
The action in the DOW has been dead flat today,
as the price moves within a possible correction higher in wave (ii) as shown.
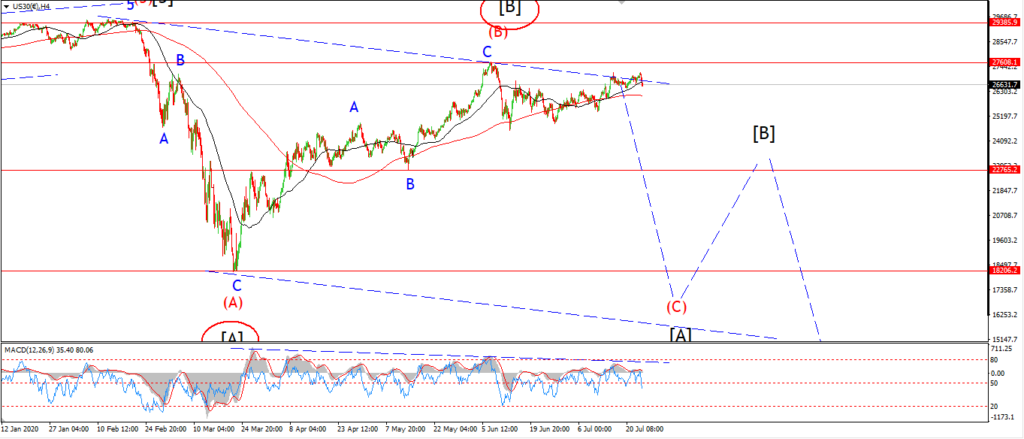
I am looking for a larger five wave move to the downside this week in wave [i],
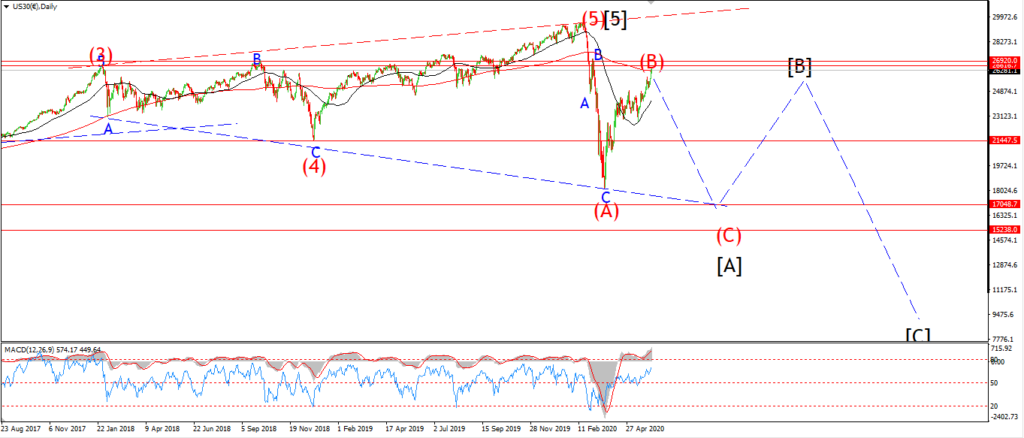
and that should call a halt to this over cooked rally off the march lows.
And bring in a new selling phase in wave ‘3’ of (C) which is long overdue now!
If wave ‘2’ is done as I have labelled,
then we should see wave [i] of ‘3’ push down below the 24800 level.
And wave (iii) of [i] is expected to break the 25400 level.
These two levels mark significant support now.
So a break through those levels will confirm that the trend is changing.
Tomorrow;
watch for wave (ii) to top out soon and then turn lower again into wave (iii) of [i] over the coming days.
GOLD
GOLD 1hr.
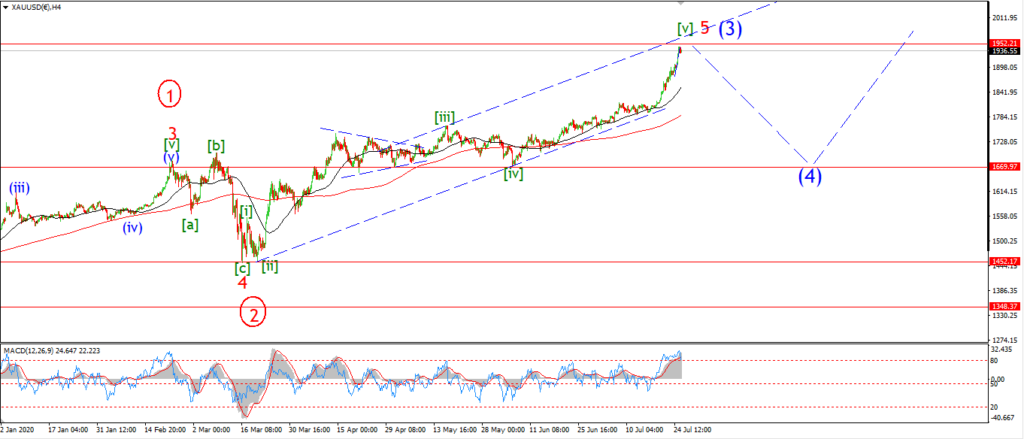
GOLD 4hr.
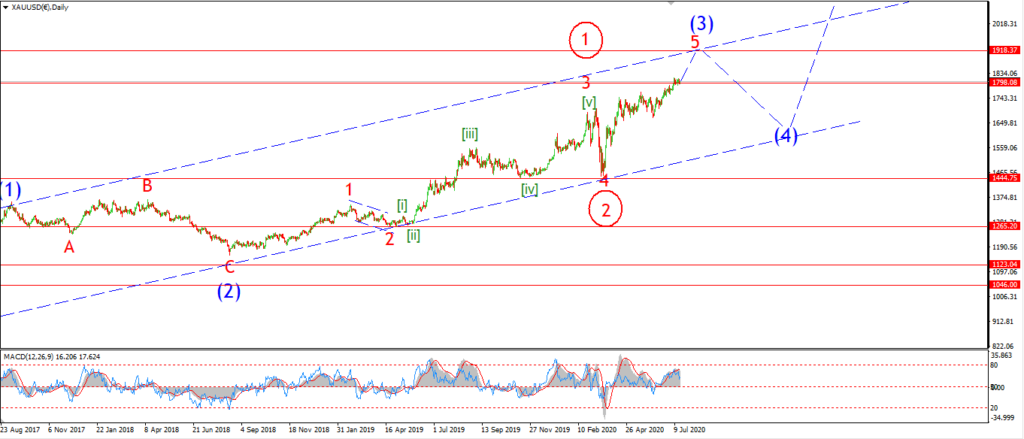
GOLD daily.
Well we have a new all time high in gold today!
I have been looking for that to happen for a while now, but better late than never eh!
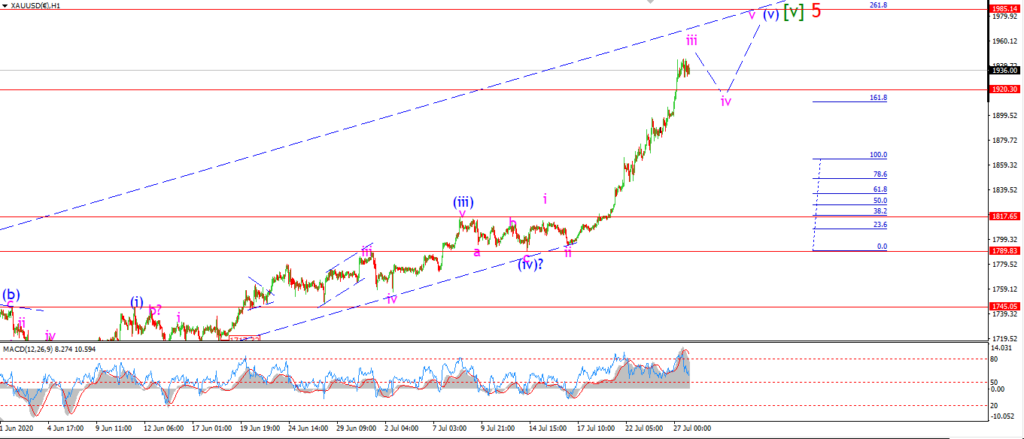
I am labelling this rally as wave (v) of [v] now,
but we don’t have a clear five wave pattern completed in wave (v) yet.
I have shown the rally into todays highs as wave ‘iii’ of (v),
with a further fourth and fifth wave left to complete wave (v) blue.
On the 4hr chart, the price channel off the March lows is not filled just yet either.
So there is still a possibility that wave (v) will create a throw over above that upper trend line.
Tomorrow;
Wave ‘iv’ will correct off the highs soon and create a three wave correction lower.
I would like to see wave ‘iv’ hold above 1900.
then wave ‘v’ will complete this rally.
CRUDE OIL.
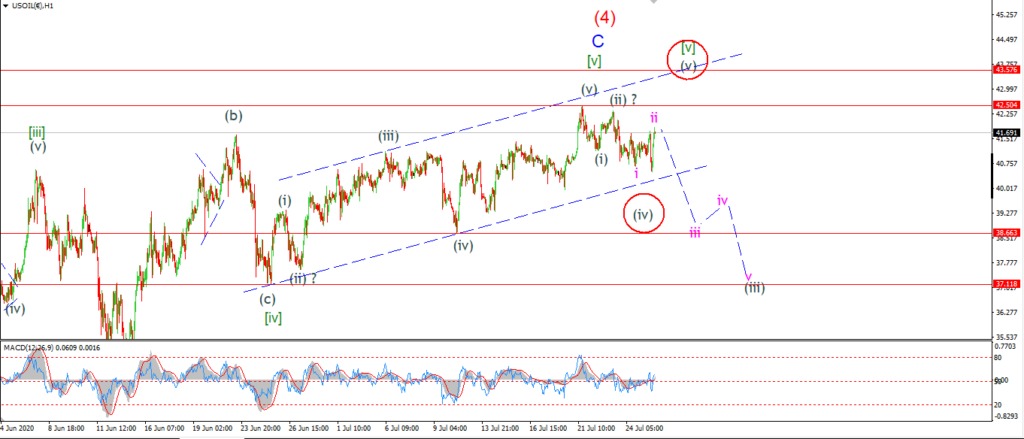
CRUDE OIL 1hr.
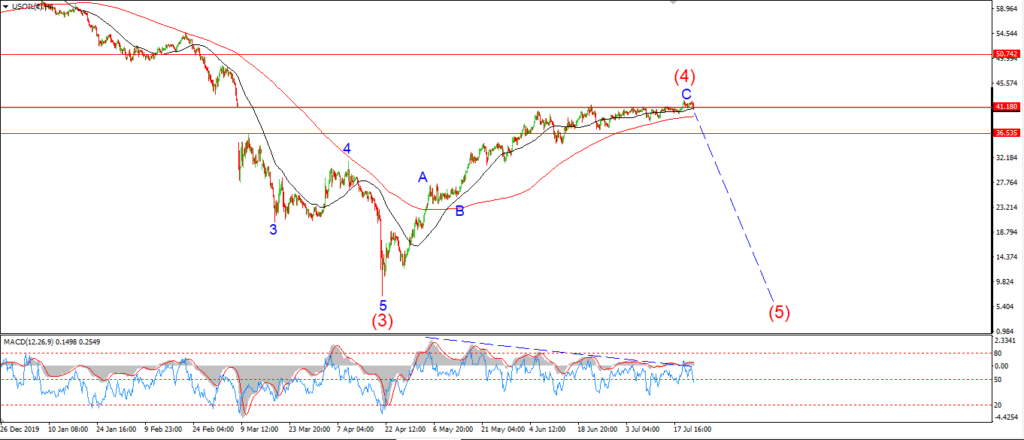
CRUDE OIL 4hr.
CRUDE OIL daily.
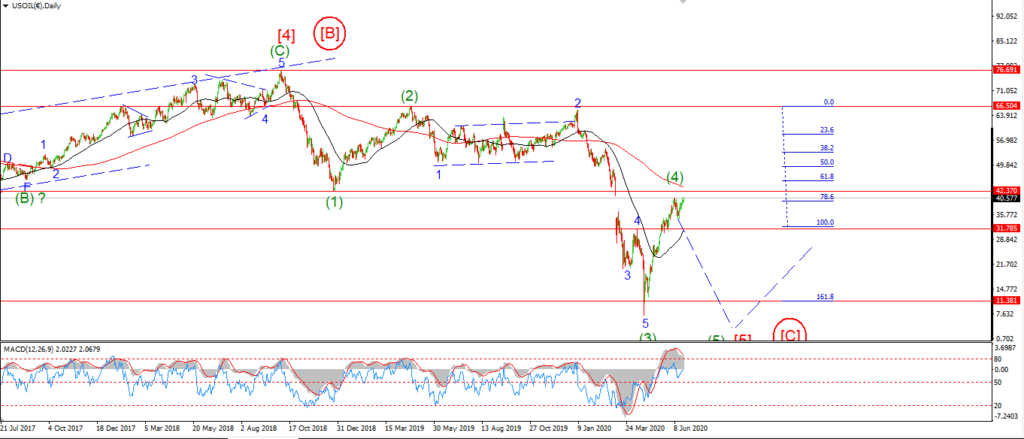
Crude oil is refusing to comply as usual.
The price fell earlier in the session but reversed higher to push above Fridays high again.
If the price does not fall sharply tomorrow into wave ‘iii’ of (iii),
that will favor the alternate count for wave [v] shown circled in red.
Tomorrow;
watch for 42.50 to hold as the wave (v) high.
A break below 40 again will signal the top is in and wave ‘iii’ of (iii) is underway.
S&P 500.
S&P 500 1hr
S&P 500 4hr
S&P 500 daily.
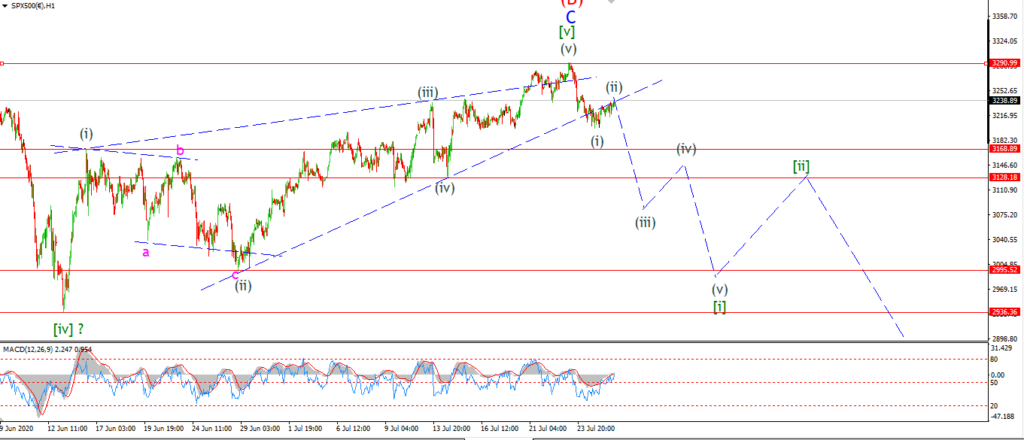
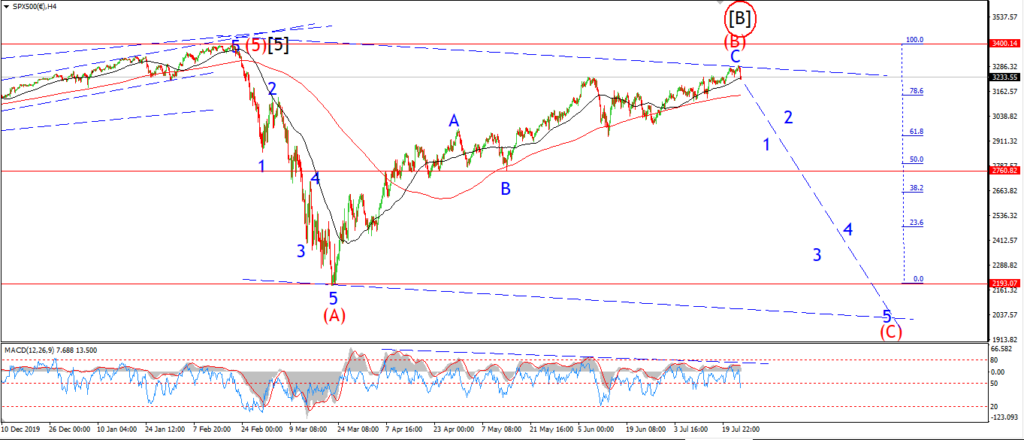
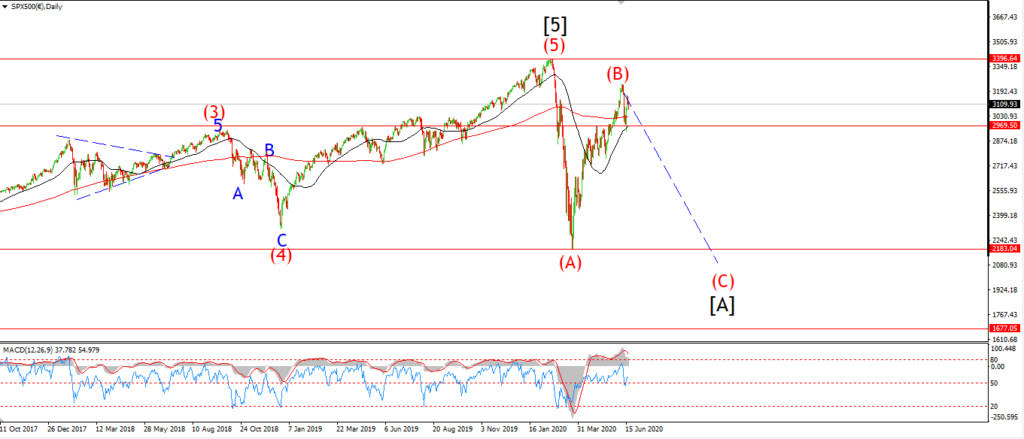
The S&P is correcting higher in a very weak manner today.
The price is crawling higher along the lower trend line of the wedge of wave [v].
This move is encouraging so far,
but I need some confirming price action to the downside.
This will come with a break below 3120 again,
to slice through that band of support created by waves (i) and (iv) of the previous rally at 3168 and then 3128.
Tomorrow;
Wave (ii) should top and roll over into wave (iii) by tomorrow evening.
Wave (iii) down should be sharp with a clear acceleration involved.
Watch for a break of 3168 initially to begin wave (iii).
SILVER.
SILVER 1hr
SILVER 4hr.
SILVER daily.
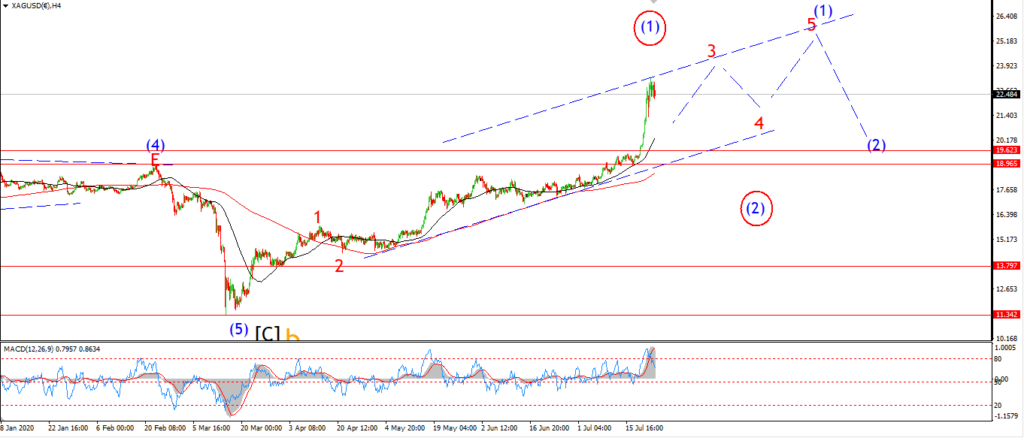
If we take a look at the 4hr chart first.
The price has broken above the upper trend channel line after the most recent rally.
And we are registering a severe overbought environment now.
I am looking for a top in at least wave ‘3’ of (1) to form soon.
And then we will likely see a drop back towards the 18.90 area again in wave ‘4’ over the next few months.
The alternate count on the 4hr chart calls for a drop in wave (2),
the initial target for that decline is in the same area.
Back to todays action.
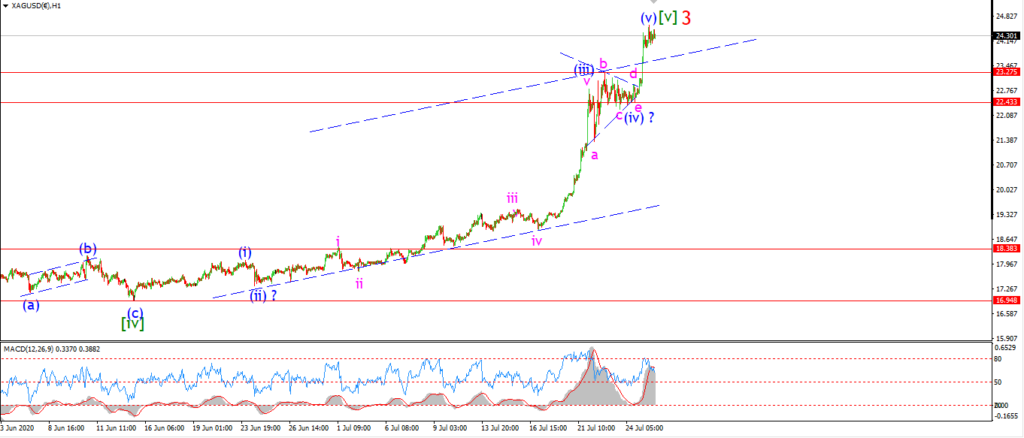
This rally looks like a thrust from a triangle as suggested in Fridays update.
If that is the case,
then we are very close to completing this rally.
And any decline back below that triangle low at 22.40 will signal the rally is complete.
Tomorrow;
Watch for wave (v) to top out this week.
23.27 marks the top of the triangle so a break of that level will signal weakness.