
Good evening folks.
I’m back!
A few charts to get us back into the swing of things.
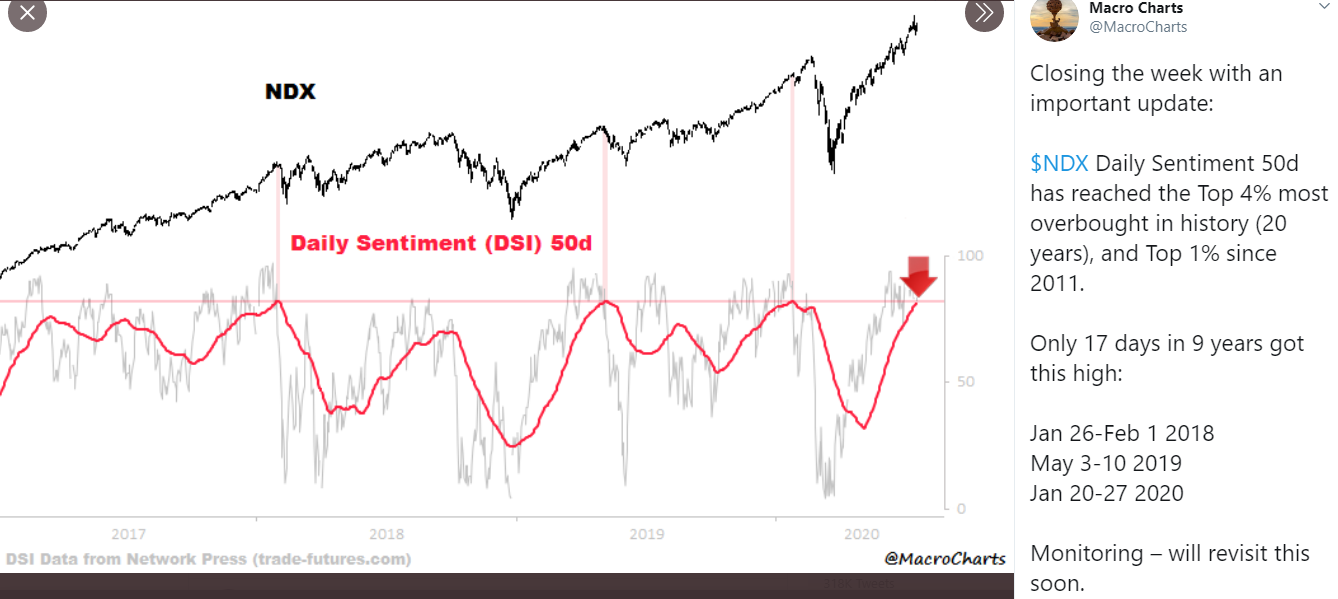
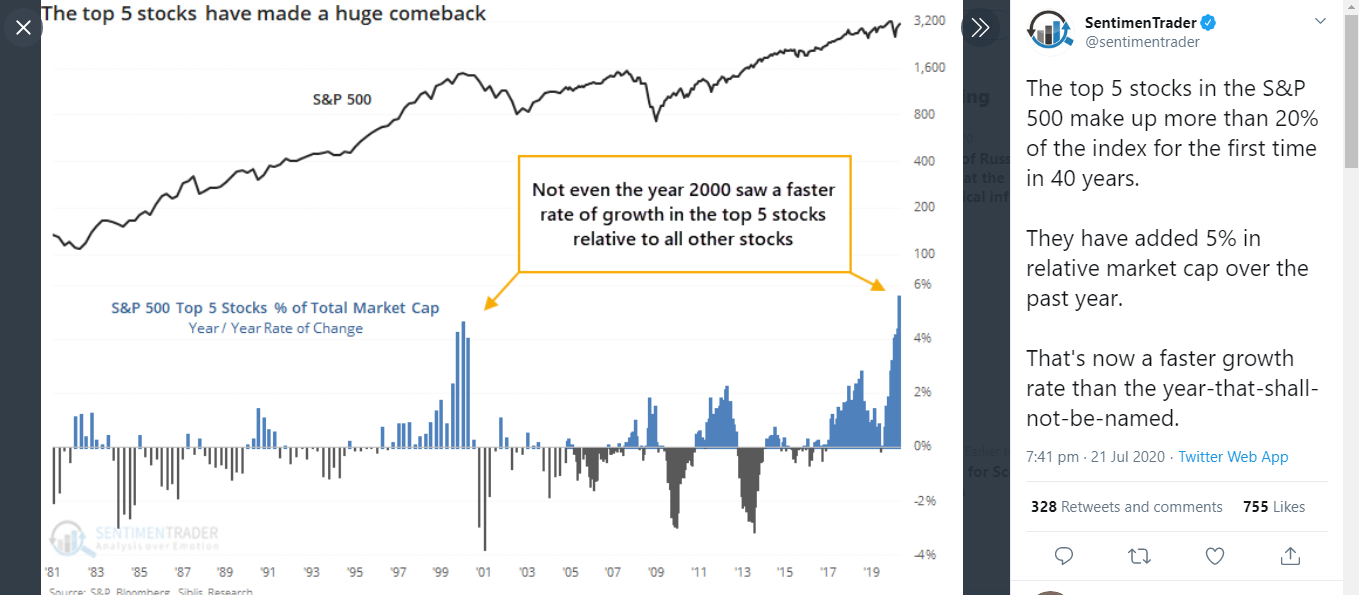
Please be aware that this in NOT a normal time in history.
We are sitting at an historic inflection point that will be looked back on with amazement later on.
EURUSD.
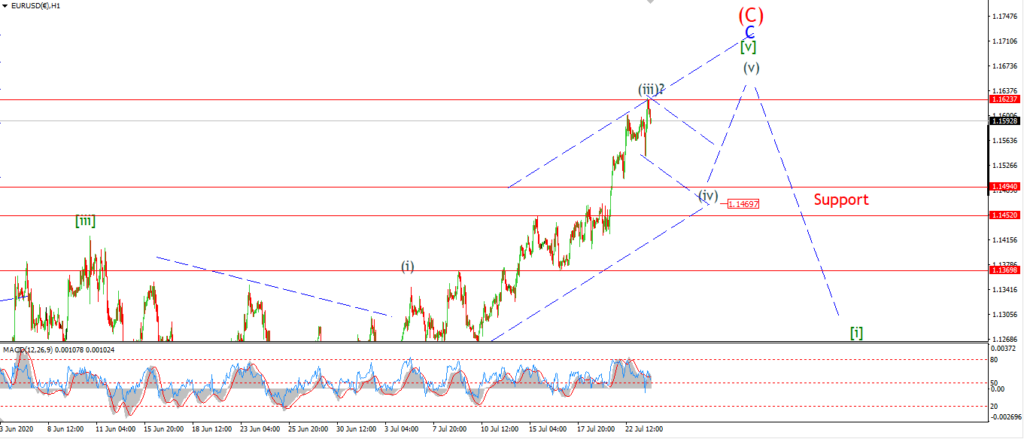
EURUSD 1hr.
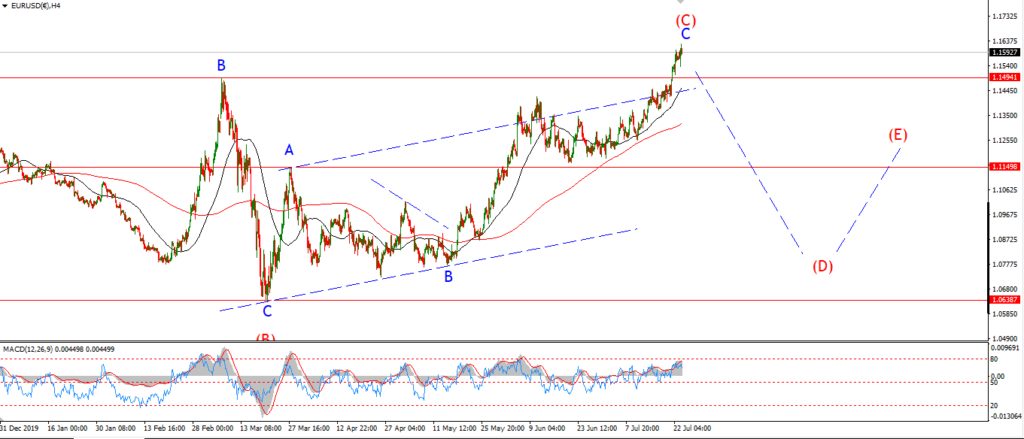
EURUSD 4hr.
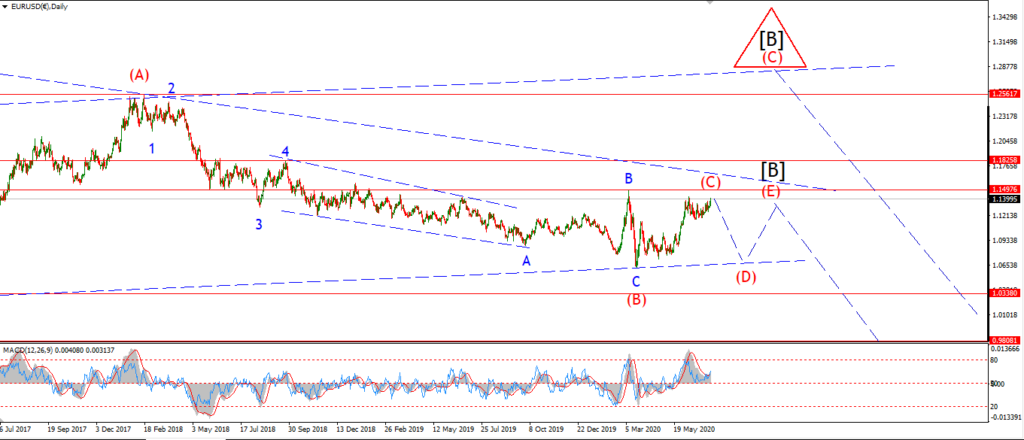
EURUSD daily.
EURUSD has hit the upper range for the top of wave (C) now.
The price has breached the 1.15 February highs now with the rally over the last few days.
We have a five wave rally in place in wave ‘C’,
and the price has created a throw over above the upper trend channel line on the 4hr chart.
I think we are in a perfect area for a top to form now.
But I have shown on the short term chart
that we may have one more cycle of fourth and fifth waves left to complete the pattern.
Tomorrow;
Watch for wave (iv) of [v] of ‘C’ to fall back over the next few sessions.
This decline should form a three waves and it should find support at about 1.1500 again.
GBPUSD
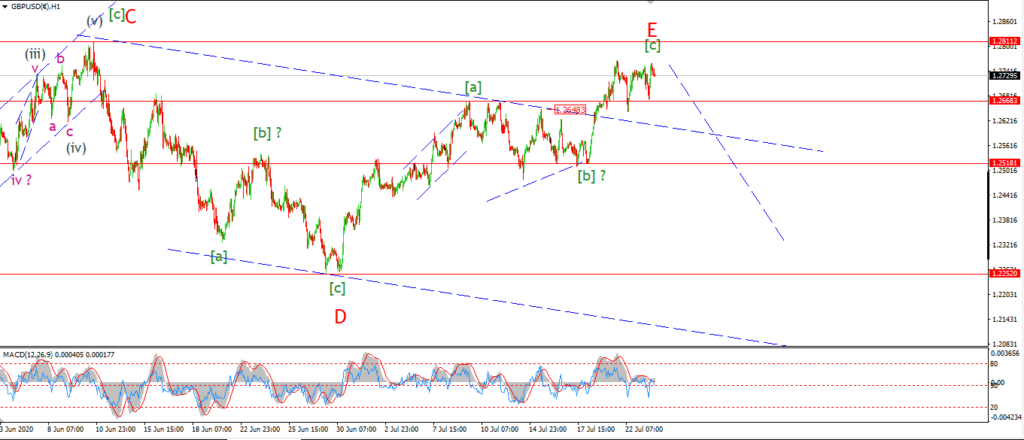
GBPUSD 1hr.
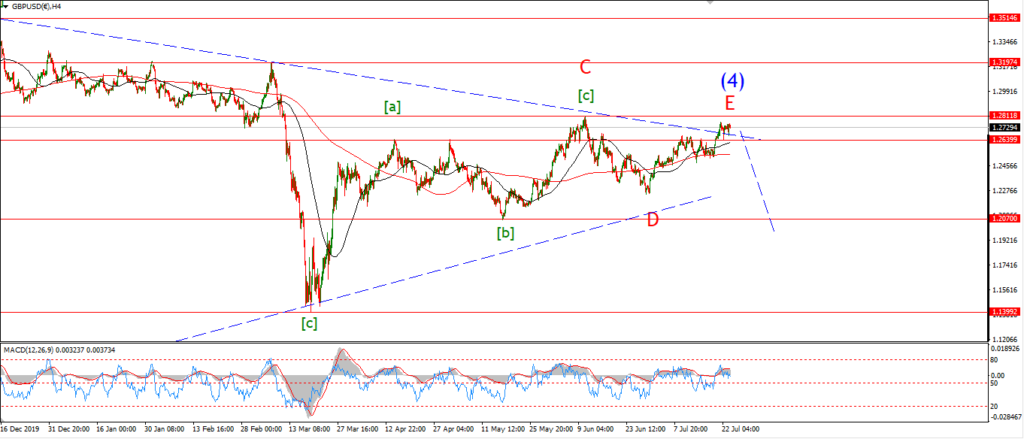
GBPUSD 4hr.

GBPUSD daily.
The same is true for cable in terms of the extended nature of the rally.
If you see the 4hr chart,
the price is very close to the wave ‘C’ top within the triangle at 1.2811.
A break of this high will denote an extension of wave ‘C’, nothing else.
I still expect wave ‘D’ to take over sooner rather than later.
If this is wave ‘E’ now closing out,
then the price must fall soon to begin the next leg down.
Tomorrow;
1.2811 must hold for wave ‘E’ to remain valid.
A drop below 1.2518 again will signal that wave ‘E’ is complete and the next impulsive move lower has begun.
USDJPY.
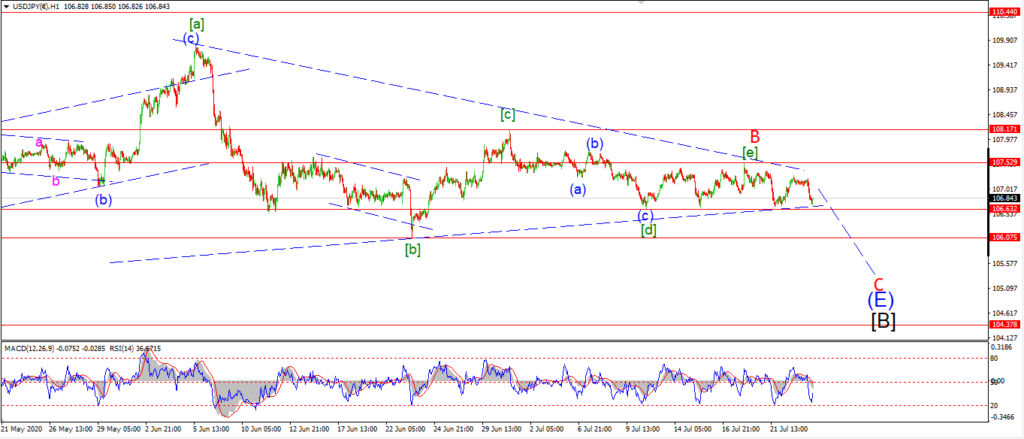
USDJPY 1hr.
USDJPY 1hr.
USDJPY daily.
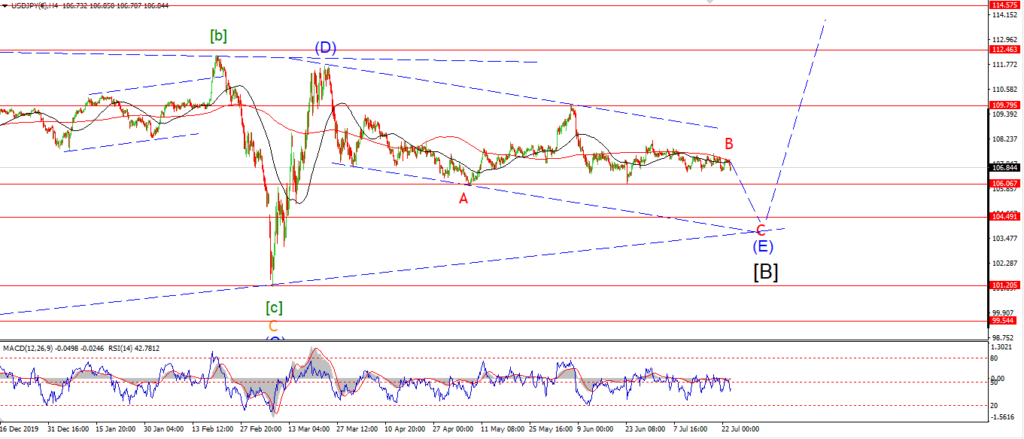
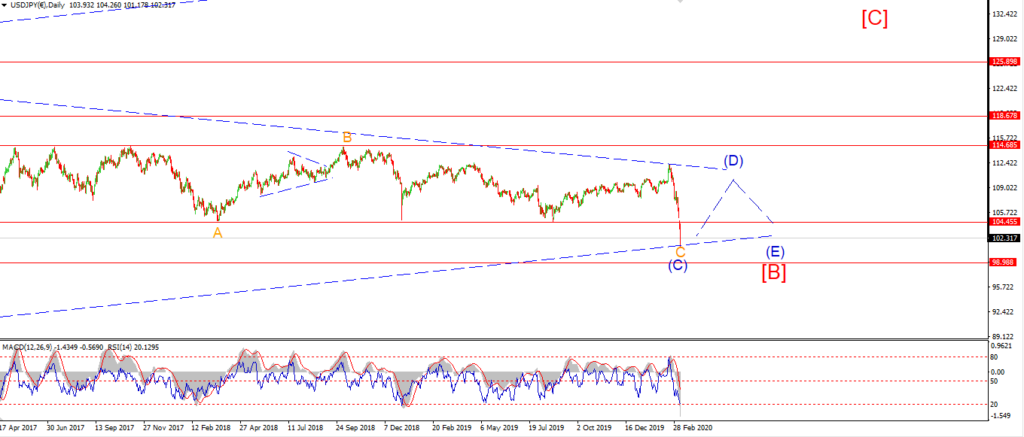
The failure to rally out above 108.00 again has triggered the alternate count for USDJPY.
This new count involves a decline back below 106.00 again at a minimum in wave ‘C’ of (E).
The lower range of the target for wave ‘C’ lies at 104.00.
This new wave count will be confirmed with a break of 106.60 at the wave [d] low of the triangle.
Tomorrow;
wave ‘C’ should trace out a five wave decline over the coming week.
the minimum target lies at 106.00 for wave ‘C’.
after that point I think we will be very close to a major bottom for the USD across the board.
DOW JONES.
DOW 1hr.
DOW 4hr
DOW daily.
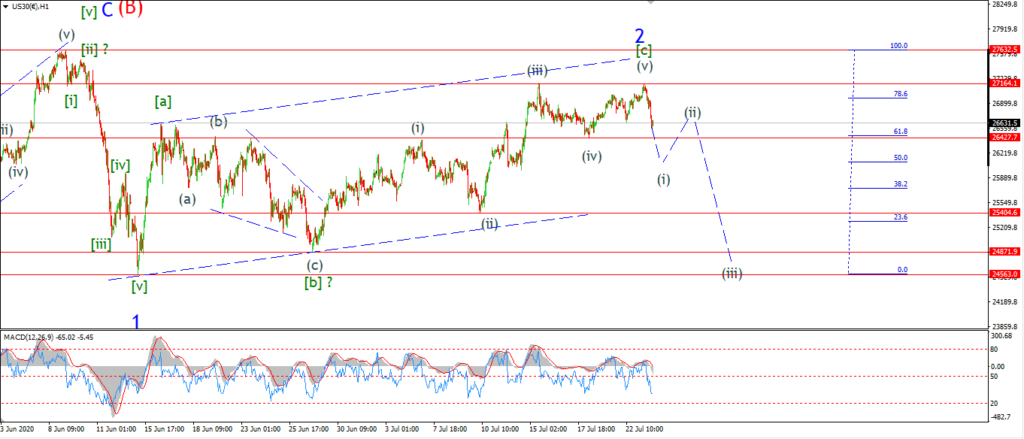
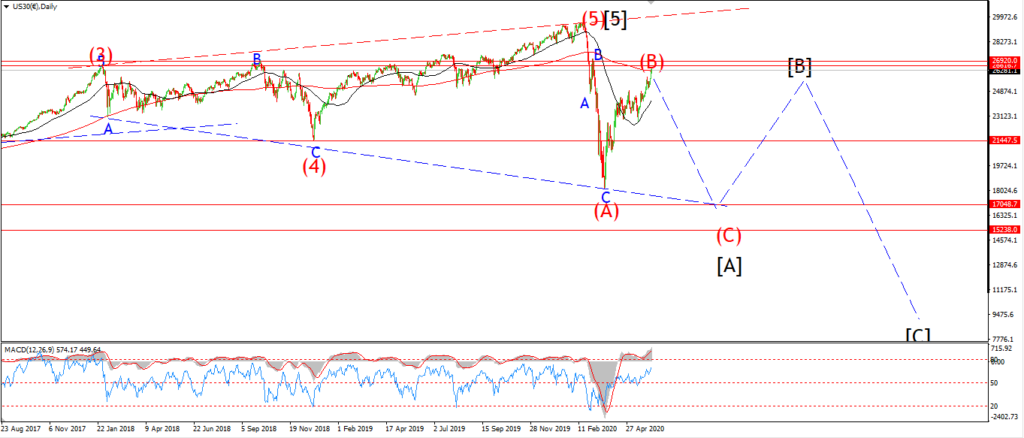
The DOW has reached a double top in wave (v) of [c] tonight.
The market grinded higher over the last few sessions to hit this marker,
and in doing so we now have a completed ending diagonal in wave [c].
Each internal wave in wave [c] has traced out a three wave pattern,
to complete the overall ‘five waves of three’ pattern.
The market is selling quite impulsively this evening with the price approaching the previous fourth wave low at 26420 again.
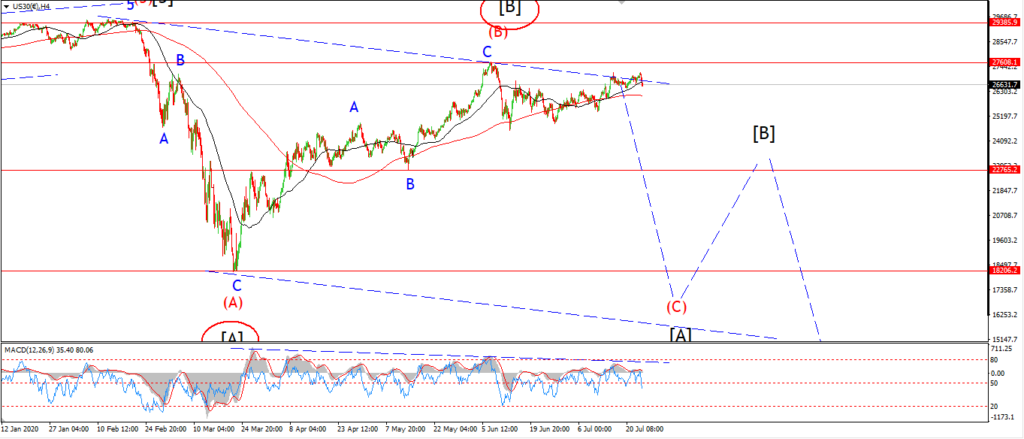
An impulsive five waves down off this point will indicate that wave ‘3’ down is beginning.
And if this pattern is correct,
then we should get ready for a major acceleration lower over the coming weeks in wave ‘3’ of (C) of [A].
Tomorrow;
watch for the initial support at wave (iv) to break with five waves down in wave (i) of [i] of ‘3’.
GOLD
GOLD 1hr.
GOLD 4hr.
GOLD daily.
Well,
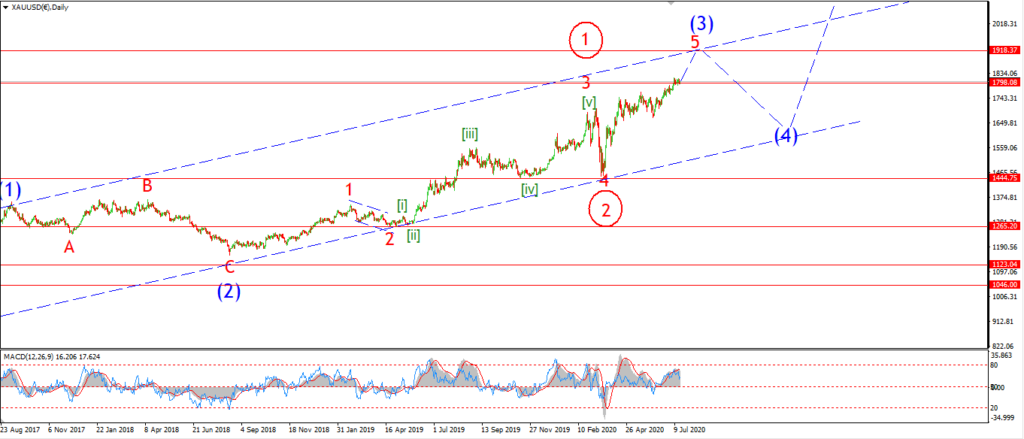
I was puzzling last week and wondering where the acceleration was to complete this large third wave up in gold.
And voila, it came in with a bang this week.
If only everything went as smoothly as that in life eh!
On the 4hr chart,
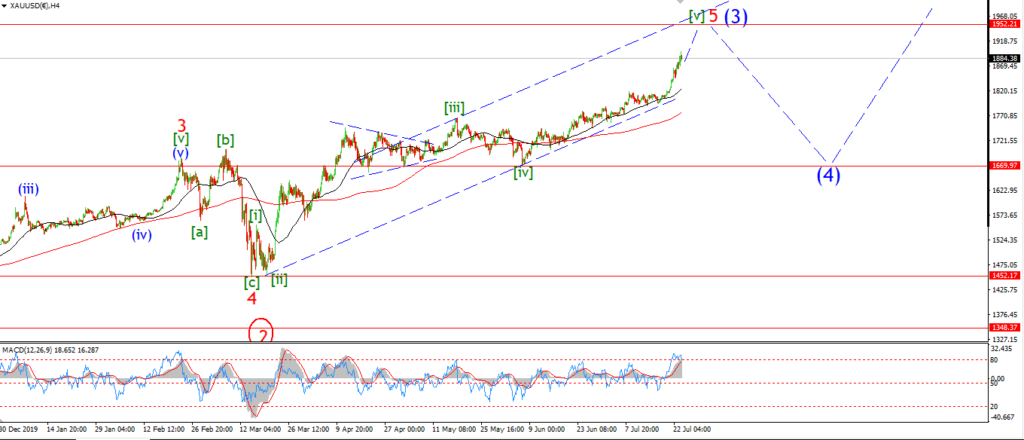
The price has accelerated up towards the upper trend line over the last few days in wave [v] of ‘5’.
But we are not there yet.
Ideally this final thrust higher should reach about 1950 to complete wave (3) at the upper trend channel line.
With that in mind,
I am allowing for this rally in wave [v] green to continue for another few days.
If we do hit that upper trend channel line next week,
then I think we will have a significant top in place in wave (3).
And it will be worth looking at closing out long positions in order to re-buy again at the lows of wave (4) down the line.
Tomorrow;
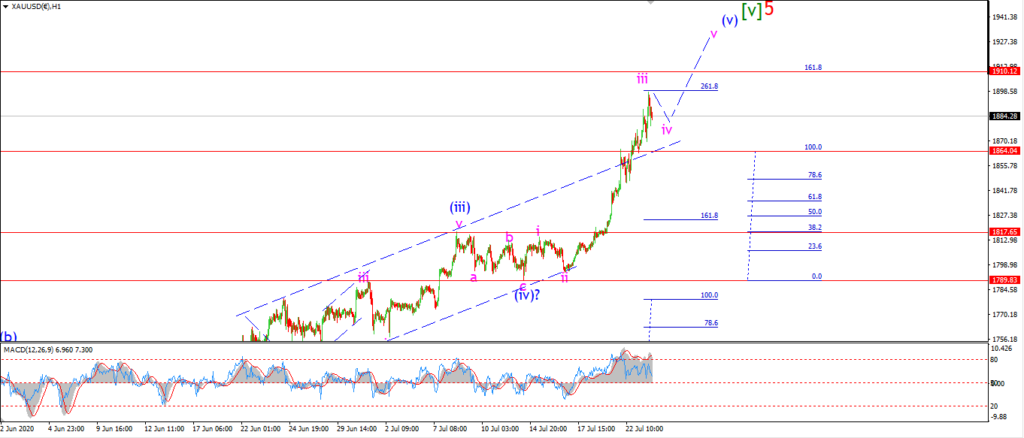
Watch for wave (v) blue to trace out a five wave rally about 1900 again by next week.
Wave ‘iv’ of (v) may well consolidate over the next few days.
CRUDE OIL.
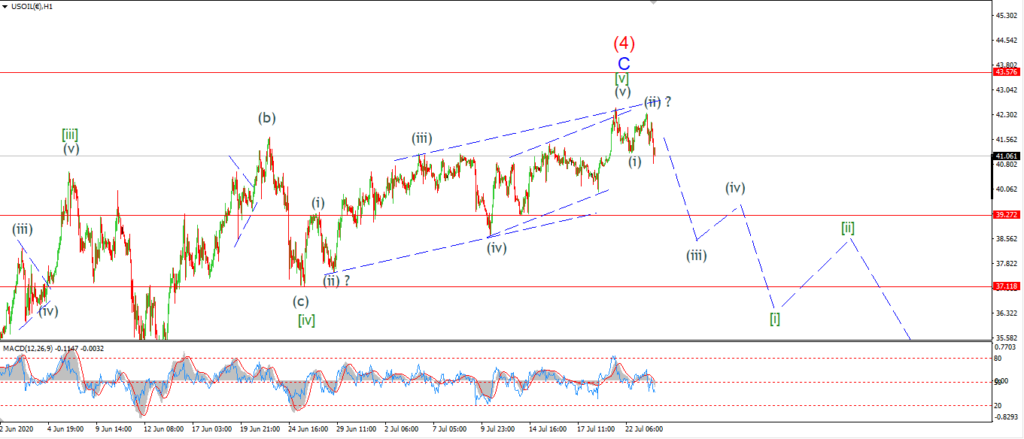
CRUDE OIL 1hr.
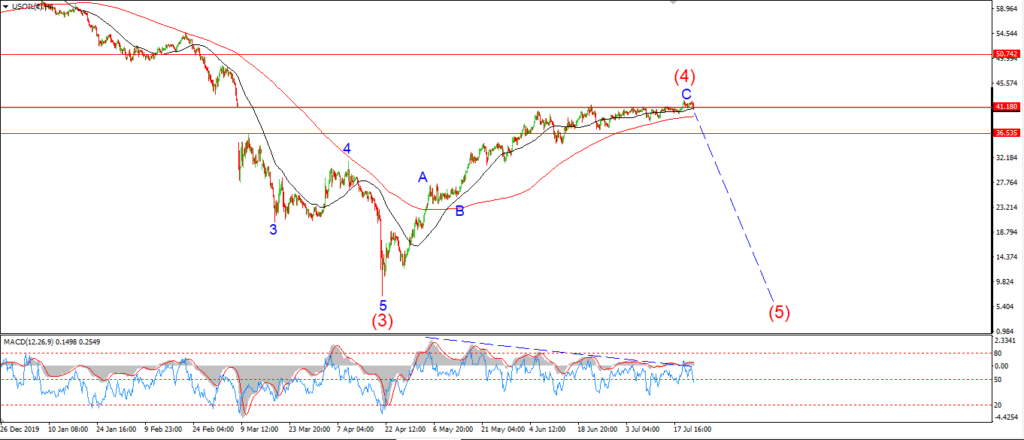
CRUDE OIL 4hr.
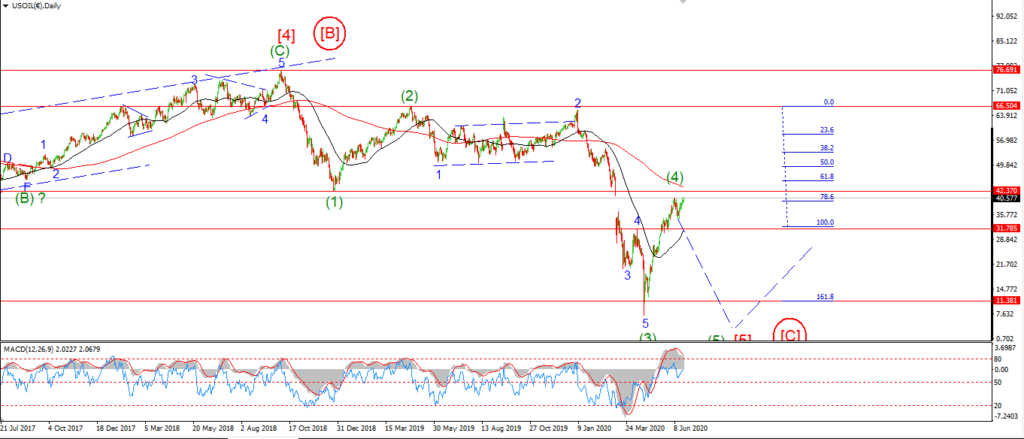
CRUDE OIL daily.
We have hit the upper trend channel line of wave [v] green this week,
and the rally that took us into that level was in three waves.
The pattern over the last few weeks now fits an ending diagonal also.
And the drop off the high is beginning to get interesting again.
It will take a few days to trace out a five wave decline off this high.
But once the price break back below the 40 handle again,
I think that will be a good sign that we are rolling over into another major decline in wave (5).
Tomorrow;
Watch for wave [i] down to continue to develop onve the coming few sessions.
We should be able to identify a significant lower high by next week.
S&P 500.
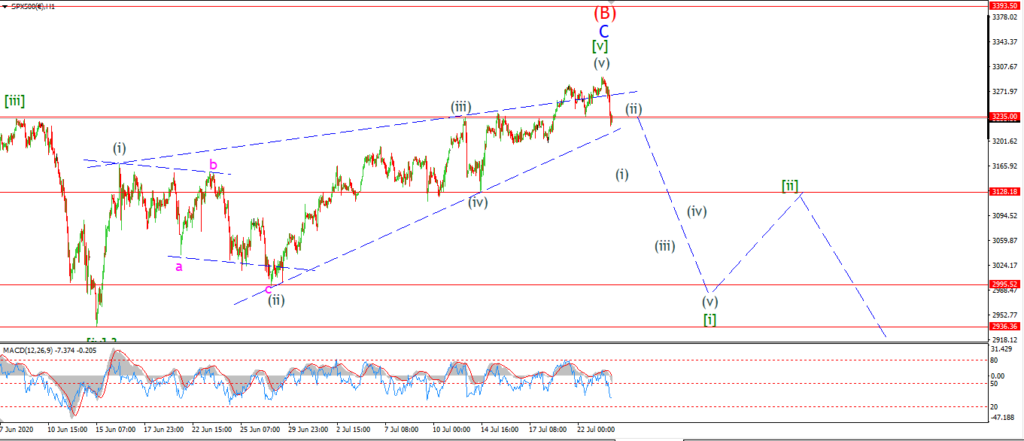
S&P 500 1hr
S&P 500 4hr
S&P 500 daily.
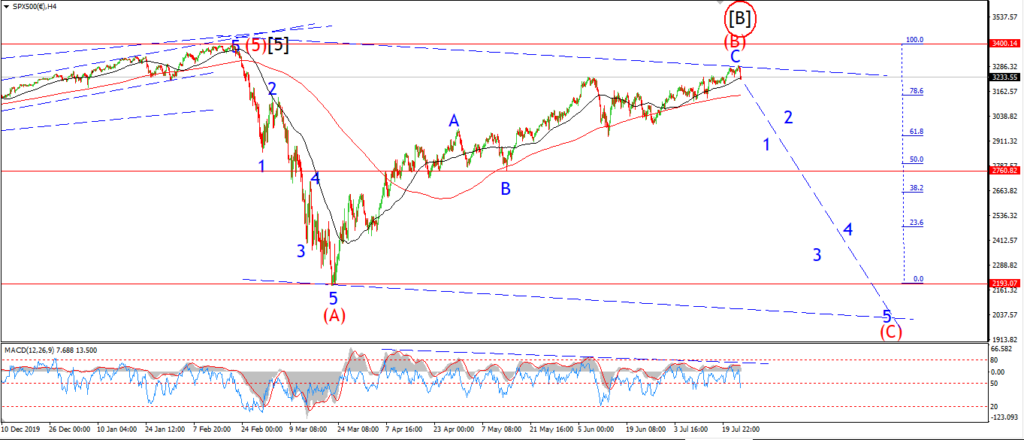
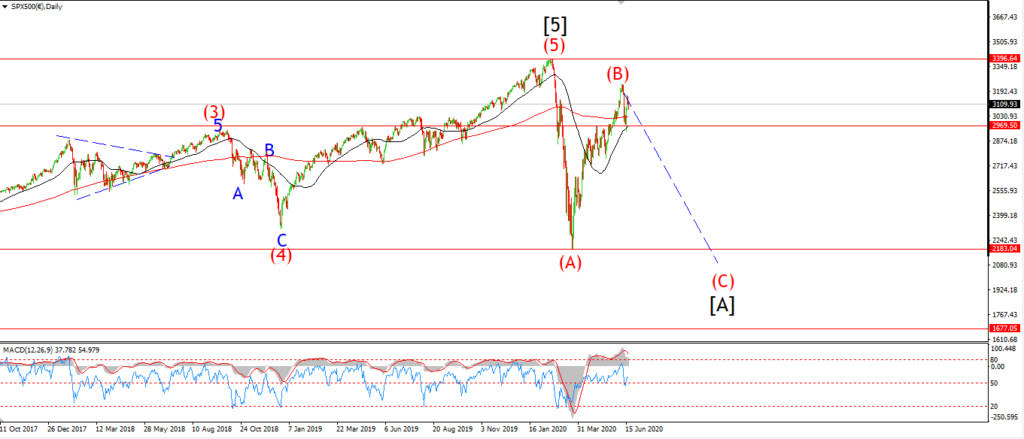
The decline has begun into wave [i] down today!
The S&P topped out above the upper trend line over the last few days.
The market action was weak into that top.
With lagging leadership and breadth over the last month pointing to a truly significant top forming.
Todays action is looking very impulsive to the downside again.
We have a ways to go yet before breaking the previous fourth wave at 3128,
but the market is poised for such a decline now.
If we do see a drop below the 3100 level again in a impulsive pattern,
that will be the confirming price action needed to call a top in place for wave (b).
A drop below 3000 again from here will signal wave (C) down has begun.
Tomorrow;
watch for wave (i) of [i] to continue towards 3128 in five waves.
A lower high in wave (ii) should form early next week.
SILVER.
SILVER 1hr
SILVER 4hr.
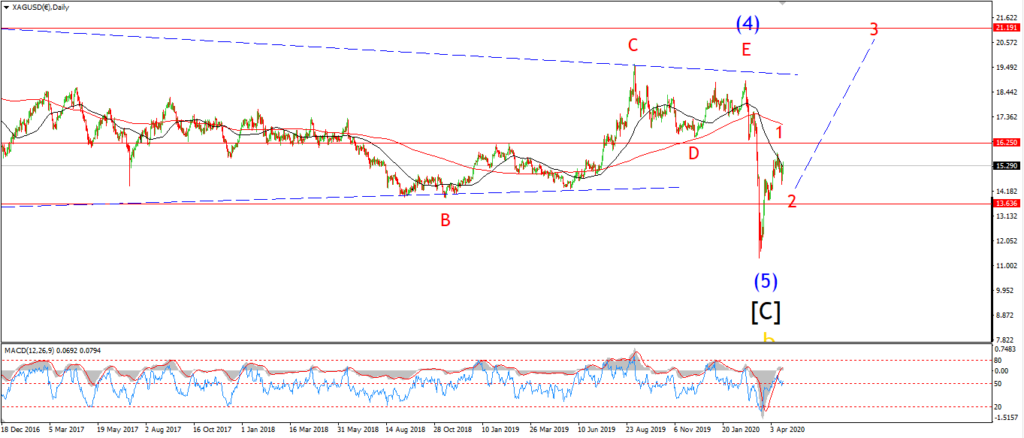
SILVER daily.
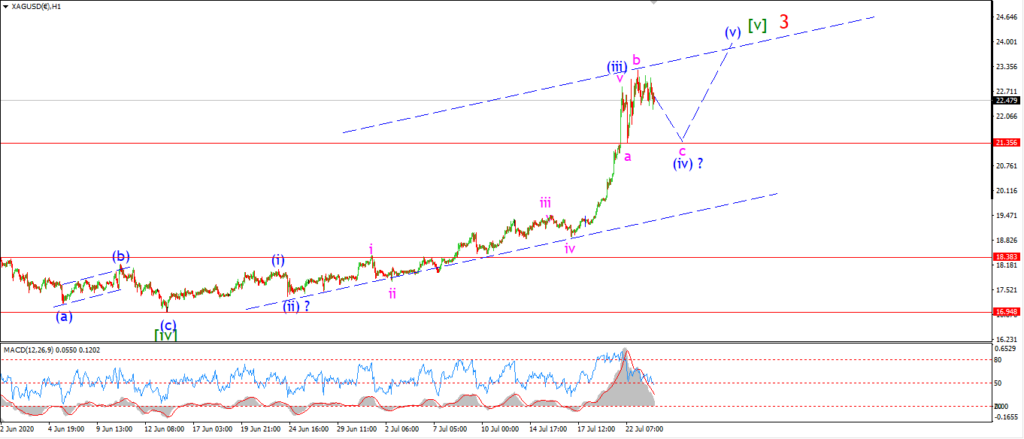
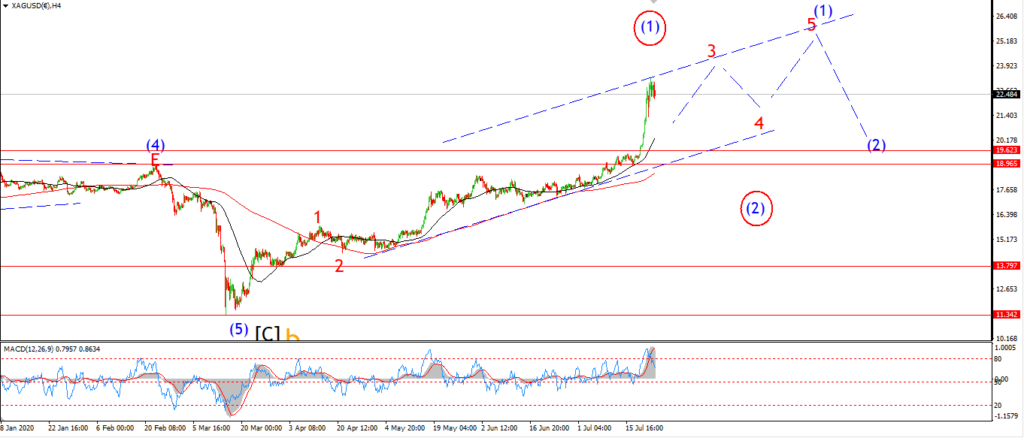
Silver has really out-done itself this week!
And now we have the sort of action in place that I have been looking for to bring this part of the price structure to a close.
Wave (1) up is shown on the 4hr chart.
The rally may not be complete in that wave just yet.
But I suspect that wave ‘3’ of (1) is now closing out.
On the hourly chart I have shown the current top as wave (iii) and (iv) now underway.
There is room for another thrust up in wave (v) of [v] to complete the rally.
And then we can expect a cooling off period in wave ‘4’ again.
Tomorrow;
watch for wave (iv) to complete a three wave correction and at about 21.30 again,
we should see another rally off that low to begin wave (v) up.