
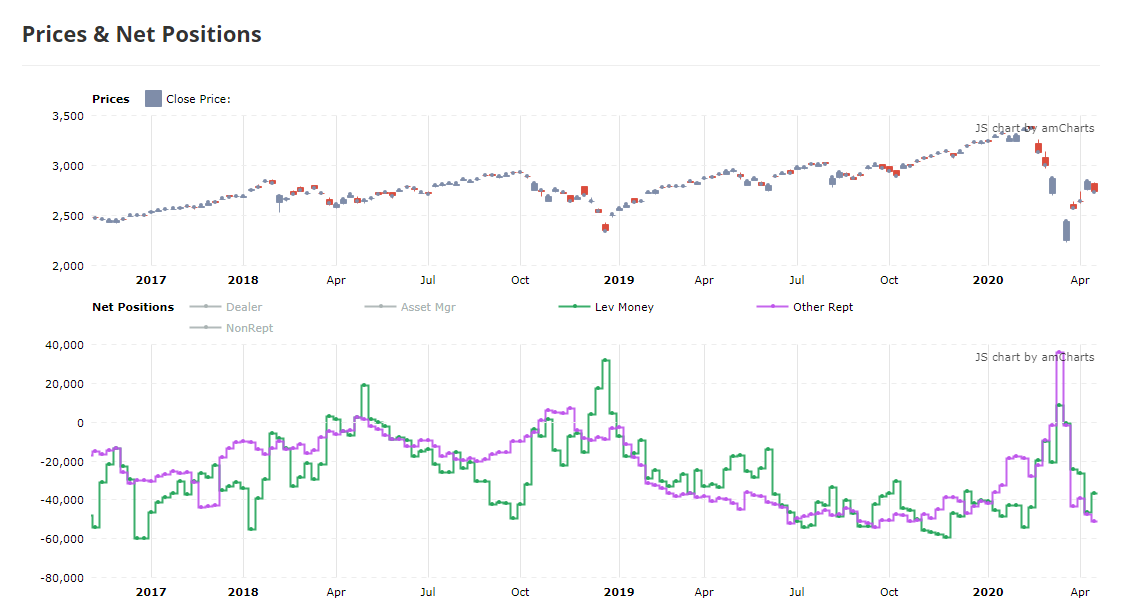
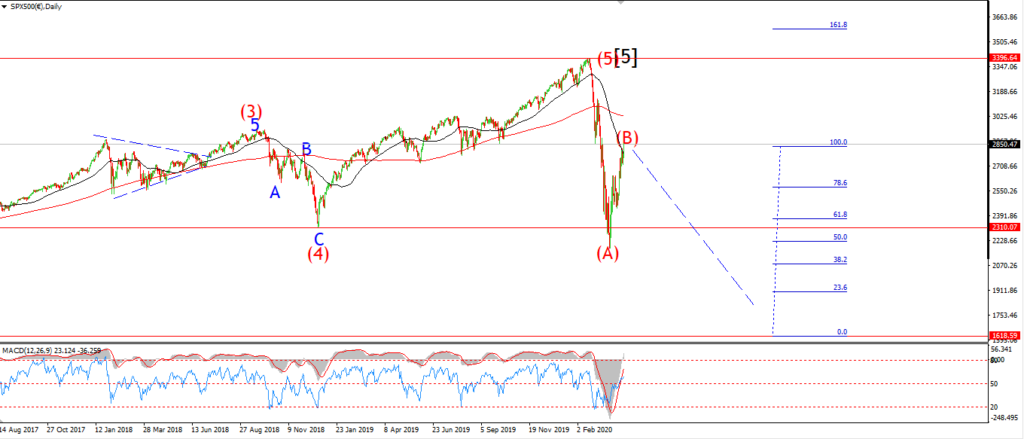
I want to present two charts, without comment, to situate the current bear market rally in a historic perspective.

EURUSD.
EURUSD 1hr.
EURUSD 4hr.
EURUSD daily.
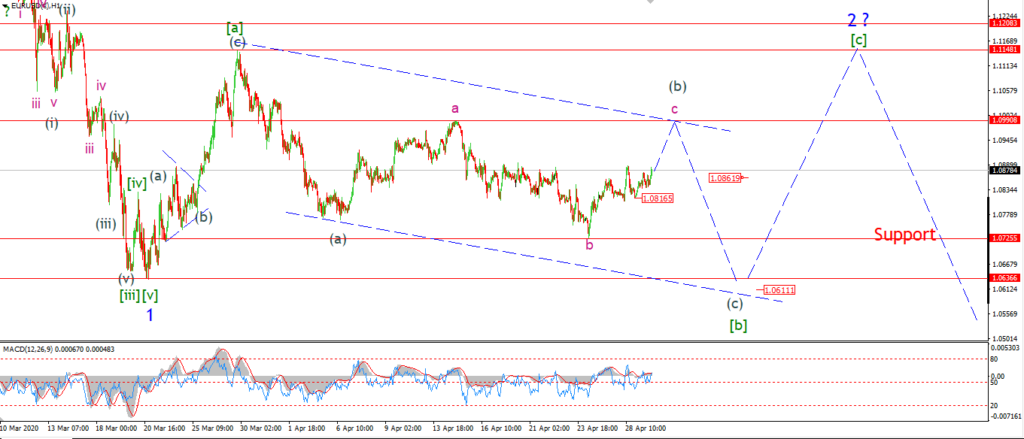
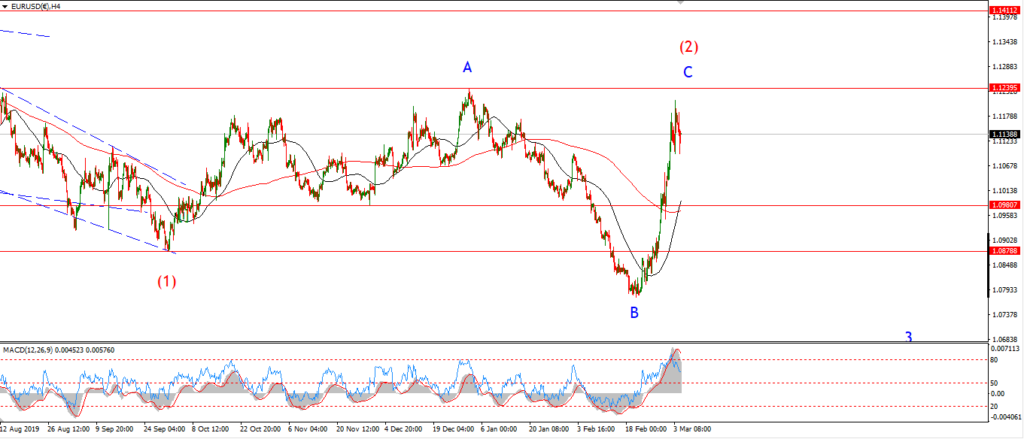
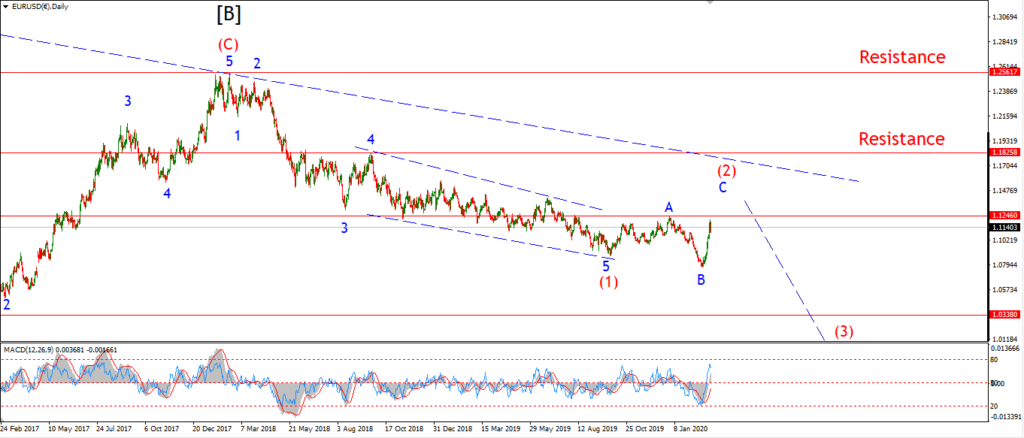
EURUSD is regaining some upside momentum this evening after a stall in progress over the last few days.
Wave ‘c’ of (b) should hit the minimum target at 1.0990 by the end of the week.
And once we have a completed five wave rally into that wave ‘c’ high,
that will signal wave ‘c’ is done.
I will then begin to look lower into wave (c) of [b] next week.
Tomorrow;
Watch for wave ‘c’ to hold above 1.0816 for the remainder of its travel.
1.0990 is the minimum target,
but we could see a higher high if wave (b) is an expanded flat as I suspect.
GBPUSD
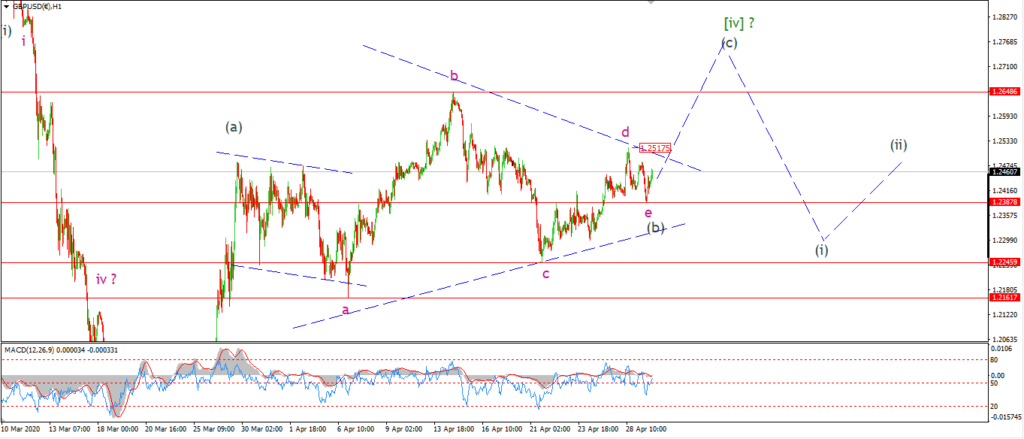
GBPUSD 1hr.
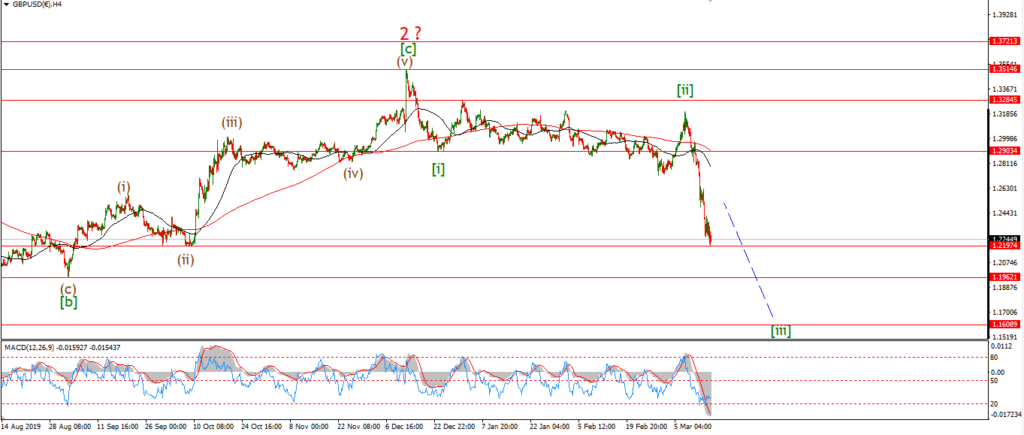
GBPUSD 4hr.
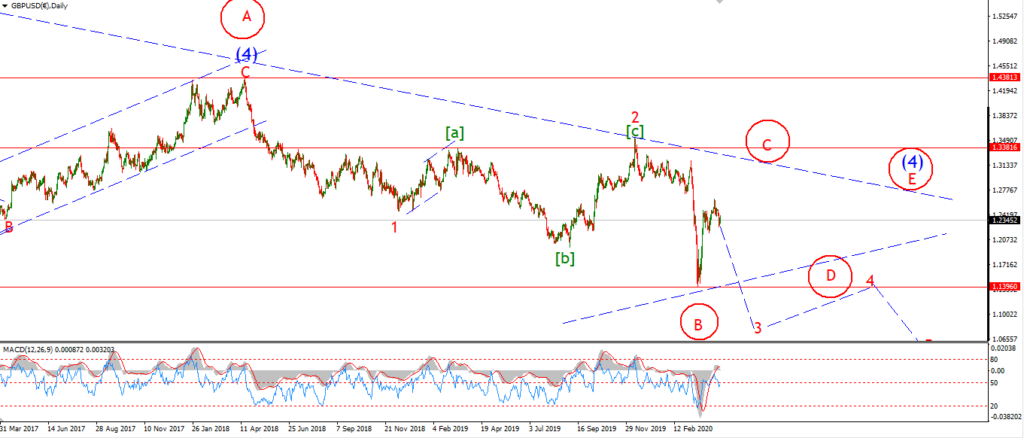
GBPUSD daily.
I have switched to the short term alternate count this evening for cable.
Wave (b) is now viewed as a contracting triangle,
and wave (c) of [iv] should begin off todays lows.
The price fell in a clear three wave form off that 1.2517 high created yesterday.
Wave ‘e’ has held above the rising trend line of the triangle
And this evenings spike to the upside is viewed as the start of wave (c).
Wave (c) should break 1.2648 at a minimum.
Tomorrow;
Watch for wave (c) to continue higher.
A break of 1.2517 should confirm that wave (c) is in force.
Given that the market has failed to fall thus far,
I am also looking at the alternate count on the daily chart.
A break of 1.2903 will trigger that count.
USDJPY.
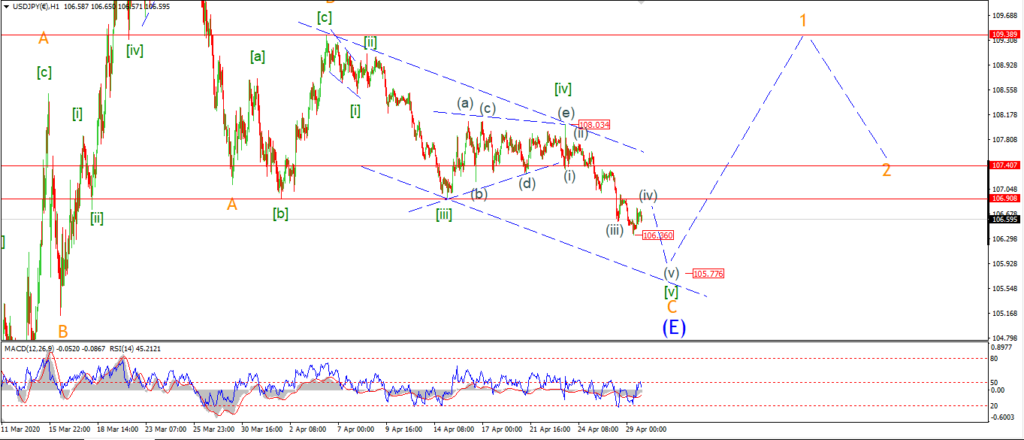
USDJPY 1hr.
USDJPY 1hr.
USDJPY daily.
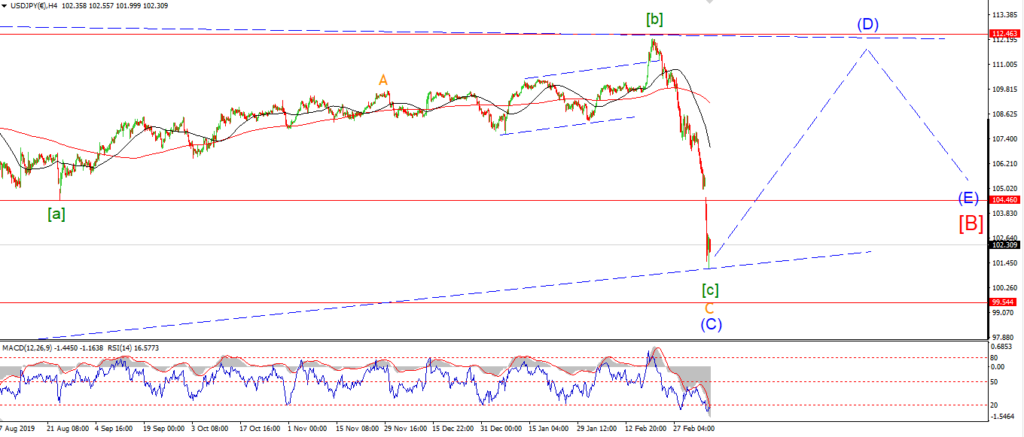
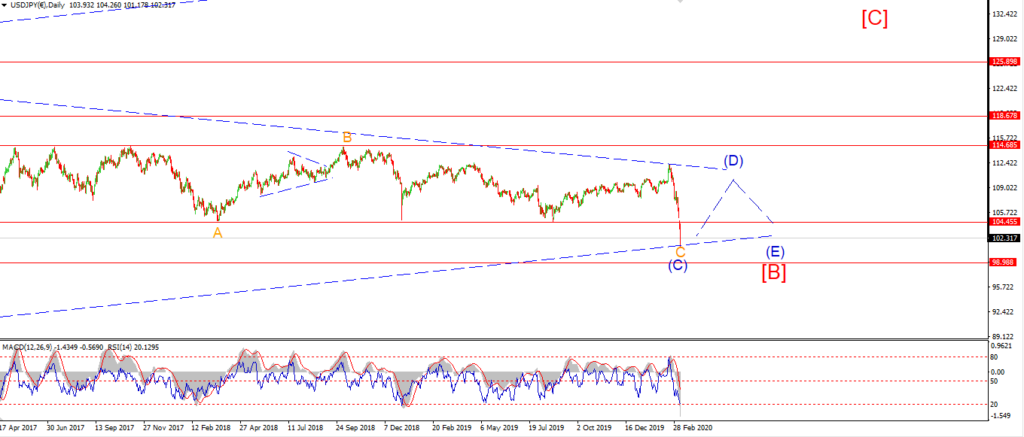
After a brief rise this afternoon, USDJPY is again turning lower this evening.
Wave (iii) created an extension lower yesterday,
and there is a good chance that wave (v) of [v] is extending also.
The lower trend line lies at the 105.50 level,
so wave (v) might drop another 100 pips before finding a low to compelte the pattern.
Tomorrow;
The larger pattern in wave [v] of ‘C’ is drawing to a close now,
watch for a break for 106.36 again to confirm that wave (v) is extending.
DOW JONES.
DOW 1hr.
DOW 4hr
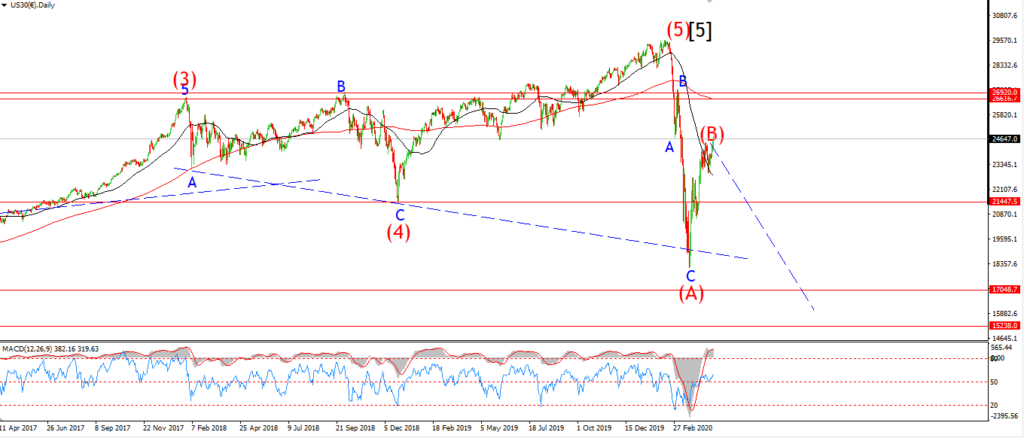
DOW daily.
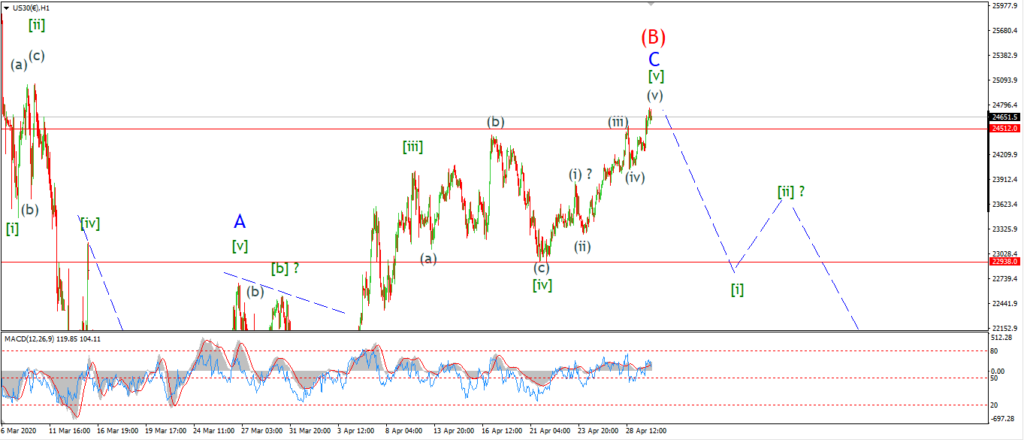
Well that was an interesting day!
The market gaped higher out of the gate this morning,
the main reason given was a promising trial of a sars ncov2 treatment.
I hope that drug will be successful to treat the disease.
But it is not going to save this market.
We already have the numbers for q1 gdp at -4.8%.
But that does not seem to matter at all to so called stock ‘investors’!
Good Lord,
this market is a complete affront to the idea of investing!
Back to the wave structure.
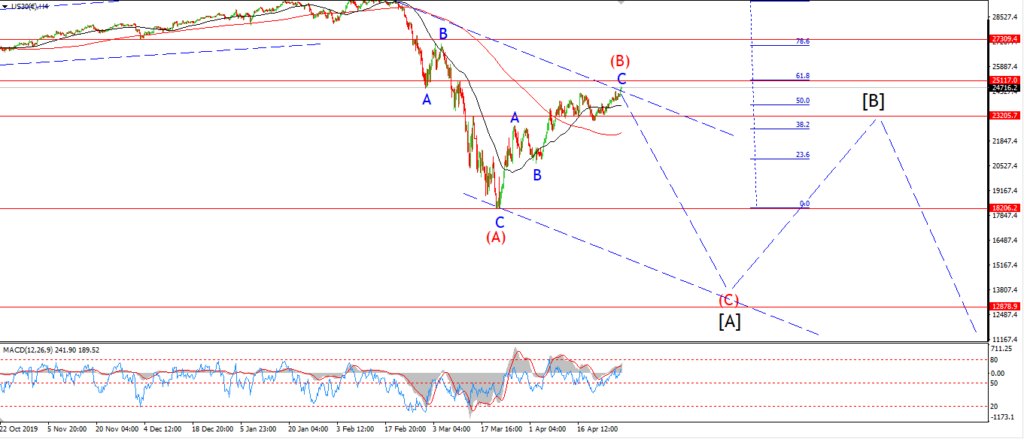
This spike higher is still viewed within the context of wave [v] of ‘C’ of (B).
If this wave is done or not is yet to be seen.
But the upside potential is minimal compared to the downside risk.
By the way,
That was my exact sentiment in early February!
And the market was in a very similar wildly optimistic position at that time too.
Tomorrow;
The last wave down was a test.
The next impusle wave down will be the real thing.
I am still looking for that initial move lower to begin this week.
GOLD
GOLD 1hr.
GOLD 4hr.
GOLD daily.
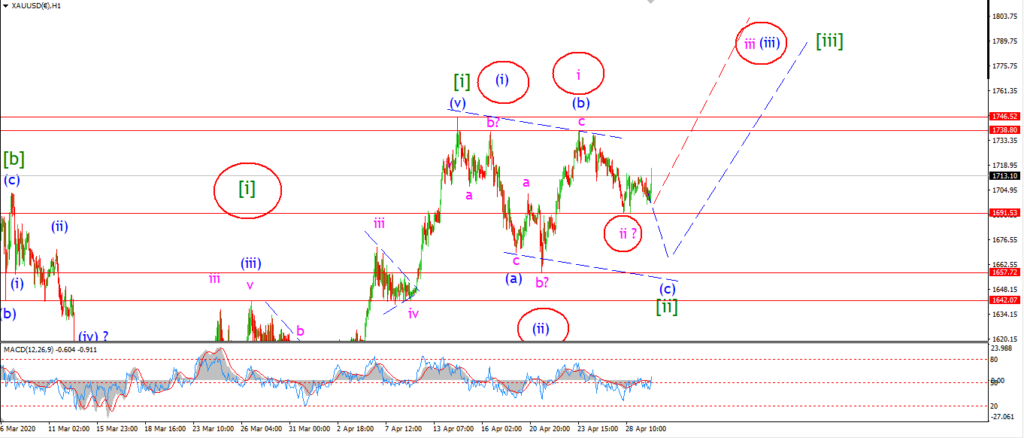
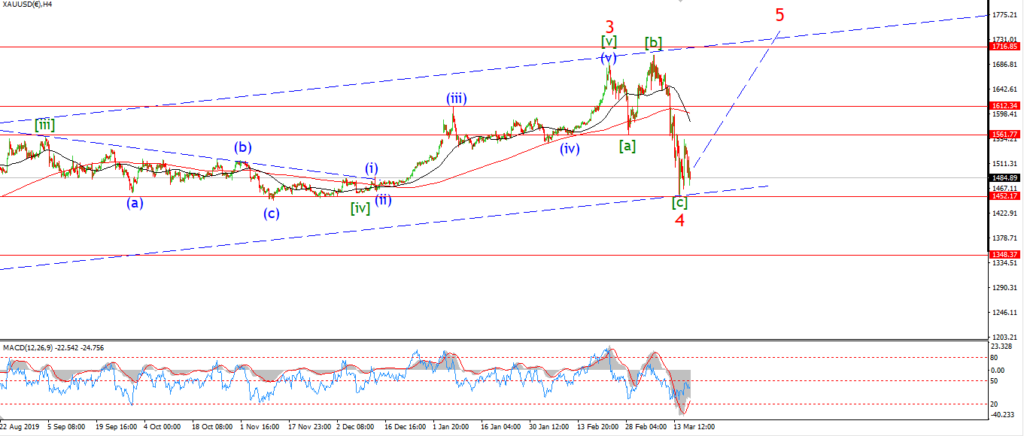
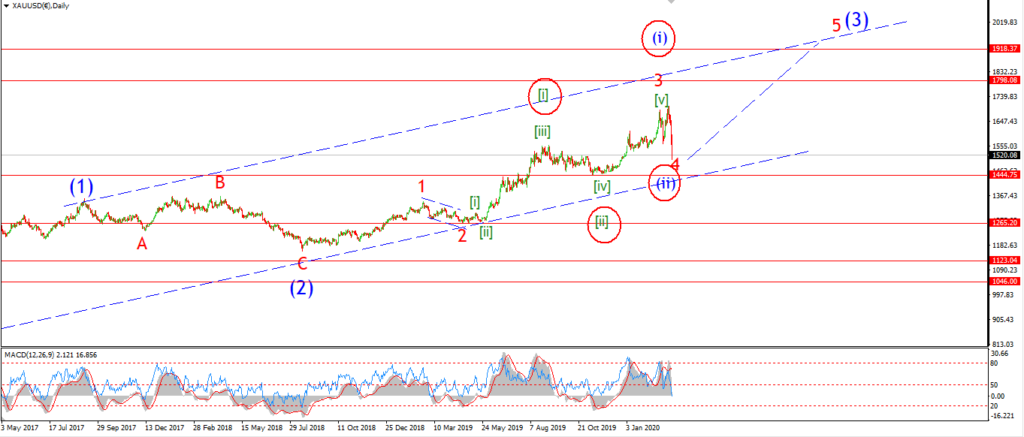
Gold is holding above the weekly low at 1691.50 again today.
The price action is pretty indecisive above that level so far though,
so I cant make any judgement on whether we are moving up in wave ‘iii’ yet.
I will be very happy to turn immediately bullish with a break of 1746.
but until that happens,
I have to allow for the possibility that wave (c) is yet to drop to a new low
and complete wave [ii] in the area of 1657 again.
Tomorrow;
A break of that short term support at 1691 will confirm wave (c).
Lets see if that happens tomorrow.
CRUDE OIL.
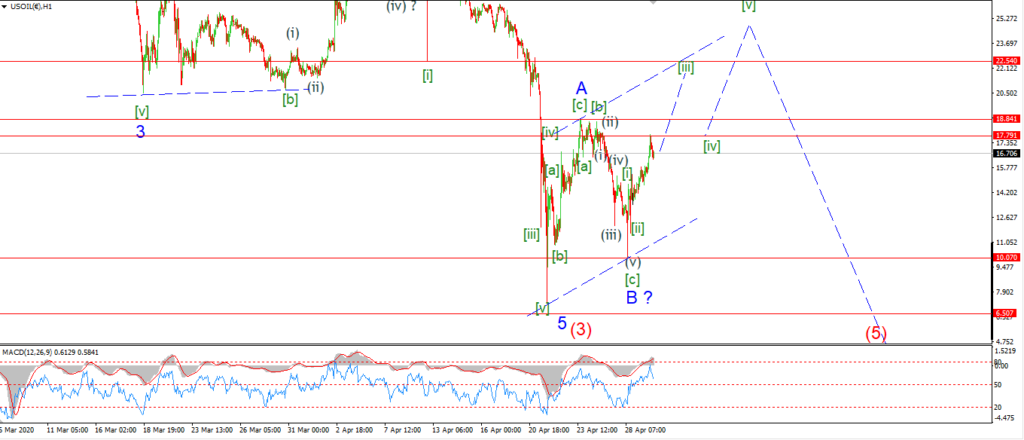
CRUDE OIL 1hr.
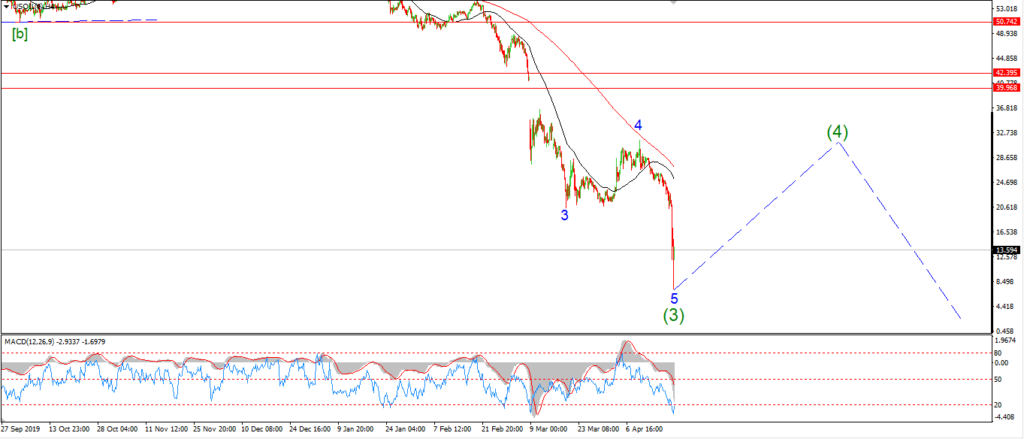
CRUDE OIL 4hr.
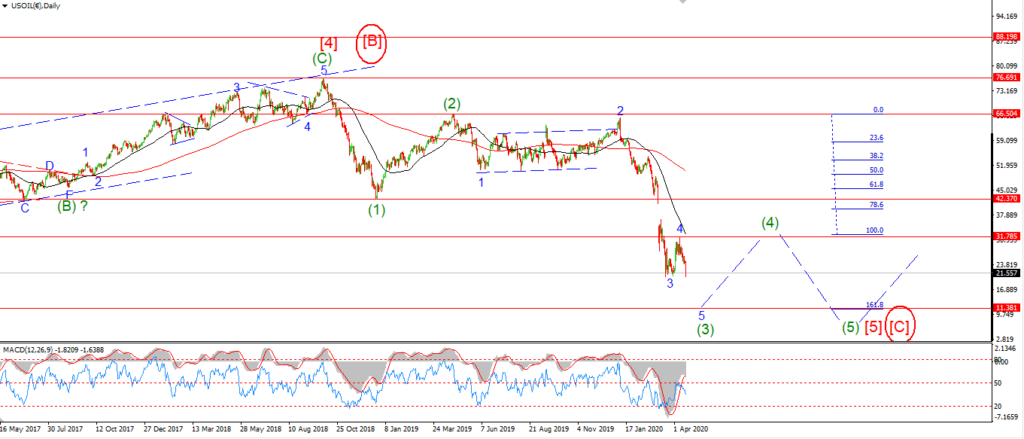
CRUDE OIL daily.
Crude oil pushed to a high at 16.78 today.
This action is in line with the idea that wave [iii] of ‘C’ is now underway.
But I want to see price hold above the wave [i] low at 12.65 cash now.
A break of that level will cast doubt on any further rally.
And I may have to look lower into wave (5) again.
Tomorrow;
This evenings drop off the high can be viewed as a correction within wave [iii].
in that case we should see a further rally above 16.78 again tomorrow.
I would like to see wave [iii] break above the 18.00 handle before wave [iv] begins.
S&P 500.
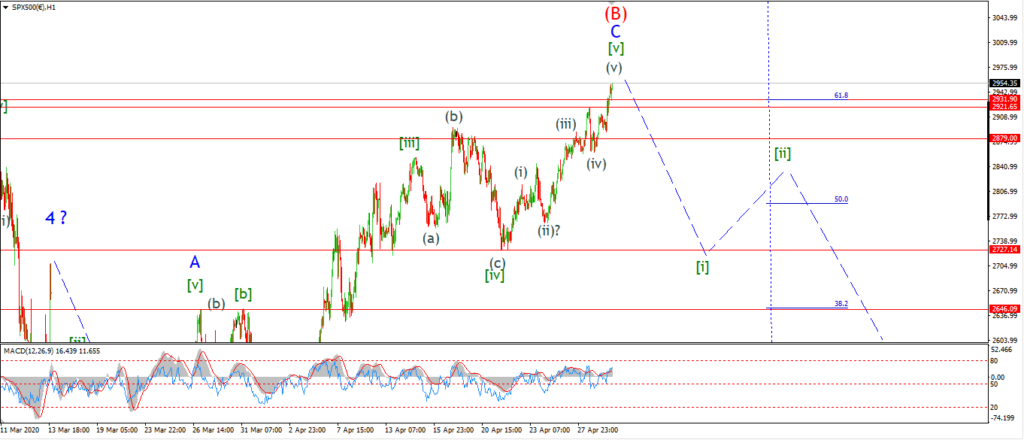
S&P 500 1hr
S&P 500 4hr
S&P 500 daily.
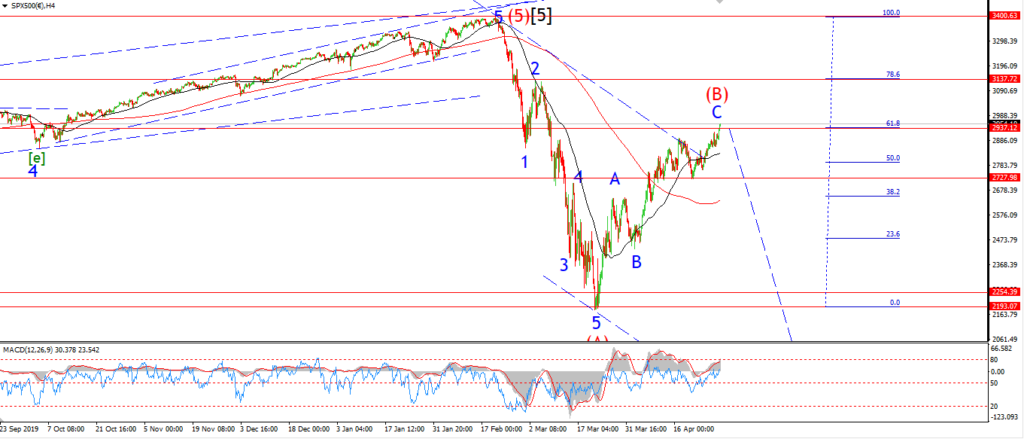
If you look at the 4hr chart this evening,
you can see that upside momentum is diverging in a worrying but familiar pattern.
Momentum peaked at the high of wave ‘A’ on the 26th of March,
and we have been slowing off that high ever since.
And we can see that todays high has just popped above the 62% retracement level.
This is another signal to add to the growing list of bearish indicators now.
Tomorrow;
We have a solid left shoulder in place now at the wave [iv] low of 2727.
That is a good distance lower than todays highs,
but wave [i] of ‘1’ of ‘C’ should have no trouble taking out that low.
Lets see if we get the initial move lower into wave [i] tomorrow.
SILVER.
SILVER 1hr
SILVER 4hr.
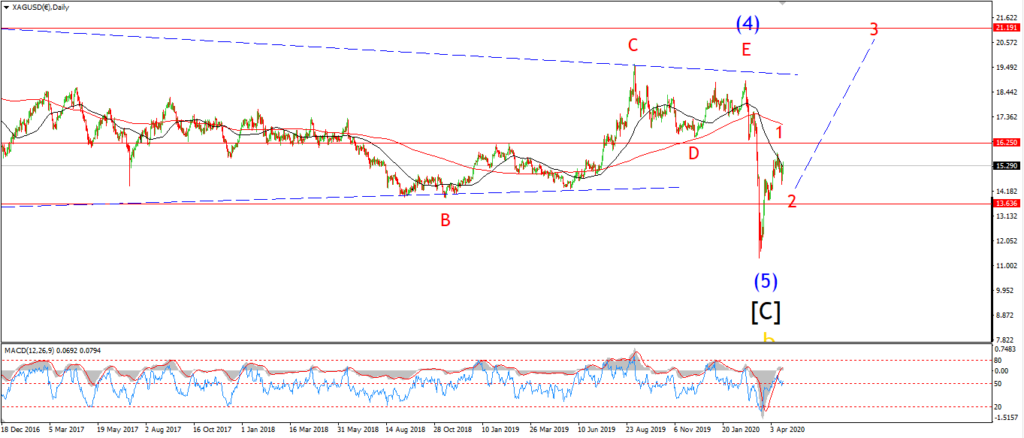
SILVER daily.
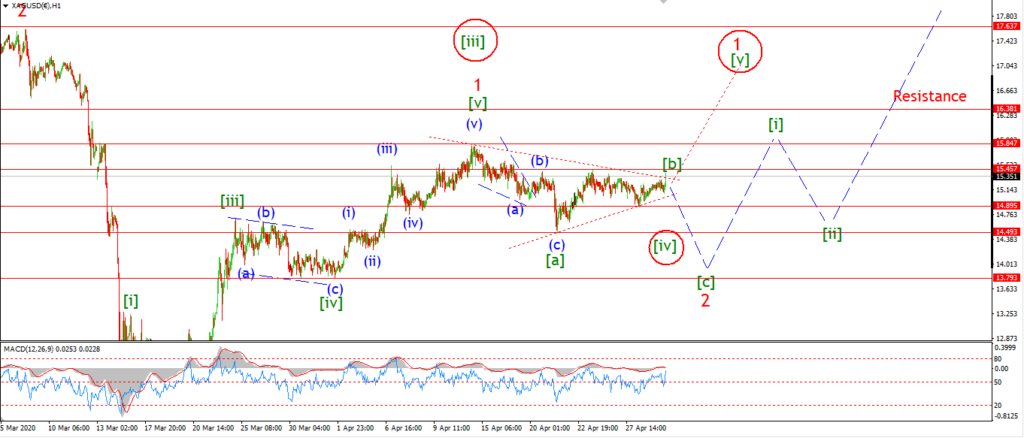
I have introduced another short term alternate count this evening.
This is shown circled in red,
and it views the contraction in range over the last few weeks as a possible triangle in wave [iv].
This is a very plausible idea given the action.
And I will switch to this count if we break above 15.84 again.
As for the main wave count,
this count is still a little more cautious at this point.
Wave [b] can also be viewed as a contracting triangle,
or a smaller flat correction higher.
Wave [b] must complete below 15.84 though for this to remain valid.
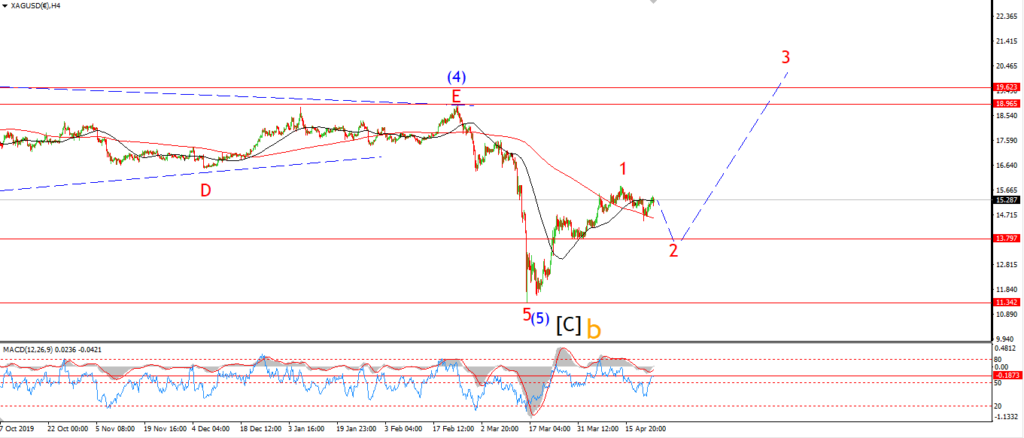
Tomorrow;
Watch for wave [c] to begin with a break of the 15.00 handle again.