
Good evening folks.
I came across a few article on zerohedge today that will fill in the gaps on the technical side of the stock market rally.
If you were wondering why the market was rallying into an increasingly depression like scenario, well these articles should clear that up!
https://www.zerohedge.com/markets/morgan-stanley-spots-something-very-strange-about-rally
https://www.zerohedge.com/markets/nomura-nothing-more-giant-bear-squeeze-rally
EURUSD.
EURUSD 1hr.
EURUSD 4hr.
EURUSD daily.
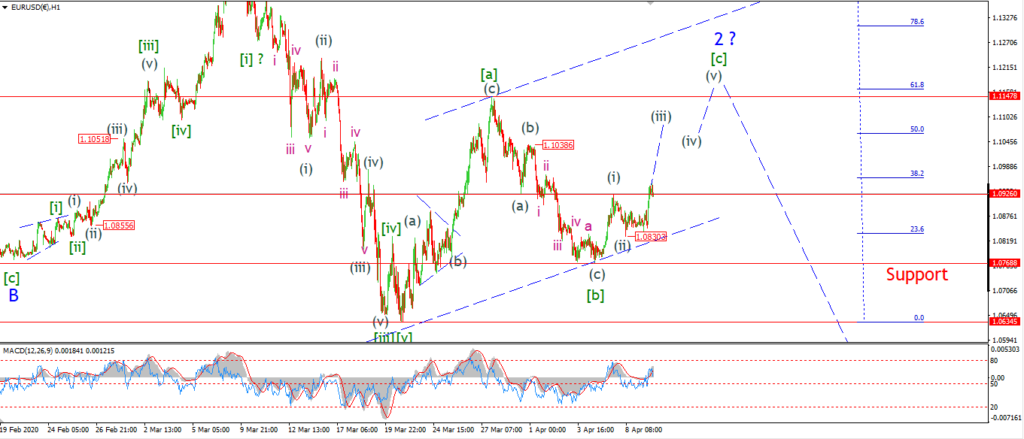
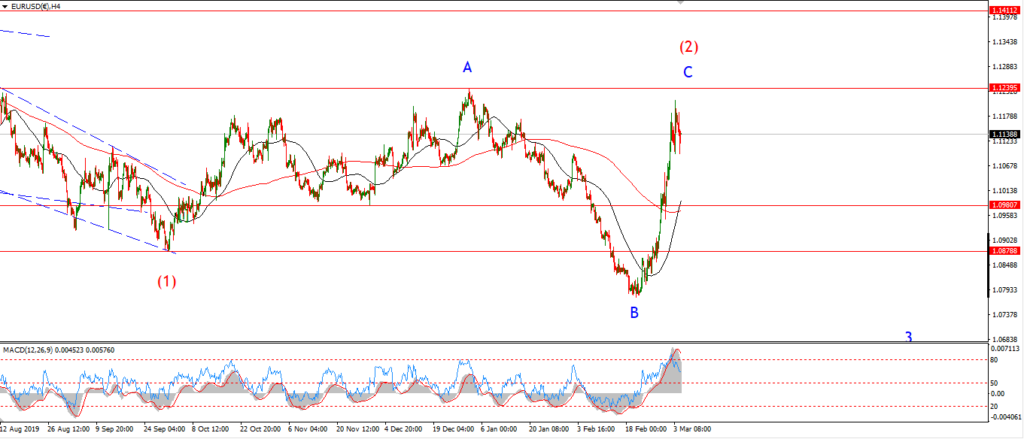
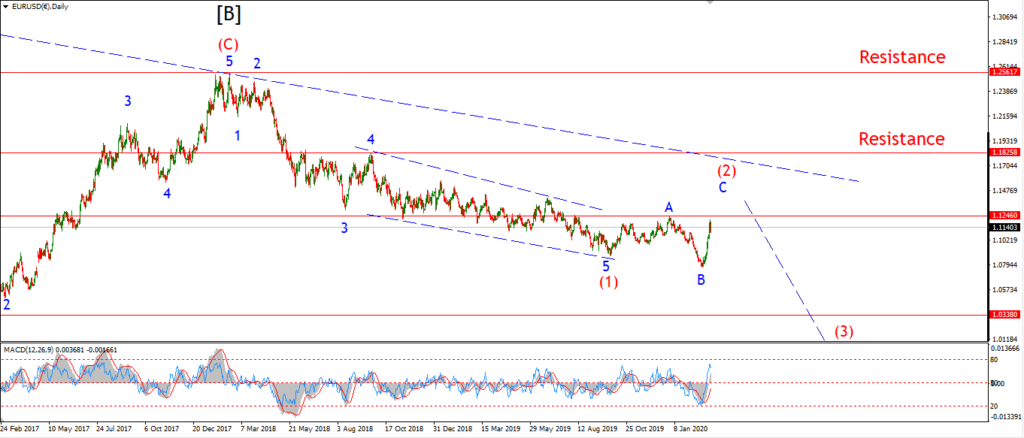
I have switched to the alternate count this evening after the action turned against the immediately bearish outlook.
The trigger level for the alternate count was at the 1.0926 level.
This level has just broken,
and with that the balance of probabilities has shifted in favor of a larger wave ‘2’.
Wave [b] of ‘2’ is now set at the recent low of 1.0768.
And the move off that low is viewed as wave [c] underway.
Wave [c] should trace out a five wave move higher over the coming days.
With the initial target for wave [c] at 1.1147.
This is the high of the previous wave [a].
Tomorrow;
Watch for wave (ii) of [c] to hold at 1.0830.
Wave (iii) is set to break 1.1038 before correcting in wave (iv).
GBPUSD
GBPUSD 1hr.
GBPUSD 4hr.
GBPUSD daily.
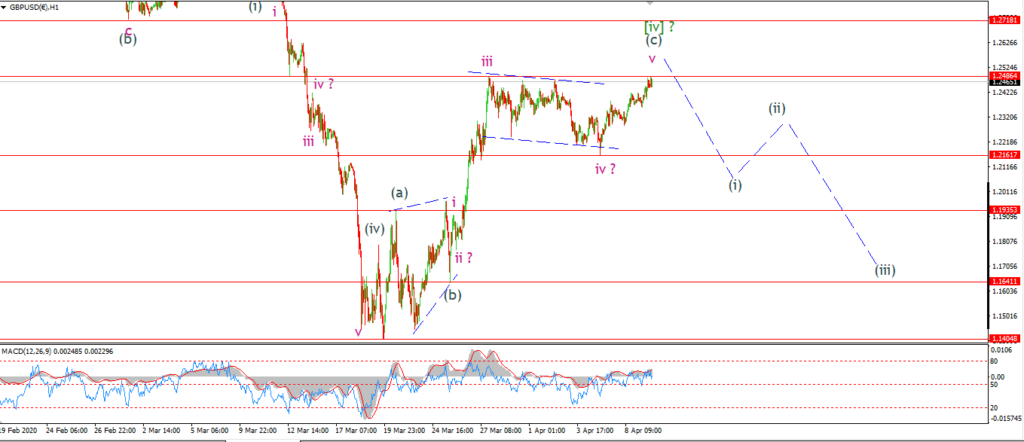
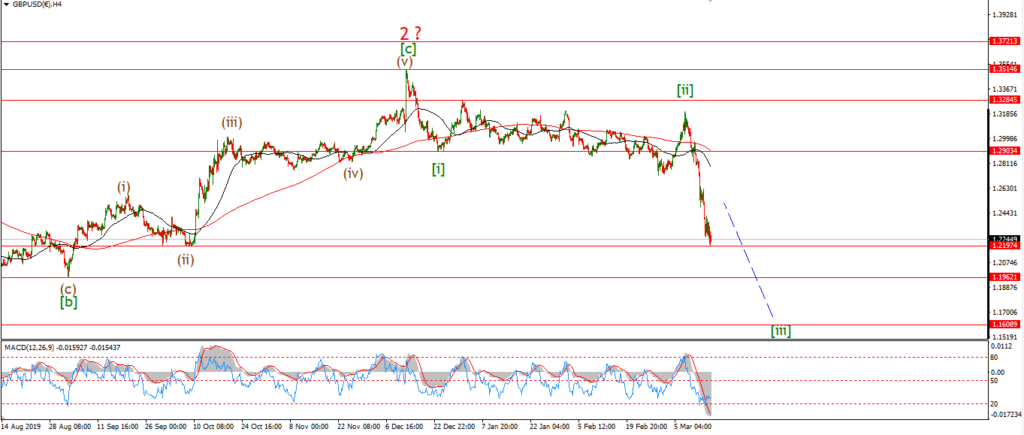
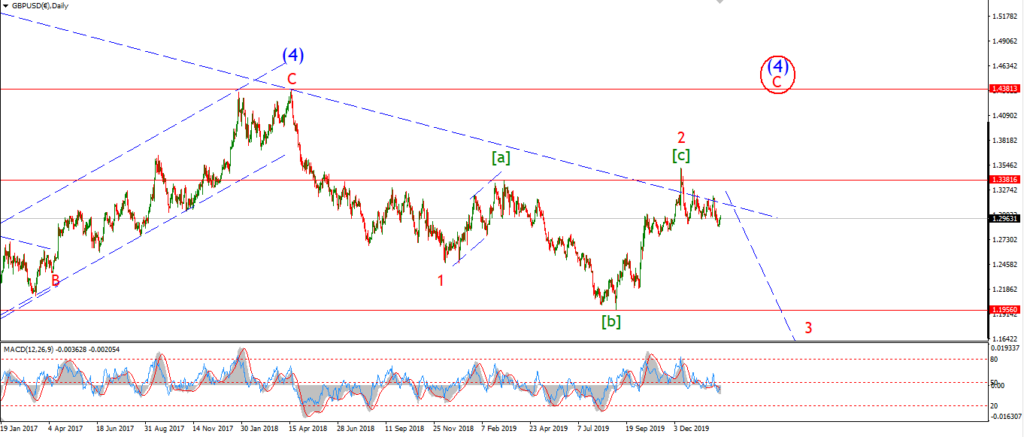
Cable came within 13 pips of hitting the target for wave ‘v’ so far today.
The price should break above the wave ‘iii’ high at 1.2486 to complete the pattern correctly.
And once that happens,
I will begin to look lower again in that long awaited wave [v] green.
Tomorrow;
Wave [iv] should close out early in the session, if not in the overnight session.
The main level to watch from here is the previous fourth wave at 1.2161.
A drop below that level again will signal wave [v] has begun.
USDJPY.
USDJPY 1hr.
USDJPY 1hr.
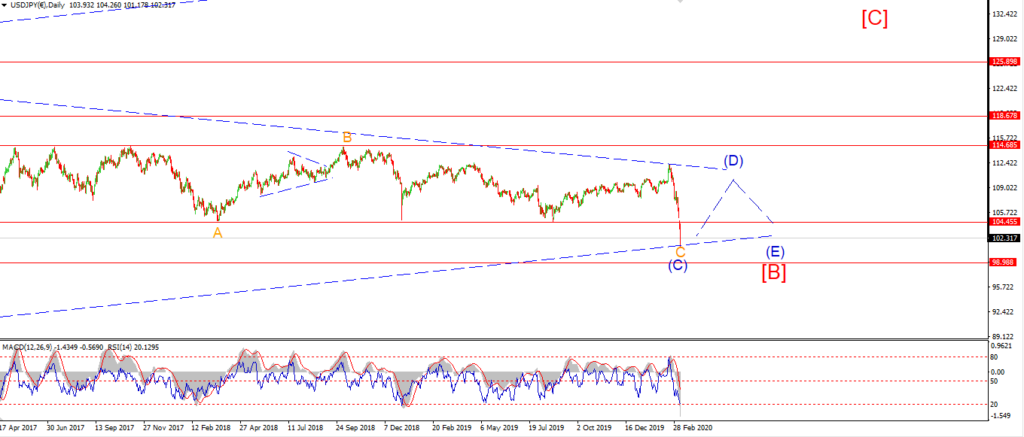
USDJPY daily.
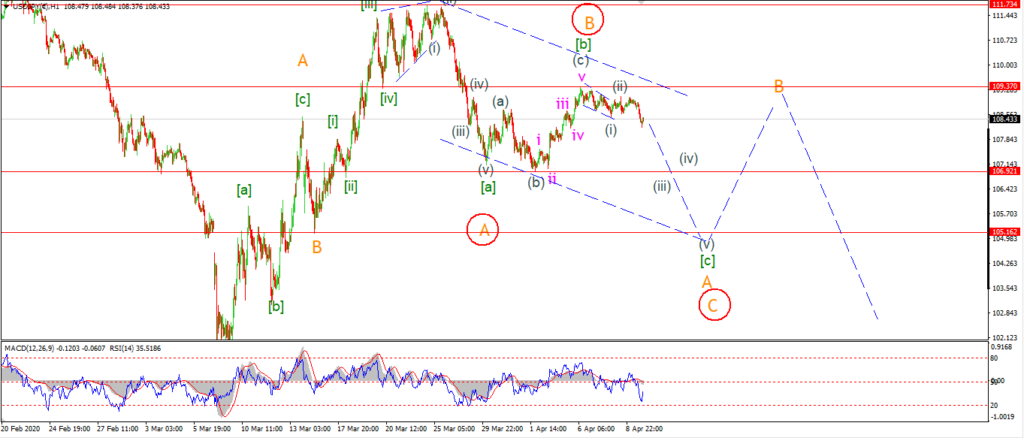
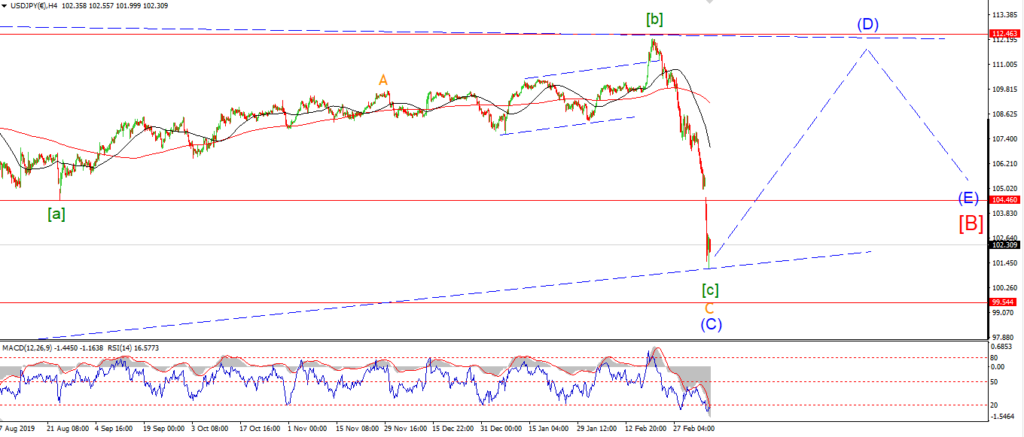
The slight shift to the downside in USDJPY today has opened up the possibility that wave [c] has begun.
The action is still a little shady of late,
but I can view the developing decline off the wave [b] high as a leading diagonal wave (i),
and then todays drop as the beginning of wave (iii).
The price needs to drop more tomorrow and break 106.92 in order to confirm this view,
but this is a good start.
Tomorrow;
watch for wave (iii) down to push lower.
Wave (ii) must hold at 109.10.
DOW JONES.
DOW 1hr.
DOW 4hr
DOW daily.
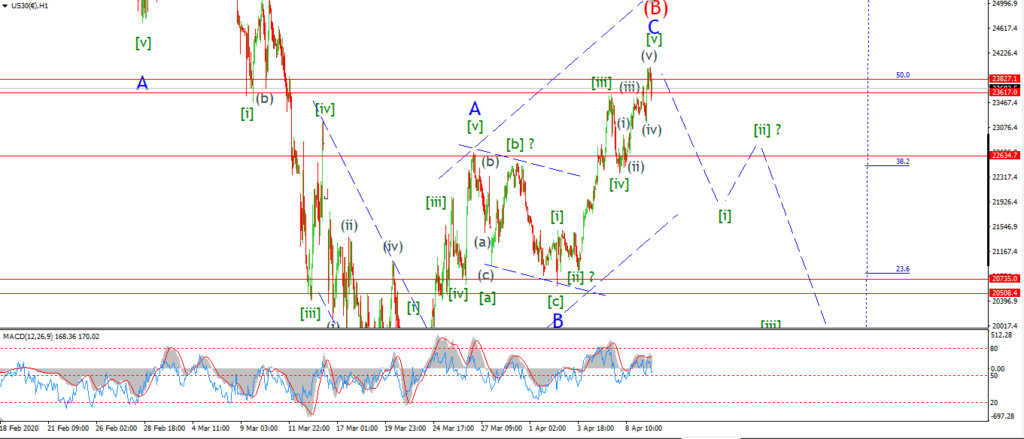
The DOW followed the S&P higher today and broke above the previous high at 23617.
This is viewed by some as a confirmation that the worst is over,
but of course that view will be propagated near a corrective high.
I always remember the old adage,
‘its the job of the market to fool as many people as it can as often as it can’
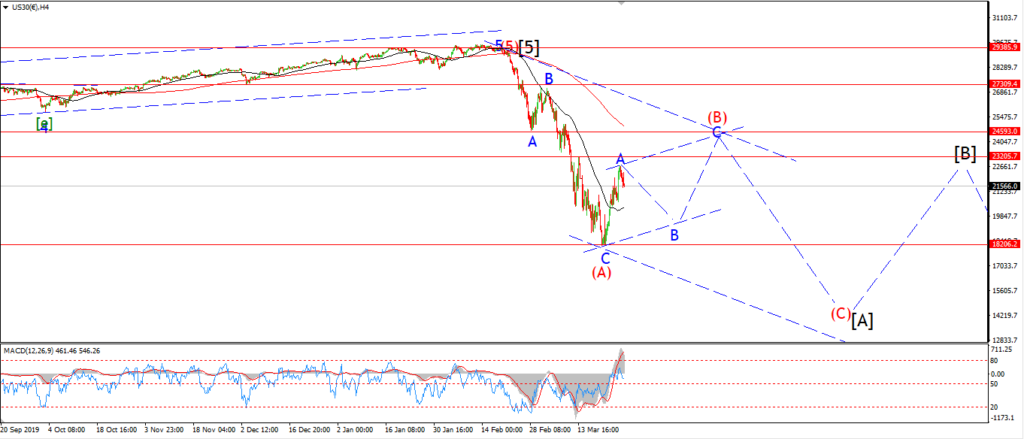
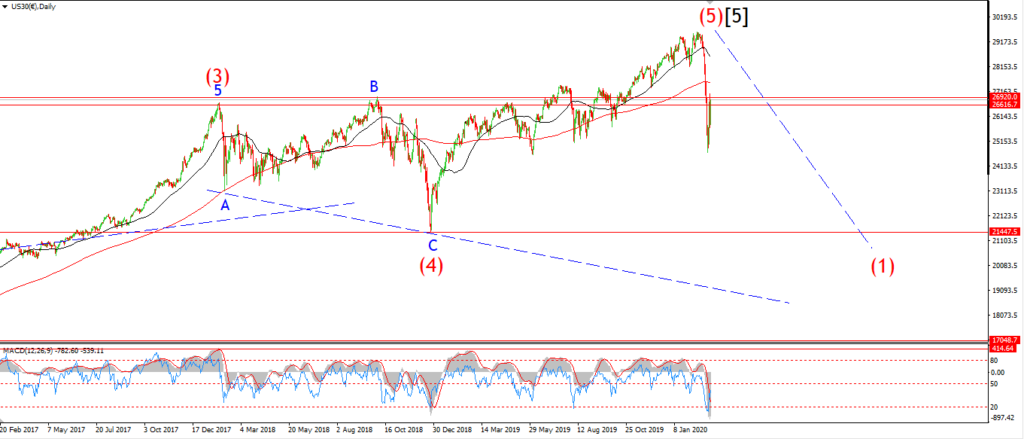
Wave (B) has ticked that box now after rallying back into a technical bull market over the last few weeks.
But,
the internals of this rally are pretty horrible as it stands,
as mentioned in the links above,
this rally has all the hall marks of a clearing rally.
Where frantic moves higher are caused by a raft of short covering.
Not by a raft of new buying entering the market.
I have shown a pretty compelling short term wave count tonight.
The final leg up into todays highs is viewed as wave [v] of ‘C’ of (B).
This rally has traced out a reasonable five wave pattern internally.
So as it stands,
we have a completing wave counts at lower and lower degrees of trend.
The market could push a little higher,
but this rally is running on fumes now.
And the hole is beginning to open up below us again!
tomorrow;
watch for this final leg up in wave [v] to close out,
and with that the whole three wave correction in wave (B).
If wave [i] down does not begin tomorrow,
then next week is looking like a serious down week!
GOLD
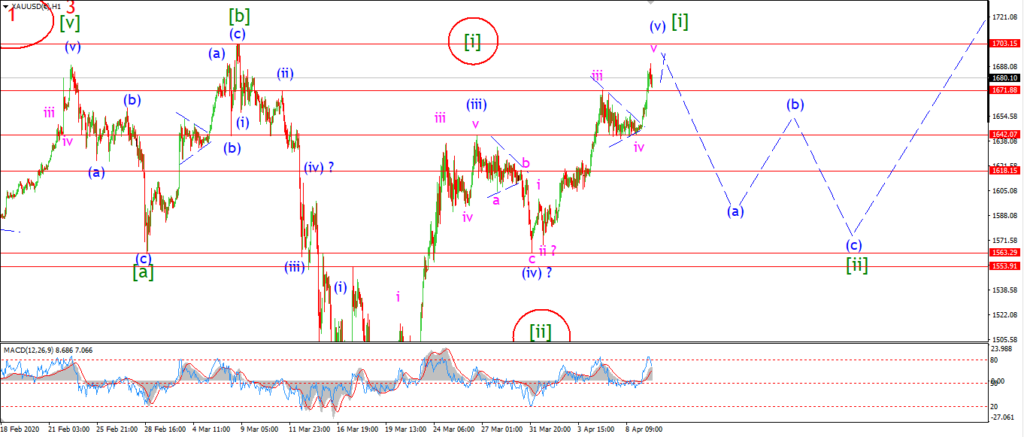
GOLD 1hr.
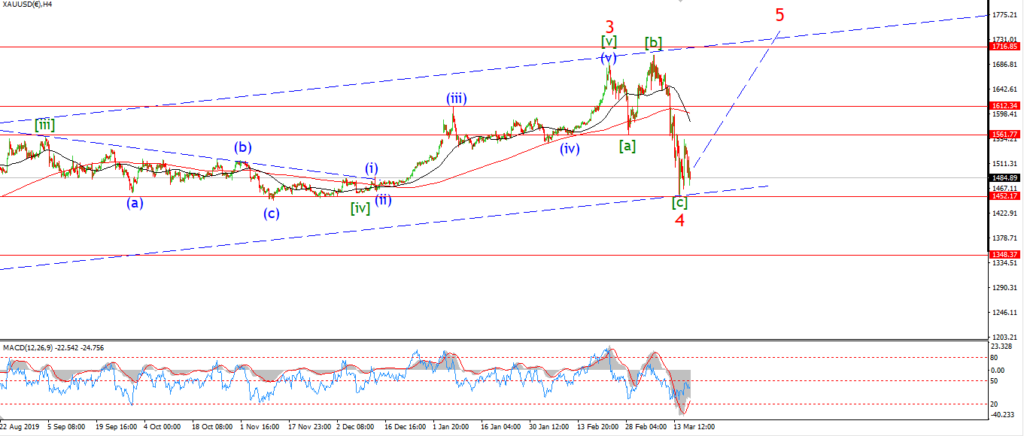
GOLD 4hr.
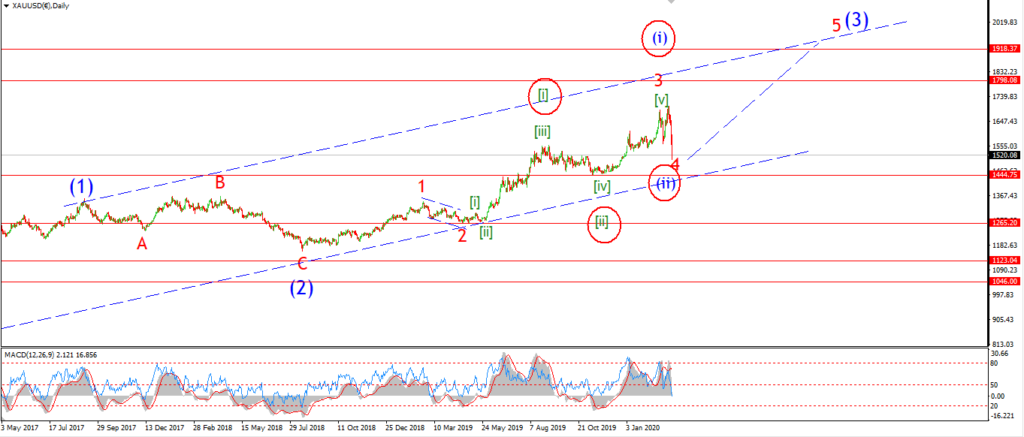
GOLD daily.
After a five wave rally over the last few weeks,
gold is now back in spitting distance of the recent 1700 highs.
Last nights chart viewed the correction in wave ‘iv’ as a triangle,
and today the price pushed higher out of that triangle again.
This rally is viewed as wave ‘v’ of (v) of [i].
Wave ‘v’ is close to completing now,
but as I said before,
I would like to see a break above 1703 to confirm the bullish count.
We will see if that happens or not.
If the price falls from here and breaks 1640 again,
that will signal wave [ii] has begun.
And we can expect a three wave correction to continue lower back towards the 1550 level again.
Tomorrow;
Watch for wave ‘v’ of (v) to complete.
A break of 1640 again will signal wave (a) of [ii] has begun.
CRUDE OIL.
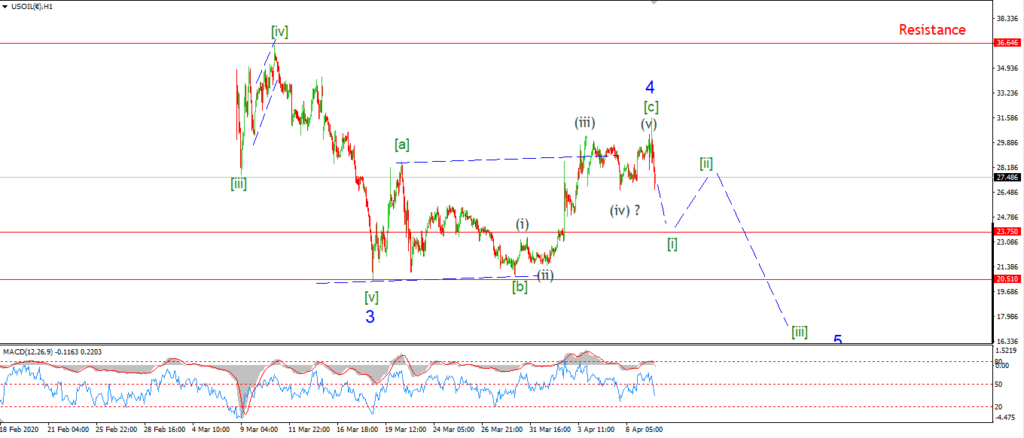
CRUDE OIL 1hr.

CRUDE OIL 4hr.

CRUDE OIL daily.
The action in crude over the last few days has forced me to switch to the alternate count this evening.
This simply means the correction over the last few weeks is now viewed at one degree higher as wave ‘4’ blue.
For some reason my chart has not reflected this action as it normally does.
I will have to look into that tomorrow.
The low of the session today reached 23.75.
This move has confirmed the shift down into wave ‘5’ blue as shown.
Todays sharp move is labelled as wave [i] of ‘5’,
so there is more downside to come as the pattern develops.
Tomorrow;
Wave [i] will find a low soon enough.
Wave [ii] should then create a bearish lower high below that wave ‘4’ high at 28.36 cash.
That will leave wave [iii] of ‘5’ free to fall to fresh lows by the end of next week.
S&P 500.
S&P 500 1hr
S&P 500 4hr
S&P 500 daily.
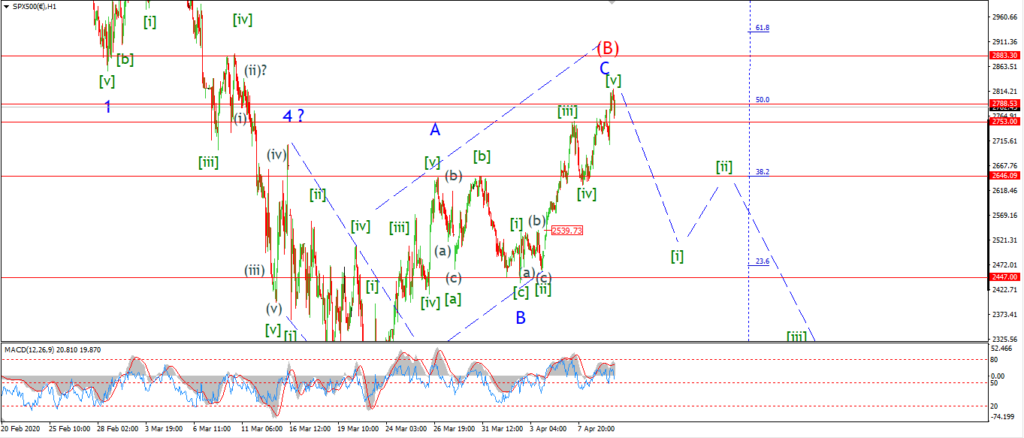
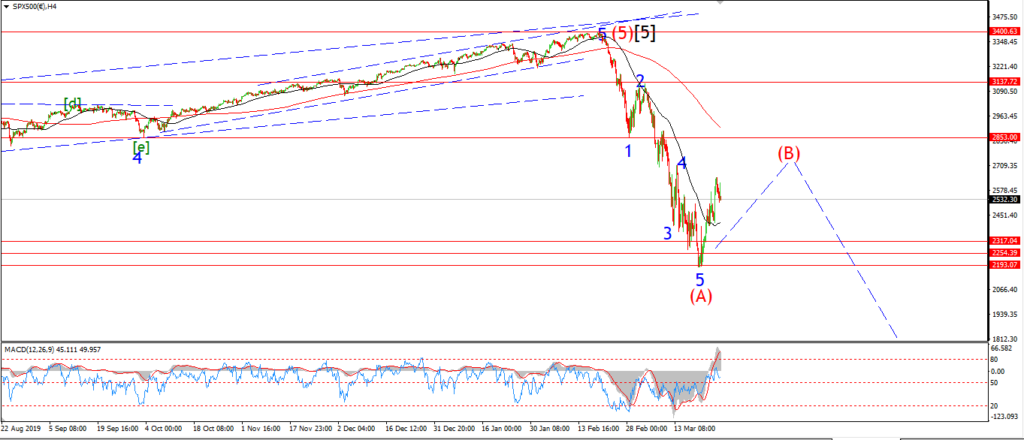
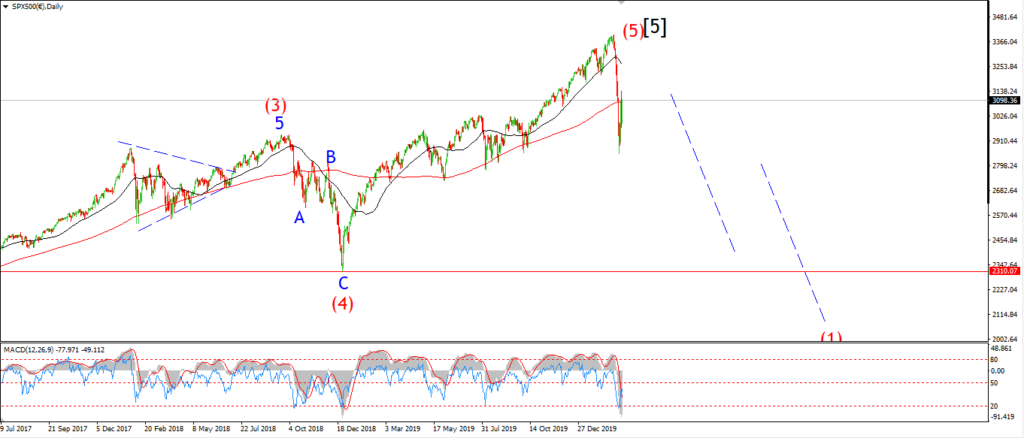
The S&P is sporting the same wave count as he DOW now.
This final run higher in wave [v] is faltering at the 50% retracement level this evening.
Of course wave [v] has room to go higher,
but as with the DOW,
the rally is playing on borrowed time now.
The target we had since the beginning of this correction in wave (B),
was at the 50% retracement level at 2788.
And after a clear three wave rally into todays highs,
we have met that target.
So,
as everyone and their granny, can’t help but look higher to a new bull market run.
I am now switching focus completely to the downside again.
Wave (C) is calling,
and it should begin in the next few days.
Tomorrow;
watch for wave [v] to put in a final high over the coming few sessions.
Wave [i] down should break the 2600 level again in a five wave move lower.
SILVER.
SILVER 1hr
SILVER 4hr.
SILVER daily.
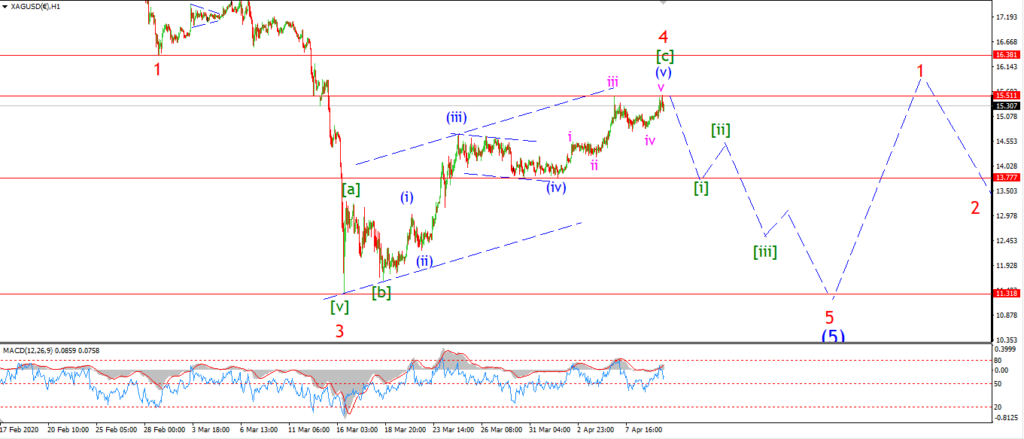
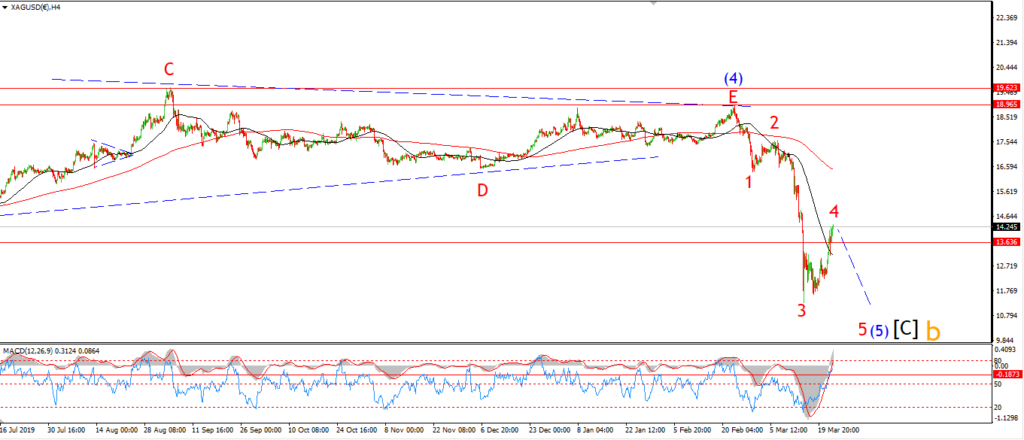
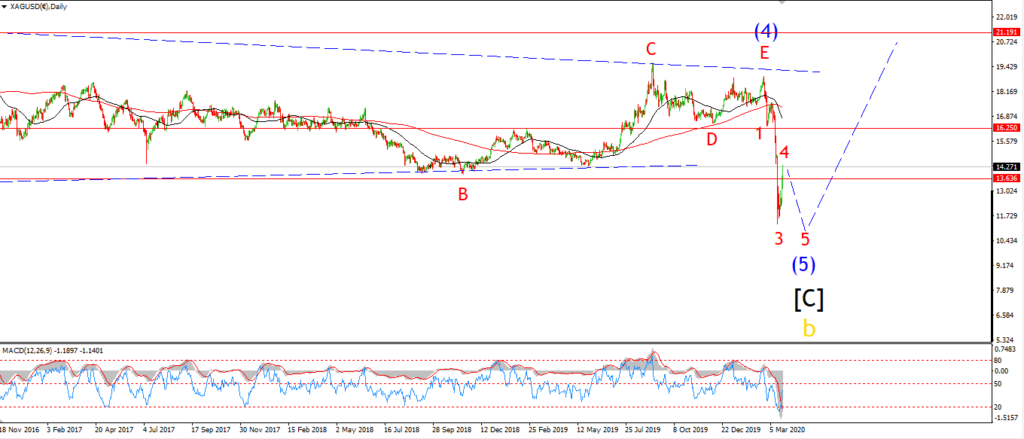
Silver has traced out a five wave rally into todays highs.
I have shown this on the short term chart.
Although wave ‘4’ has taken longer than expected,
and the structure is pretty extended,
the three wave nature of the rally is still the best interpretation so far.
I have mentioned the alternate view a few times this week,
but that count depends on a break of 16.38 at the wave ‘1’ low.
The complete lack of momentum in this weeks rally does not support a continuation to the upside.
So I am sticking with this bearish count for now.
Tomorrow;
Watch for wave [i] of ‘5’ to begin tomorrow.
Wave [i] should break below 13.77 over the coming days.