
HI there everyone.
Back to normal service tonight so on with the show.
but before I start,
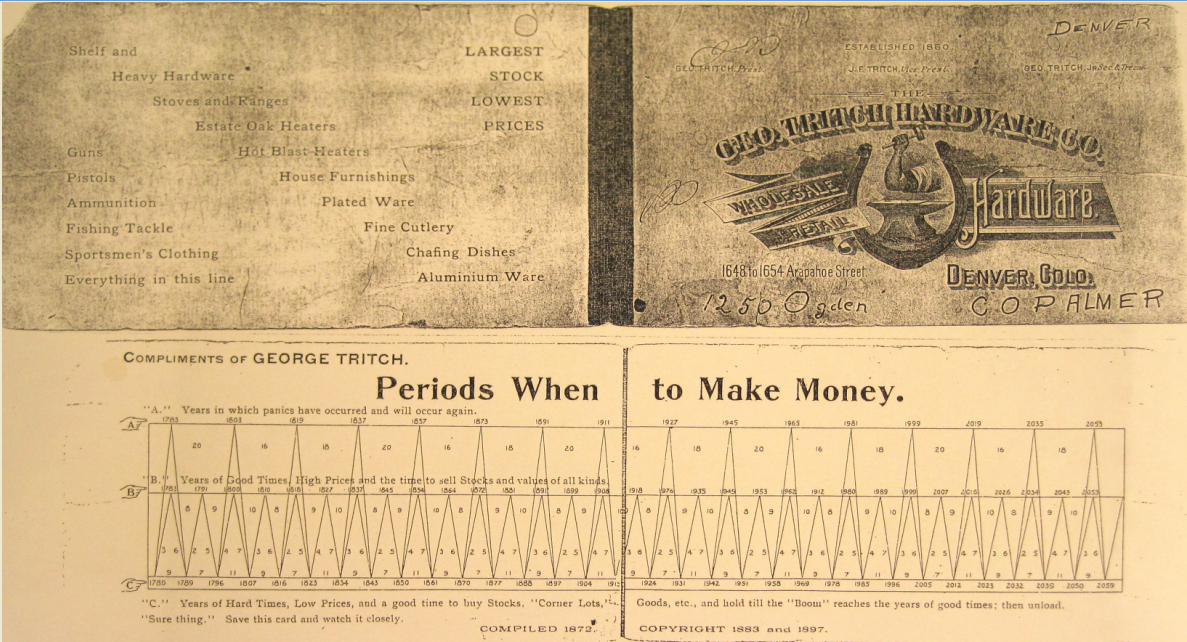
Do you remember we looked at this chart a few months back:
Charles Benner produced this chart back in 1872, and he predicted a major top in the economy / markets in 2019.
He was 3 months out!
But just take note that he also predicts the next cycle low at 2023,
so we have some serious action to get through yet before its time to dive in for the long haul again.
Down to business.
EURUSD.
EURUSD 1hr.
EURUSD 4hr.
EURUSD daily.
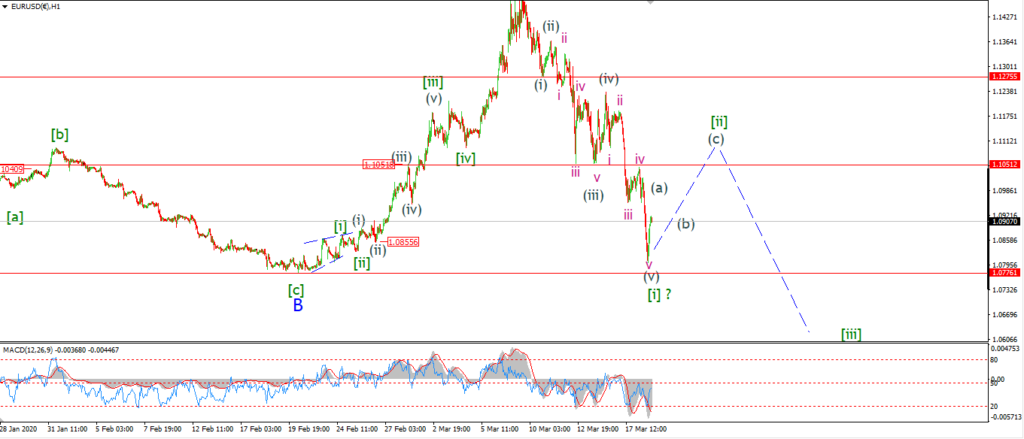
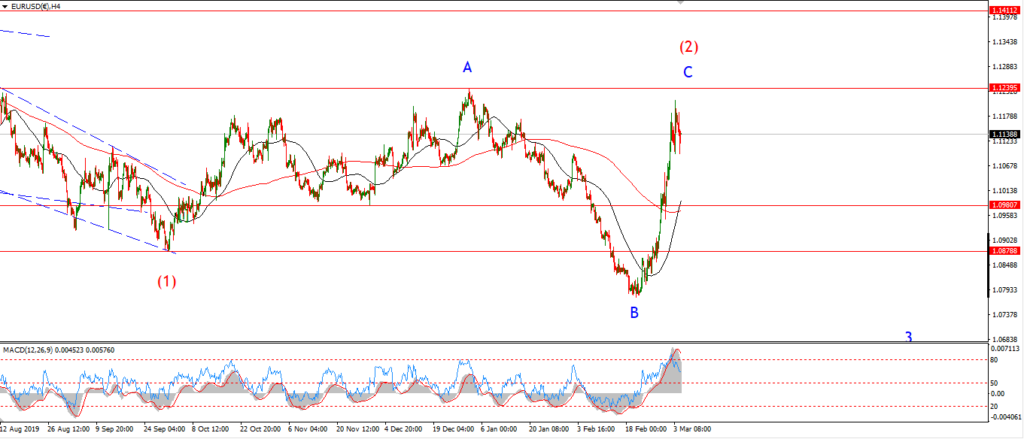
EURUSD seems to have found the final low for wave [i] now.
The pattern off the wave (iv) high has traced out a clear five wave structure lower.
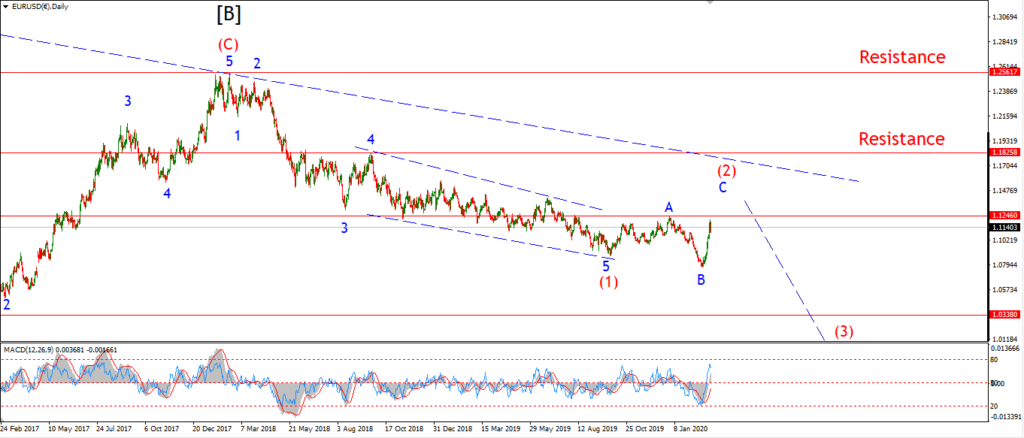
This completes wave the first leg lower into wave ‘3’ as seen on the daily chart.
The price found support at the previous lows of wave ‘B’,
and this evening we are closing with a nice spike higher off that support.
I am calling this move higher as the beginning of wave [ii].
Tomorrow;
Wave [ii] should trace out a three wave correction higher.
And wave [ii] will likely target the 1.1100 area to complete.
Wave (a) and (b) should complete by tomorrow.
GBPUSD
GBPUSD 1hr.
GBPUSD 4hr.
GBPUSD daily.
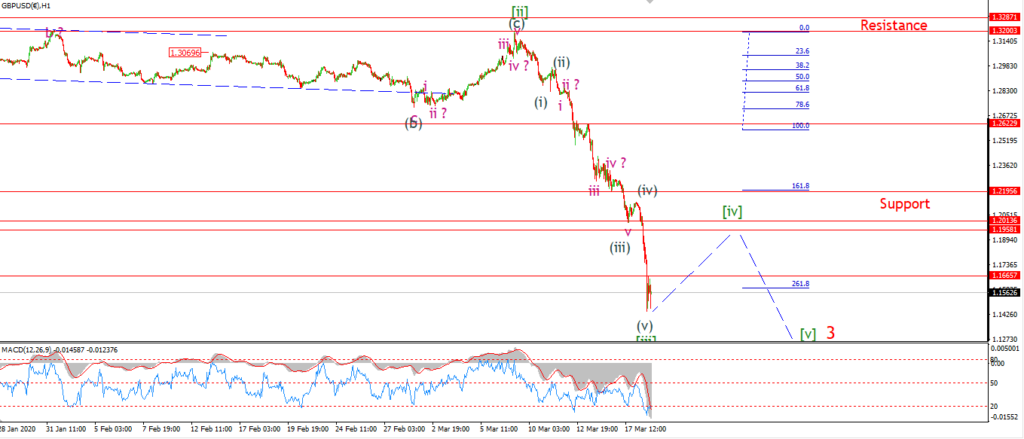
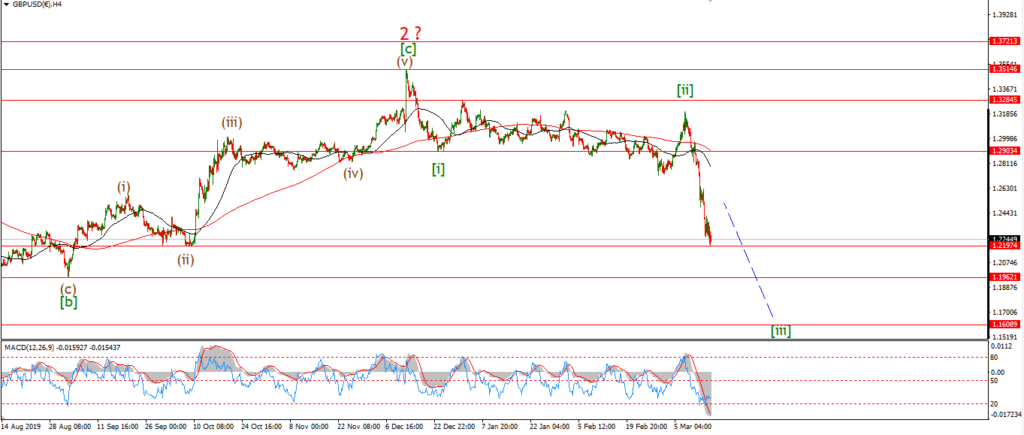
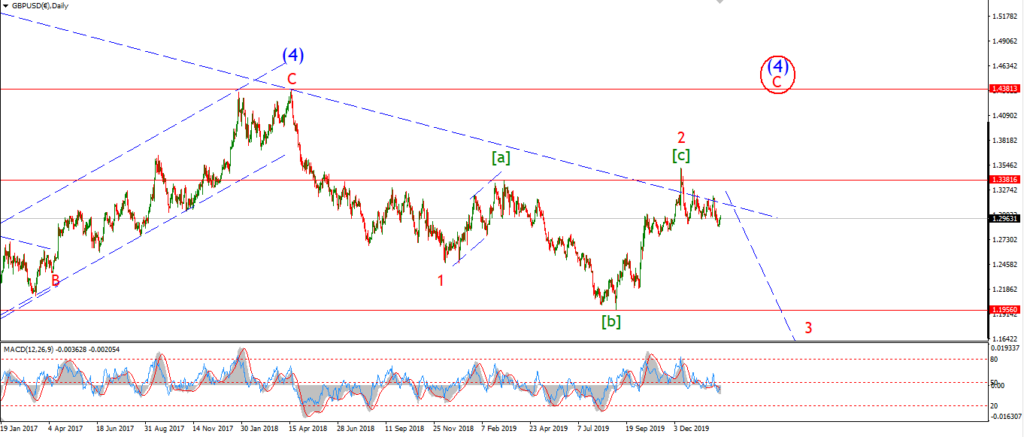
It’s bee quite a decline off the wave [ii] high the last few weeks.
Cable has crashed 1700 points lower in the last 10 days!
This is most definitely the action of a third wave indeed.
I am looking for this part of the decline to complete soon enough.
Wave [iii] of ‘3’ has accelerated lower as expected.
And now I think its time for a corrective rally again in wave [iv] green as shown.
Tomorrow;
This evenings lows have brought the price to the 261.8% extension of wave [i] now,
so a reaction to this declin is now due.
Watch for an initial move ,higher to create a small higher low before teh end of the week.
Wave [iv] should push back to about 1.2000 again in three waves.
USDJPY.
USDJPY 1hr.
USDJPY 1hr.
USDJPY daily.
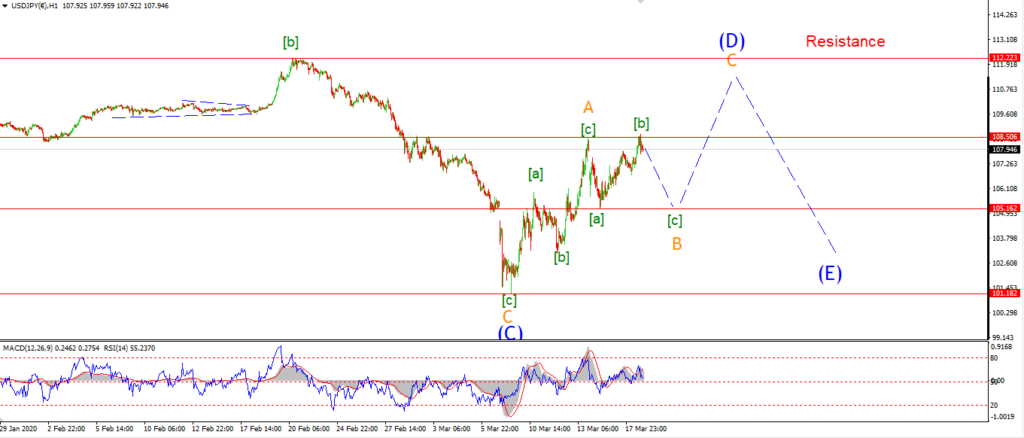
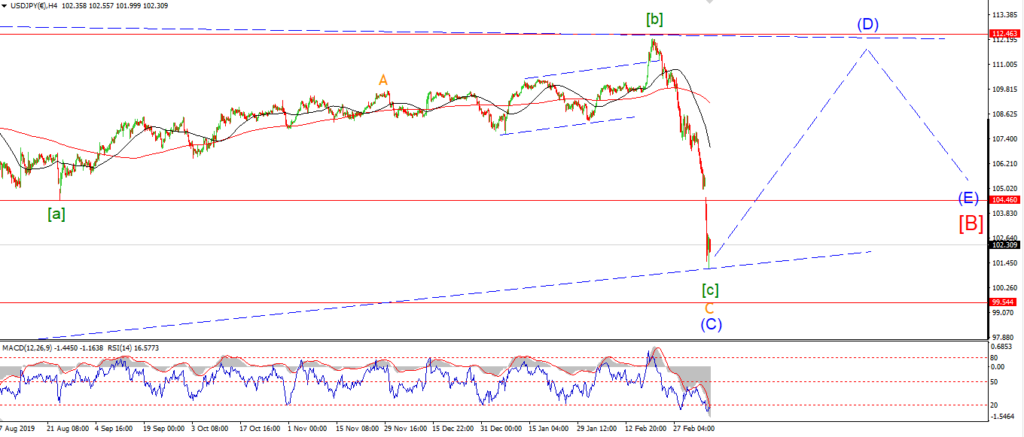
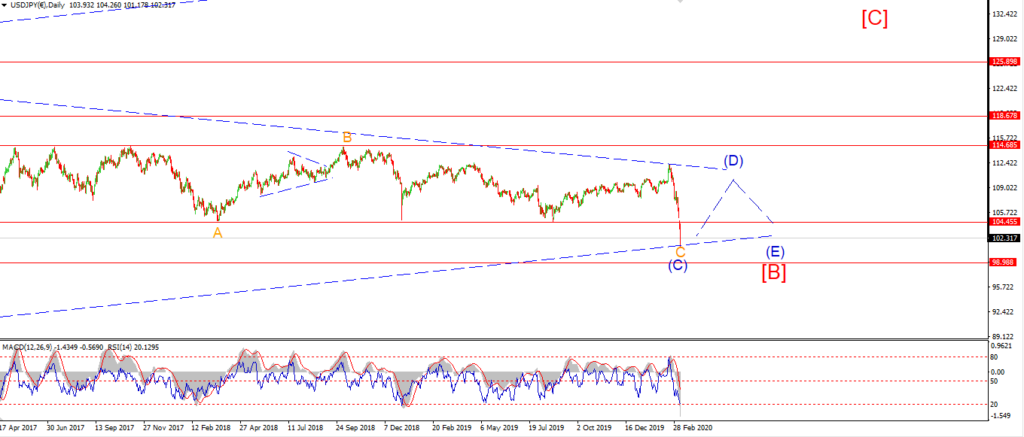
The rise off the wave [a] low looks to be in three waves still.
Wave [b] has now broken the high of wave ‘A’ now.
This classifies wave ‘B’ as an expanded flat correction.
And now wave [c] of ‘B’ should turn lower again to hit 105.15 again to complete the pattern.
Tomorrow;
Watch for wave [c] to turn lower again.
The decline should be in five waves,
and wave [c] should finish the larger wave ‘B’ by the end of this week.
DOW JONES.
DOW 1hr.
DOW 4hr
DOW daily.
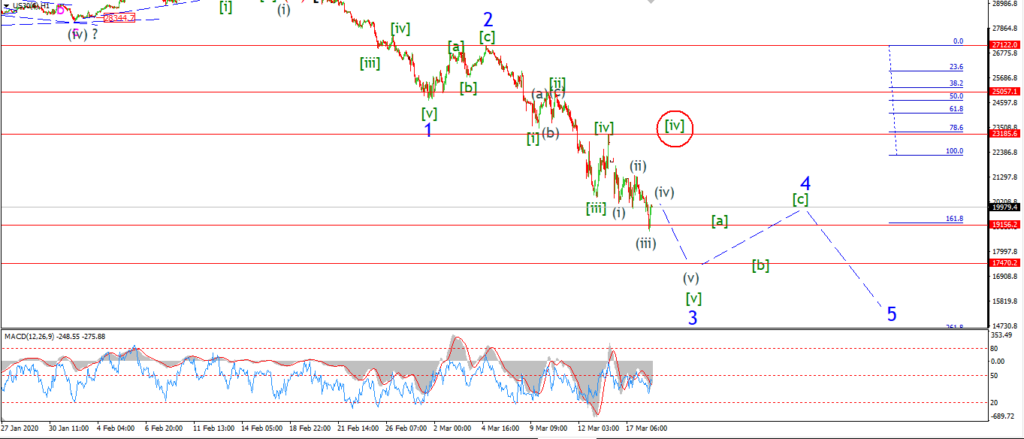
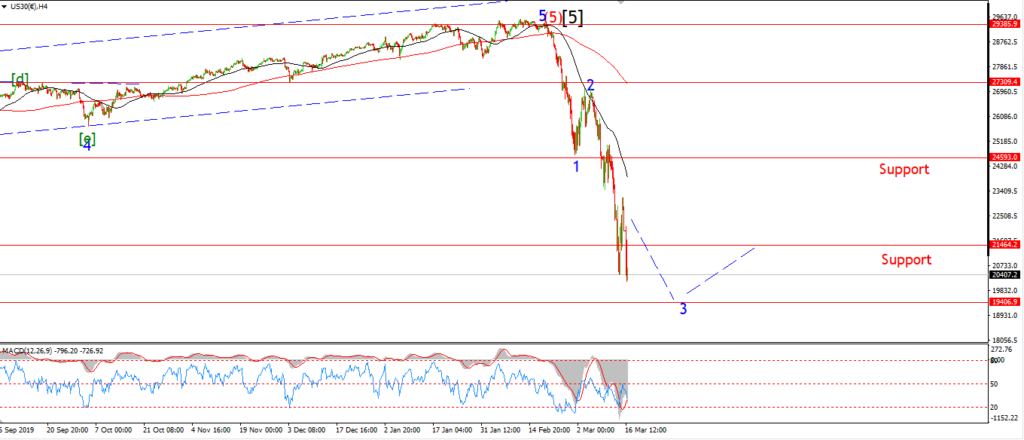
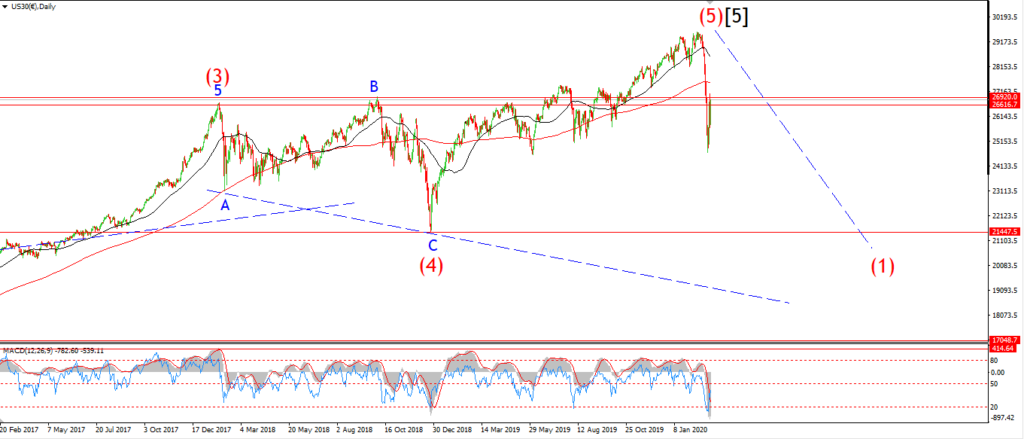
Todays action has opened up another possibility for the decline in wave ‘3’ blue.
It is possible that wave [iv] of ‘3’ is complete at the recent highs of last Friday.
The decline off that high has traced out a three wave pattern so far,
This could be an ongoing regular five wave decline,
or wave [v] could trace out an ending diagonal.
Only time will tell there.
The alternate count still allows for a larger wave [iv] to complete back up at the 23200 level,
this would lead to another decline in wave [v] again.
Tomorrow;
The main wave count suggests that wave [v] will return lower again this week as part of an ending diagonal.
Wave ‘3’ has now hit the 161.8% extension of wave ‘1’ today,
so it is time for a retracement of some sort in wave ‘4’.
Although we may have to wait until next week for that to happen.
GOLD
GOLD 1hr.
GOLD 4hr.
GOLD daily.
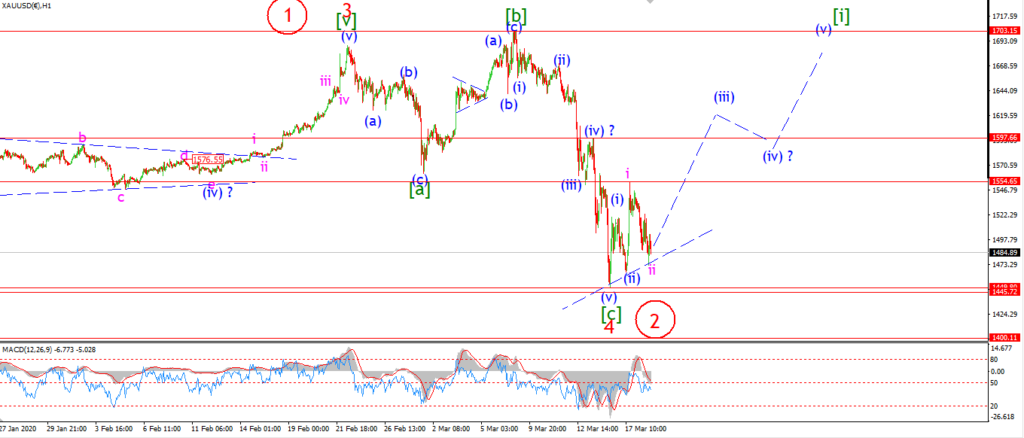
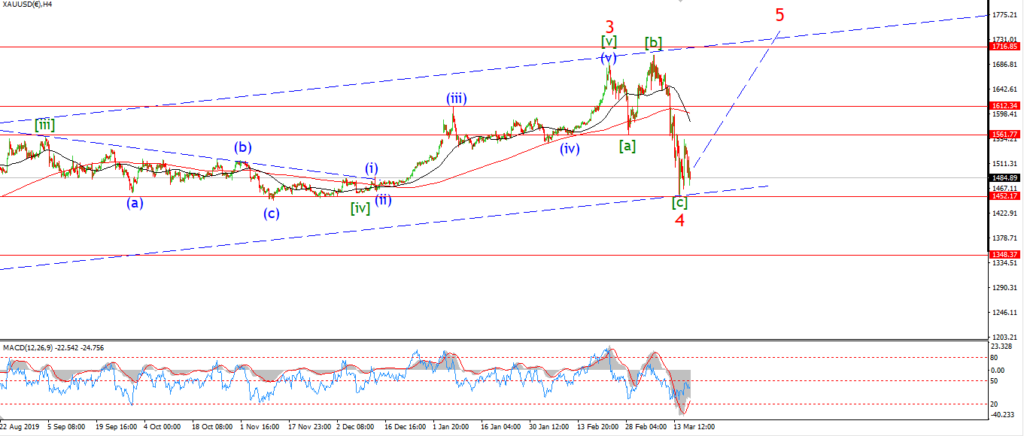
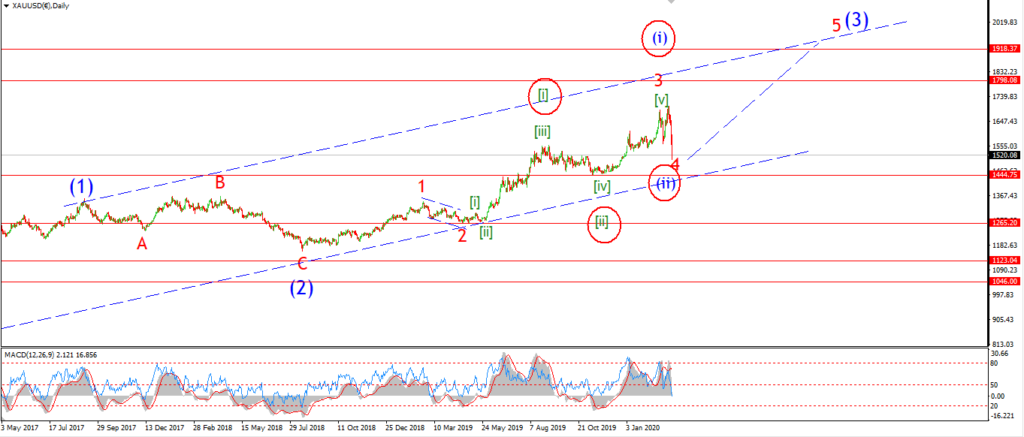
Gold is finding it very hard to get off the ground after that brutal decline last week.
There is little or now safe haven bid anymore!
So it is now going to be a case of exhausted selling and a momentum turn to the upside.
The 4hr chart suggests that we have a momentum turn higher already in play.
This weeks rise off the lows is in three waves so far,
so we will have to wait and see of wave ‘4’ continues to hold.
Tomorrow;
The most optimistc way of labeling this action is a series of 1,2, waves up off th low.
If we see a rally back above 1554 again that will signal wave [i] has begun.
I want to see the price hold above 1450 from here on out.
CRUDE OIL.
CRUDE OIL 1hr.

CRUDE OIL 4hr.

CRUDE OIL daily.
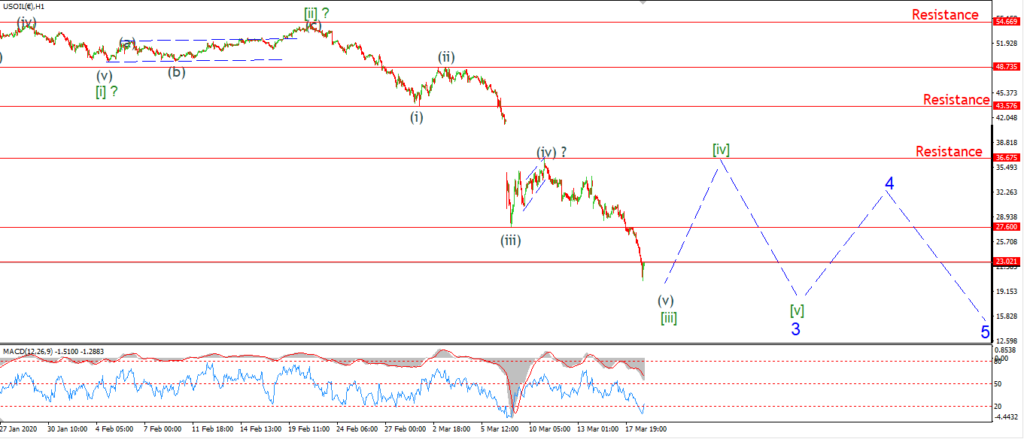
Crude is now trading with a 20 handle again,
after starting this year with such optimism up at $65 level!
How the mighty fall eh!
Todays lows broke lower out of last night pattern early in the trade today.
So wave (iv) did complete at the 36.67 high.
WAve (v) is now well underway and most likely drawing to a close this week.
That will complete the larger wave [iii] of ‘3’ pattern soon.
And then we should expect some type of corrective rally in wave [iv] of ‘3’ beginning next week.
Tomorrow;
wave (v) may have another step lower to complete a clear five wave pattern.
A rise back above 27.60 again should signal wave [iv] has begun.
S&P 500.
S&P 500 1hr
S&P 500 4hr
S&P 500 daily.
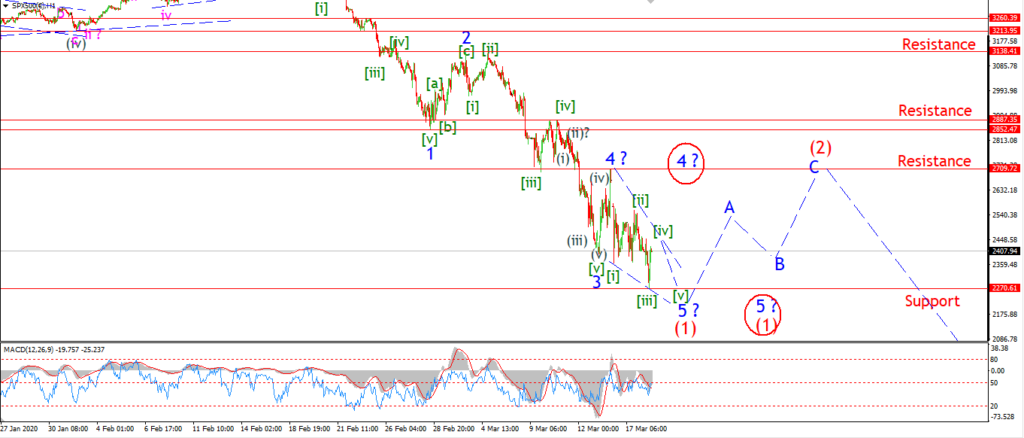
As far as I can see,
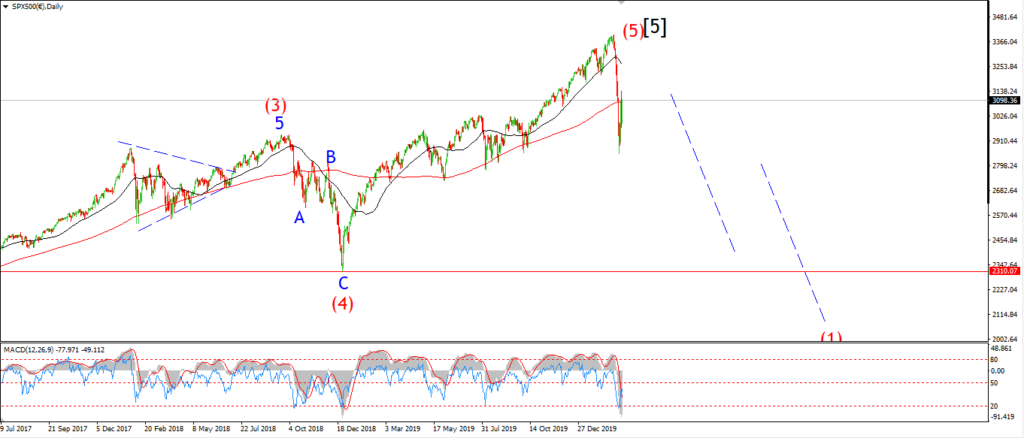
wave (1) down is now drawing to a close over the next few sessions.
The ending diagonal pattern fits well in the S&P also.
The market seems to be tracing out this final decline in wave ‘5’ of (1) now.
With wave [iv] and [v] of ‘5’ left to complete over the rest of the week.
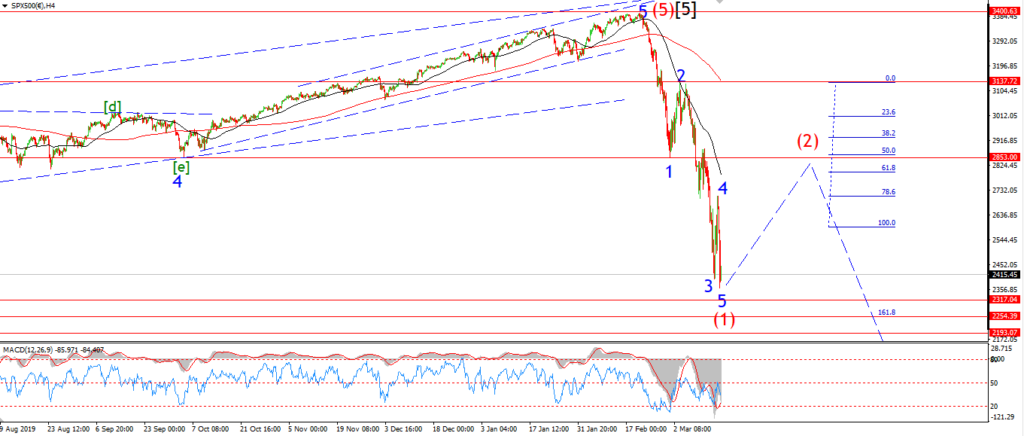
A break below 2270 again will signal wave ‘5’ is done,
and then I will begin to look for that inevitable dead cat bounce to begin in wave (2)
Wave ‘2’ should push back up to 2700 again in three waves as shown.
This level marks the previous wave fourth wave at one lesser degree.
We might even see a rally back into the 3000 level in wave (2).
Tomorrow;
watch for waves [iv] and [v] to complete this week.
The price is now declining against a turn in momentum,
so we could see a bounce soon enough up into wave ‘a’ of (2).
SILVER.
SILVER 1hr
SILVER 4hr.
SILVER daily.
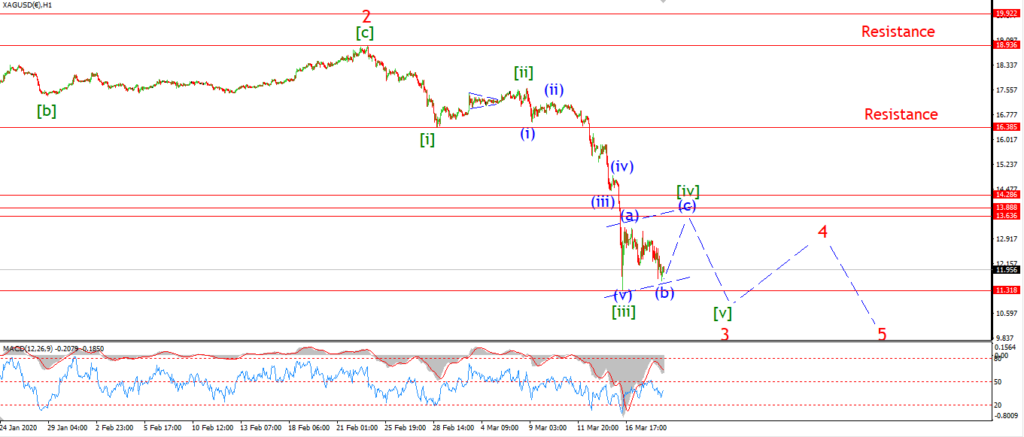
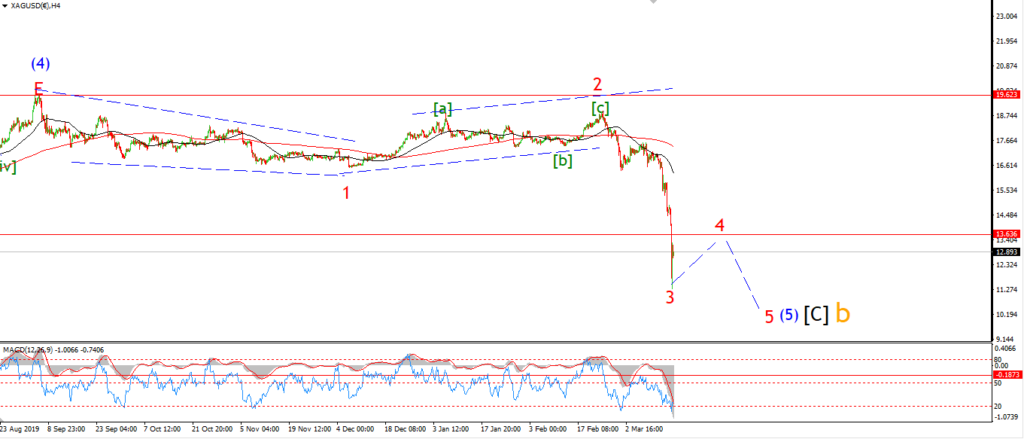
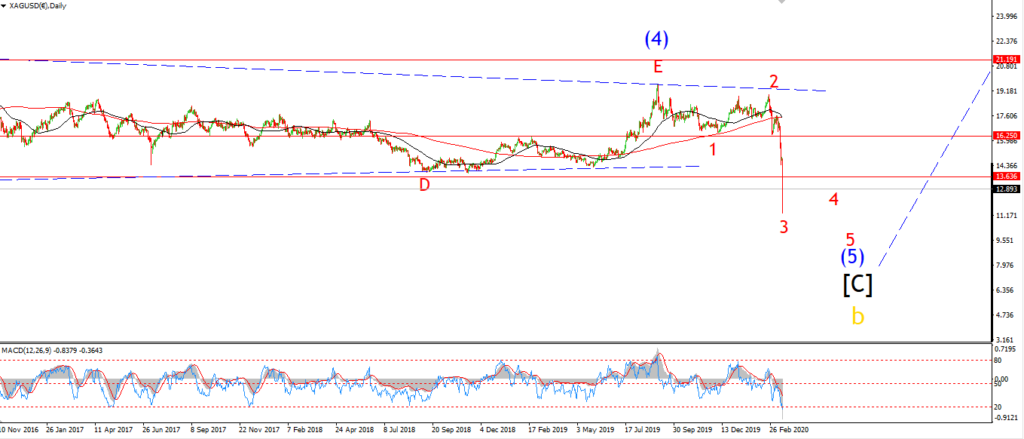
Silver is moving correctively sideways in a possible wave [iv] of ‘3’ today.
the drop off the wave (a) high is in three waves at todays lows.
This suggests wave (b) is now complete,
and wave (c) should follow to the upside by the end of this week.
Once wave [iv] is done, wave [v] will be calling.
And we should see another decline in wave [v] of ‘3’
Tomorrow;
Watch for wave (c) of [iv] to push back towards 13.60 again by Friday and complete a three wave correction within the trend channel.