
 Good evening all.
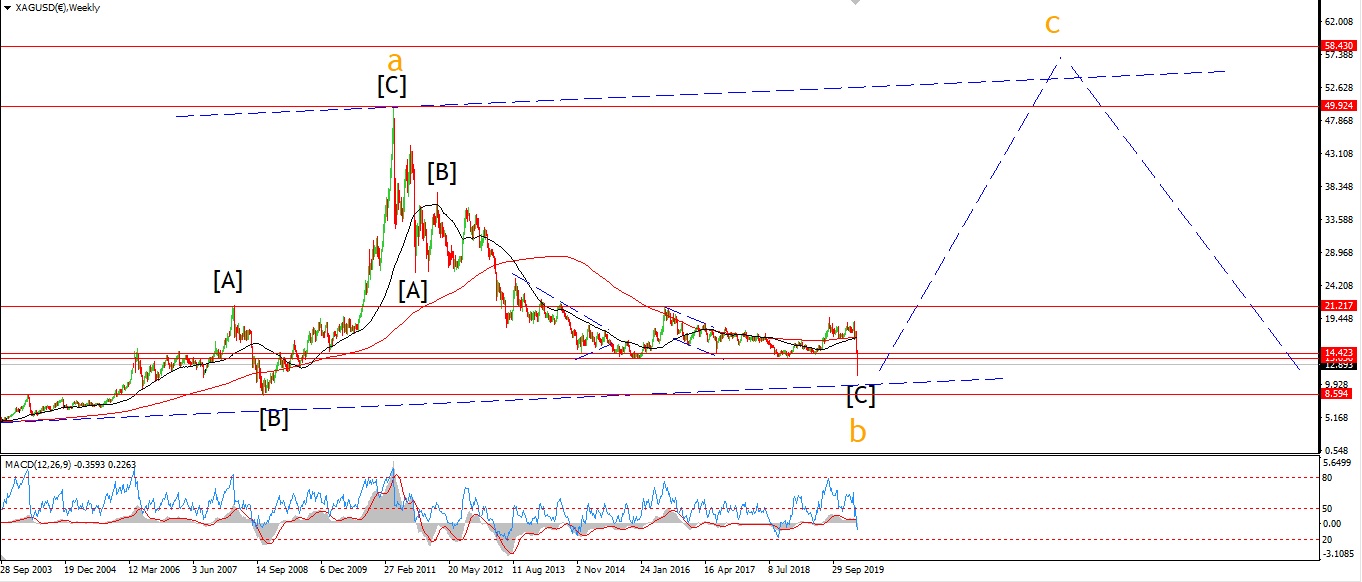
Here is the weekly chart of Silver, I will speak about this a litter later on.
So on with the show!
EURUSD.
EURUSD 1hr.
EURUSD 4hr.
EURUSD daily.
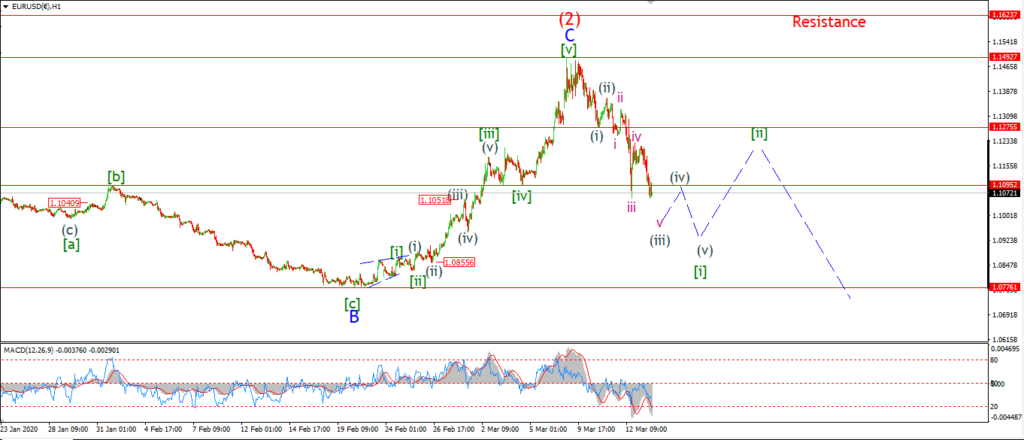
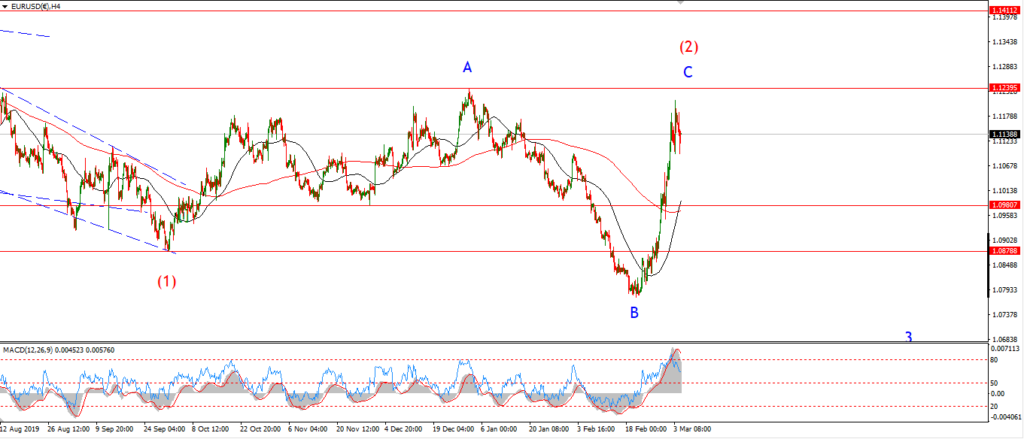
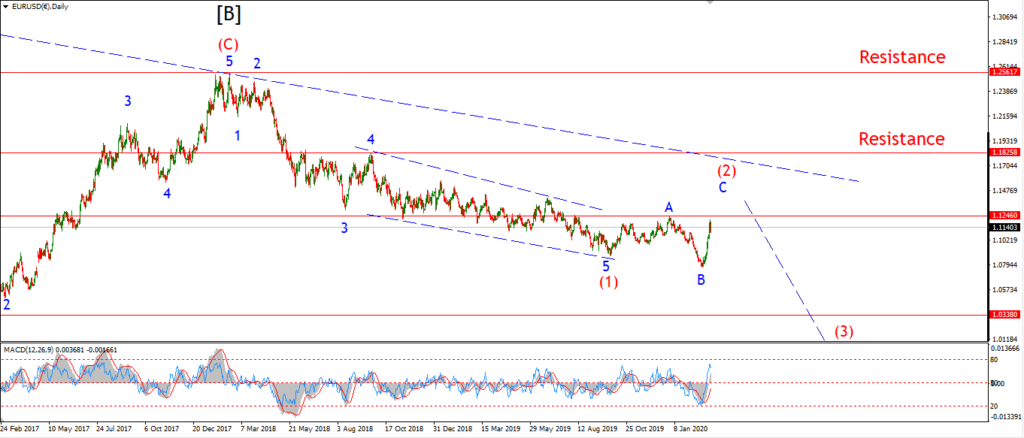
EURUSD is tracing out a type of corrective pattern today.
For the moment it seems to be following a triangle pattern in wave (iv).
If the price continues to range below 1.1238,
then the triangle should hold.
Otherwise wave (iv) should hold below 1.1275 at then limit.
When wave (iv) completes,
then I will look for a drop into wave (v) by Wednseday.
I would like to see a break of 1.1000 again to finish a five wave decline in wave [i] green.
Tomorrow;
Watch for a continued correction sideways in a possible wave (iv) of [i].
with wave (v) down yet to complete.
GBPUSD
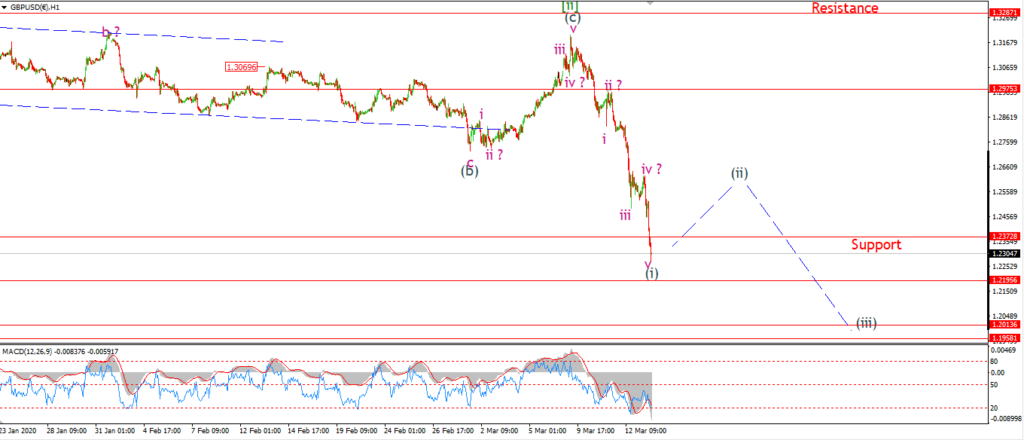
GBPUSD 1hr.
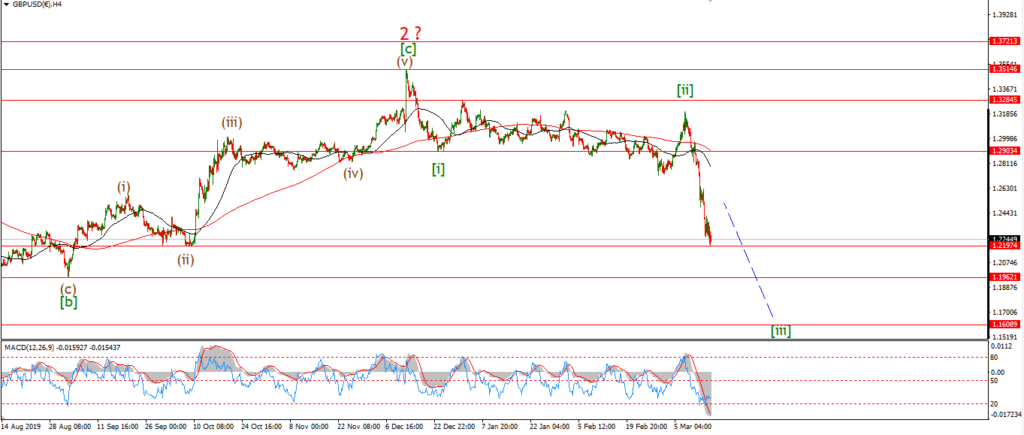
GBPUSD 4hr.
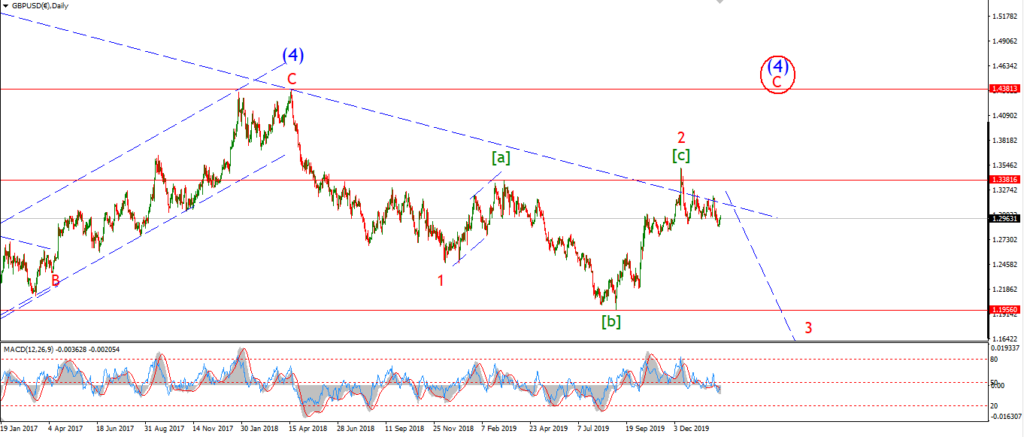
GBPUSD daily.
We are still looking for the final low in wave (i) today.
The price did reach a new low this evening,
although the action looks very corrective in nature.
This might be an ending diagonal within wave ‘v’,
I will just have to wait and see on that front.
Wave (i) should find a low soon enough either way,
and then wave (ii) is set to correct higher in three waves.
Tomorrow;
watch for wave (i) to complete.
The move higher into wave (ii) should should bring us back above 1.2600 again.
USDJPY.
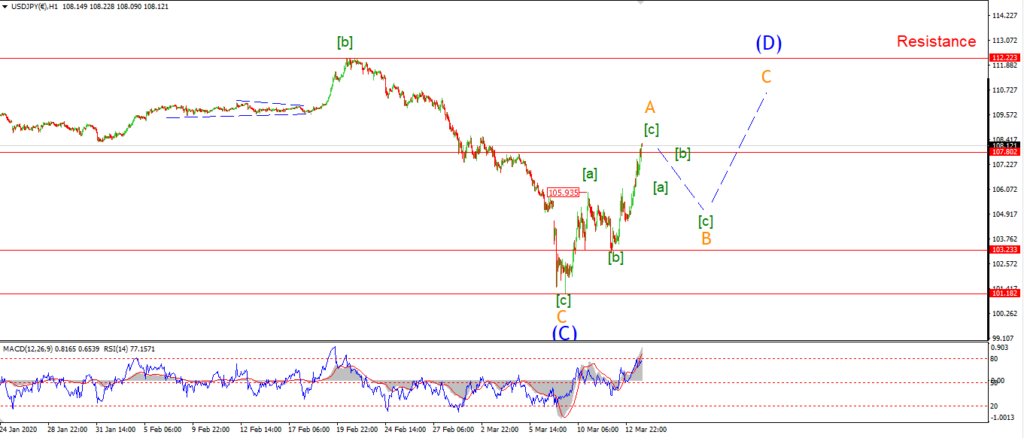
USDJPY 1hr.
USDJPY 1hr.
USDJPY daily.
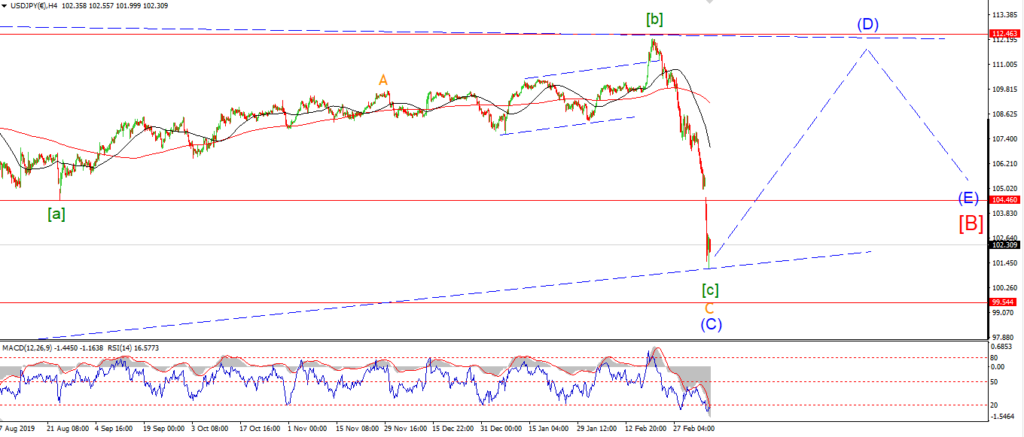
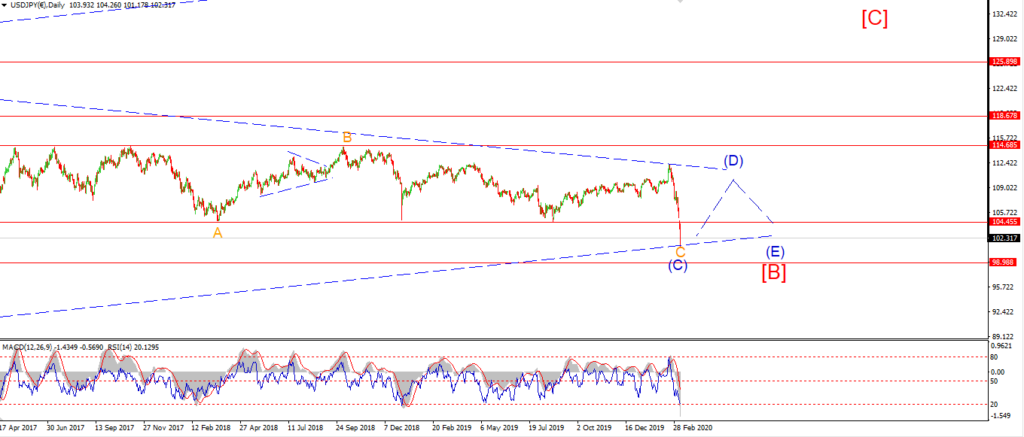
USDJPY is still correcting off the recent high at wave ‘A’ today.
Wave ‘B’ should trace out a three wave correction lower into about 103.00.
It looks like wave [a] is done and wave [b] is now underway,
Wave [c] should take a few more days to get through.
Tomorrow;
Watch for wave [b] to complete below 108.50.
And then wave [c] should return lower.
DOW JONES.
DOW 1hr.
DOW 4hr
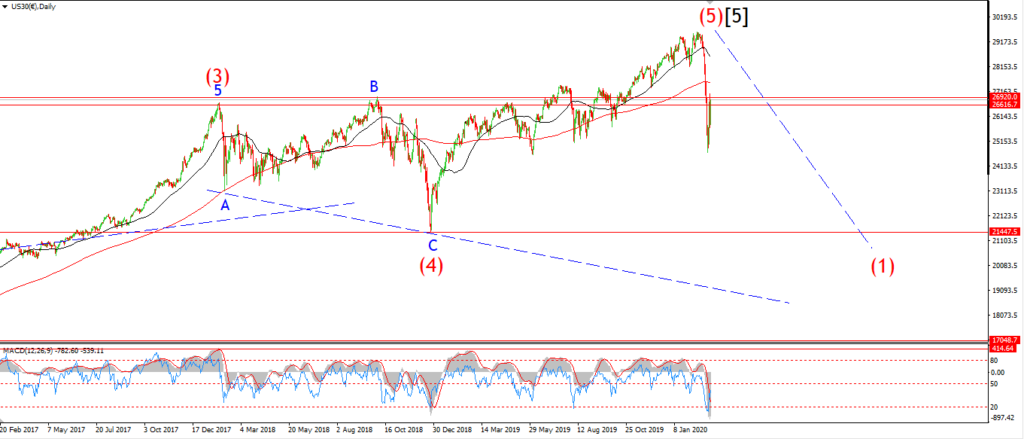
DOW daily.
Another day, another wild move!
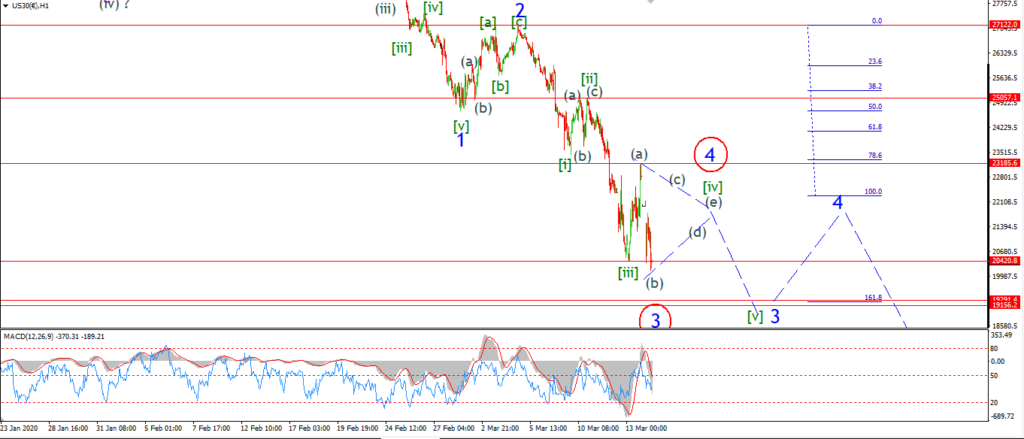
The action on Friday was in fact a three wave correction higher as suspected.
So that correction was full retraced about a minute after the open this morning!
However,
I think the size of the swings over the last few days
deserve a larger wave degree than I previously thought.
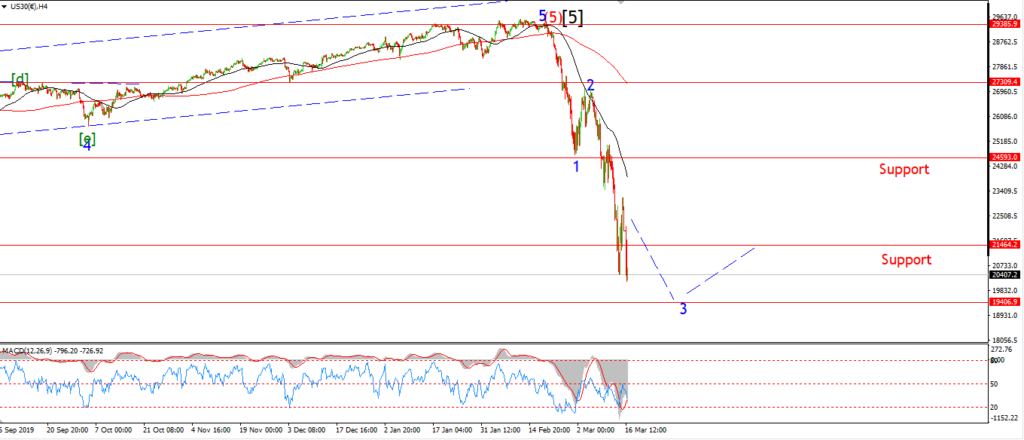
I am now looking at two possible interpretations for this action.
There could be a triangle underway in wave [iv] of ‘3’.
This is the main wave count,
and it suggests a consolidation over the coming days before a drop into wave [v] of ‘3’.
The alternate count in red,
shows todays low as wave ‘3’ now complete.
In this case we sill see a correction in wave ‘4’ of (1),
and then a further drop into wave ‘5’ of (1) possibly by the end of the week.
Tomorrow;
watch for a correction to develop over the next few days in a fourth wave.
In the main wave count,
price must hold below 23180 at wave (a).
The triangle pattern suggests that the range will continue to contract also.
GOLD
GOLD 1hr.
GOLD 4hr.
GOLD daily.
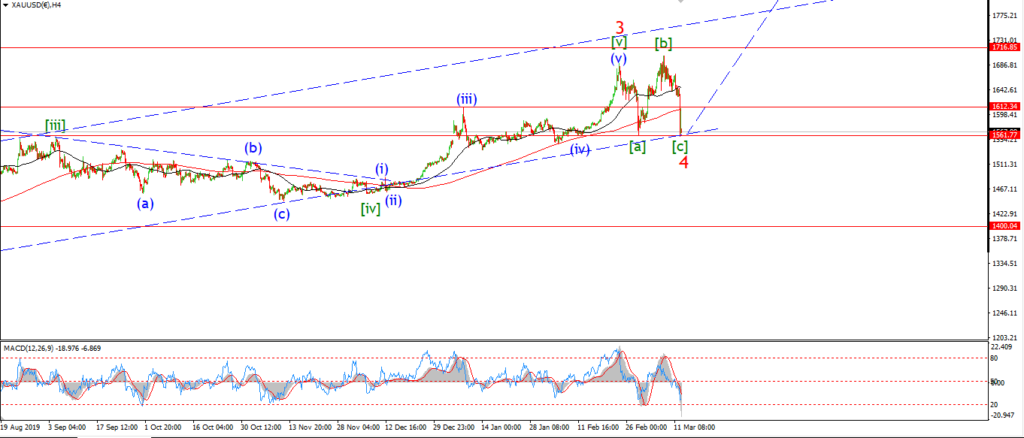
For a gold bull like me, the action over the last week has been very hard to swallow!
But I am pretty firm in my stance that this decline is a correction,
and it is all part of a larger pattern still developing.
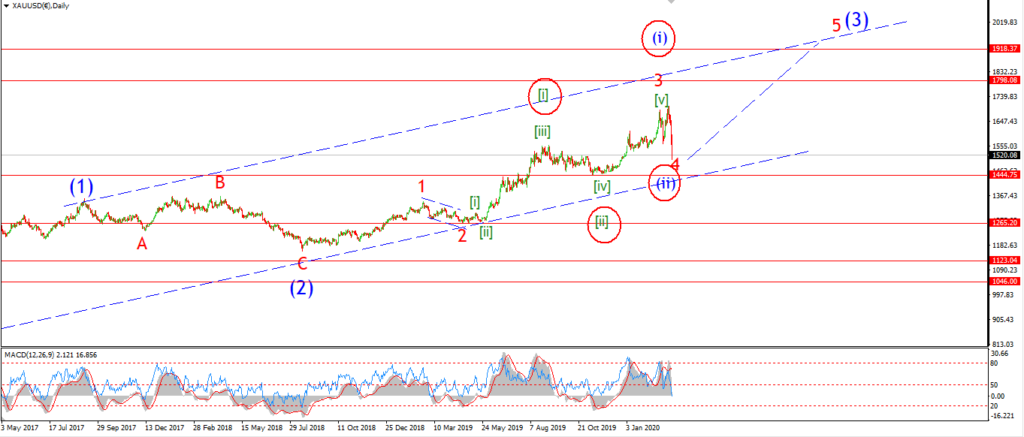
Given the sharp move lower this morning,
I have changed the alternate wave count which is best viewed on the daily chart.
It is possible that the recent high is only wave ‘1’ of (3).
Which means the current declines are wave ‘2’.
And then wave ‘3’ of (3) is next.
If this count is correct,
then we could see a huge rally develop in gold over the coming months.
Back to the main count.
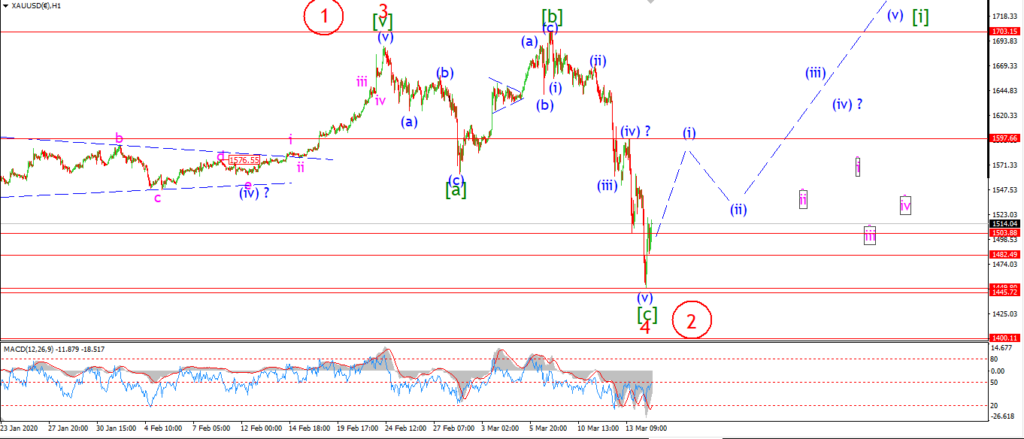
The price did rally off the session lows with a nice spike higher.
This rally is viewed as wave (i) of [i],
Wave (i) itself should carry the price back towards 1600 in five waves this week.
And if that rally occurs,
we should be able to confirm the larger wave ‘5’ has begun soon enough too.
Tomorrow;
Watch for the low at 1450 to hold.
We need to start seeing a five wave pattern building off these lows now.
Wave (i) is targeted to the previous wave (iv) high at 1597.
CRUDE OIL.
CRUDE OIL 1hr.

CRUDE OIL 4hr.

CRUDE OIL daily.
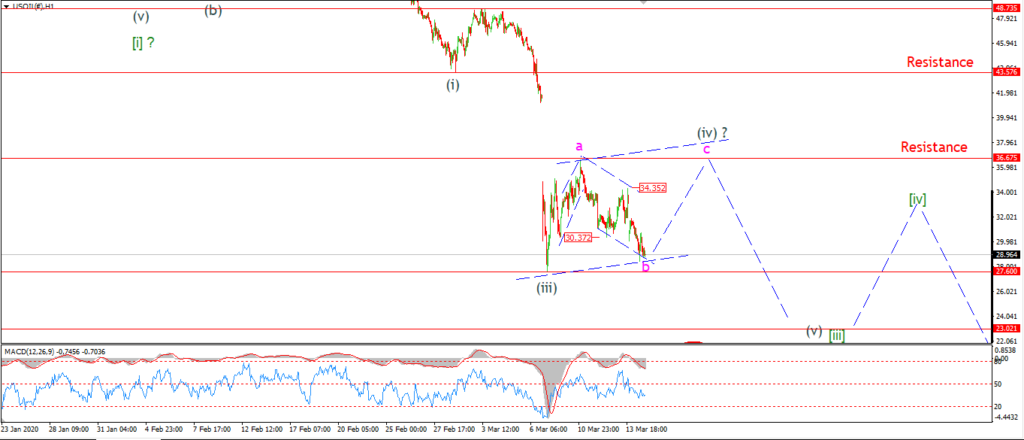
After todays action, I have switched to the larger wave (iv) idea.
Last weeks high is now viewed as wave ‘a’ of (iv).
Crude has fallen off that high in three waves into todays lows,
the price is also holding at a higher low above wave (iii) so far.
So this should be a corrective low in wave ‘b’ of (iv).
Wave ‘c’ of (iv) should rally again over the coming days in five waves to complete the larger correction.
And wave ‘c’ should break the previous wave ‘a’ high at 36.60 again at a minimum.
Tomorrow;
watch for wave ‘c’ of (iv) to turn higher again.
A break of 34.35 again will signal wave ‘c’ is underway.
S&P 500.
S&P 500 1hr
S&P 500 4hr
S&P 500 daily.
You know what they say about catching a falling knife!
That applies directly to the pattern in the S&P these days.
Due to the size of the moves over the last few sessions,
I have changed the wave count to reflect that action better.
So tonight we have a new count for the S&P.
And if this is correct,
then we will likely see a big bear market rally begin soon off a nearby low.
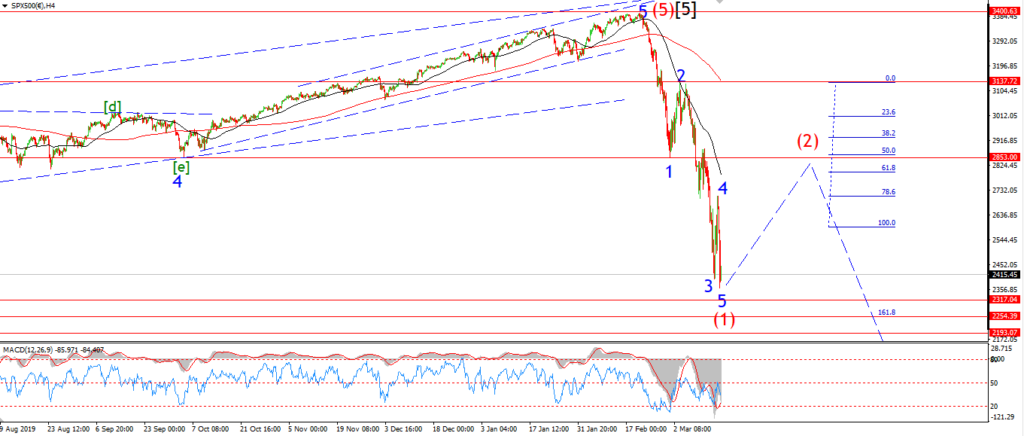
If you look at the 4hr chart you can see a possible five wave pattern off the high
which is drawing to a close now.
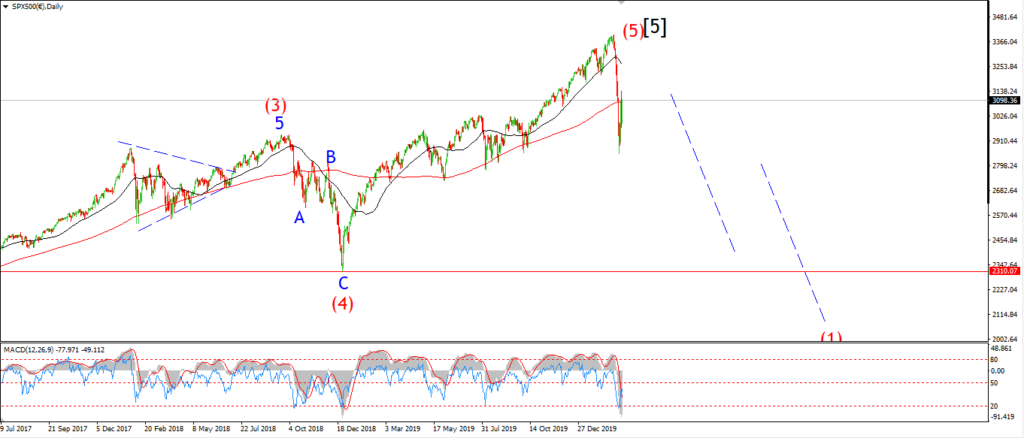
The drop off the all time high is labelled wave (1) down.
When wave (1) is complete,
then wave (2) has the potential to take the price back towards 3000 again in a three wave correction higher.
We are approaching that December 2018 low at 2315 now,
so this significant level could offer enough support to kick off wave (2).
And that is enough reason for me to be cautious at the moment.
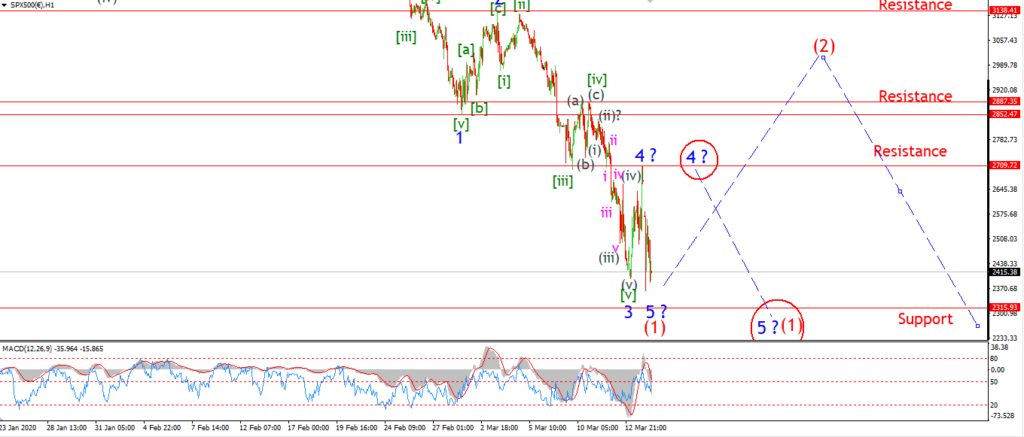
The alternate count is a variation on the idea that wave (1) is ending soon.
It is also possible that wave ‘4’ of (1)
will create a larger three wave correction as shown on the hourly chart.
This count will delay the low of wave (1) for about a week.
Tomorrow;
watch for wave ‘5’ to find support at or near 2315.
Wave ‘A’ of (2) should carry above the previous wave ‘4’ at 2709.
A break of 2709 again will signal wave wave (2) has begun.
SILVER.
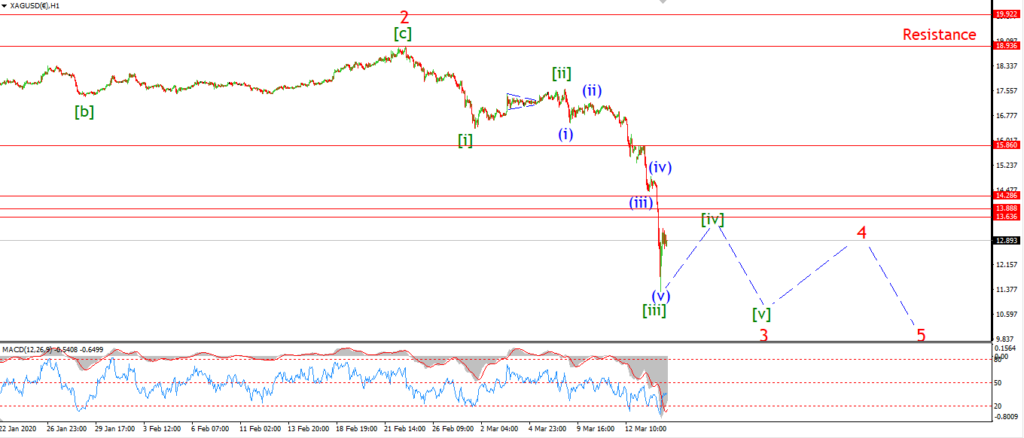
SILVER 1hr
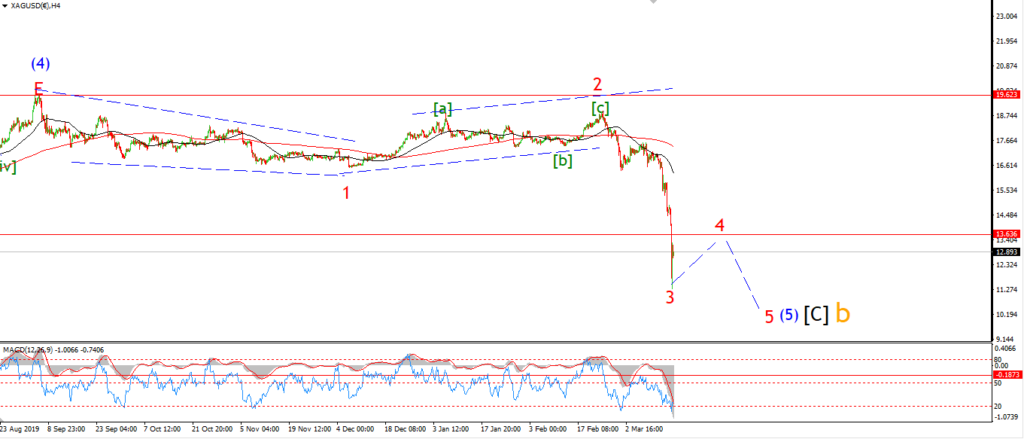
SILVER 4hr.
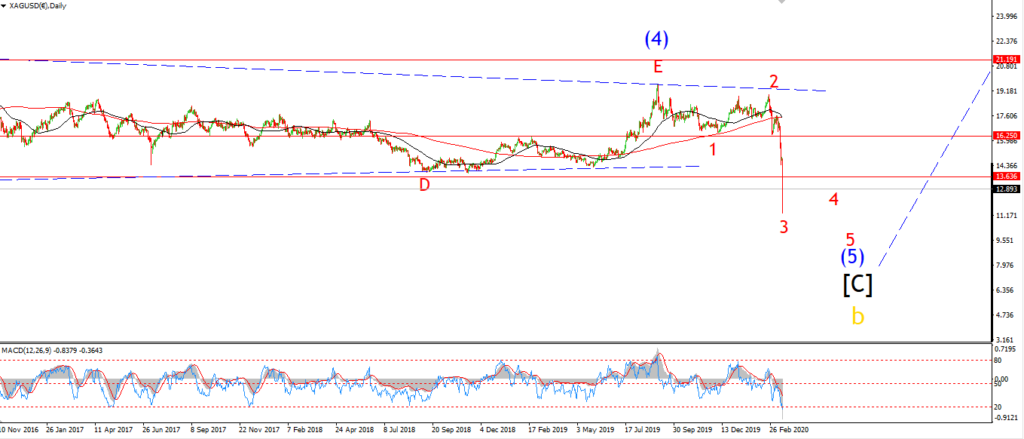
SILVER daily.
The bullish count for Silver was blown right outta the water today
with a break below the critical support at 13.63.
The action over the last few sessions has seen the biggest daily moves in silver in years!
And we are now sitting at almost 12 year lows in silver!
So it is back to the drawing board in this market at least.
I have shown the weekly chart in the intro this evening.
I am still viewing this new low as a very large degree ‘b’ wave.
And after we are done selling,
wave ‘c’ up is expect to begin a new bull market in silver.
But for the next few weeks,
we will have to deal with the current unfolding pattern.
The daily chart shows the recent decline as wave (5) of [C] of ‘b’.
Wave (5) should trace out a five wave decline over the coming weeks,
and we are likely to see single figure silver again before this wave is done.
I am going to wait for a few days to see how the action unfolds
before filling out the short term count again.