
Hi there everyone.
EURUSD.
EURUSD 1hr.
EURUSD 4hr.

EURUSD daily.
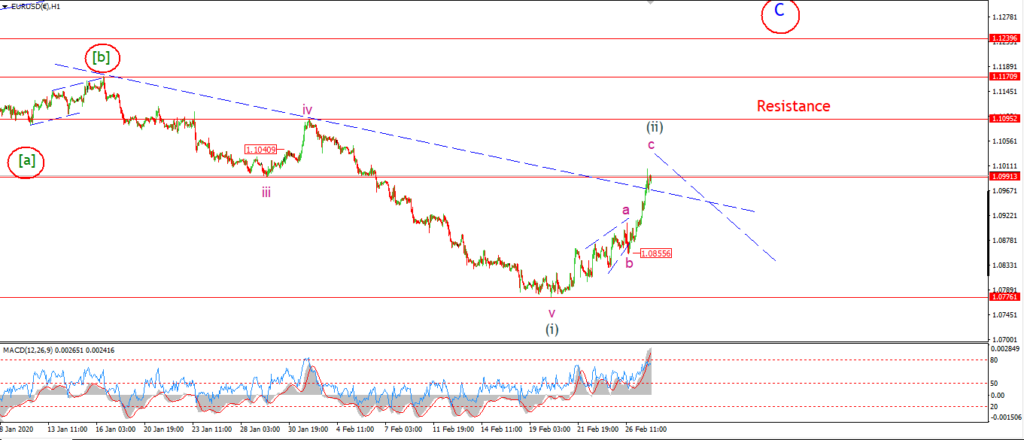
After a short and sweet ‘b’ wave correction last night,
wave ‘c’ of (ii) rallied higher today finally.
the rise is nice and impulsive looking and after such a move,
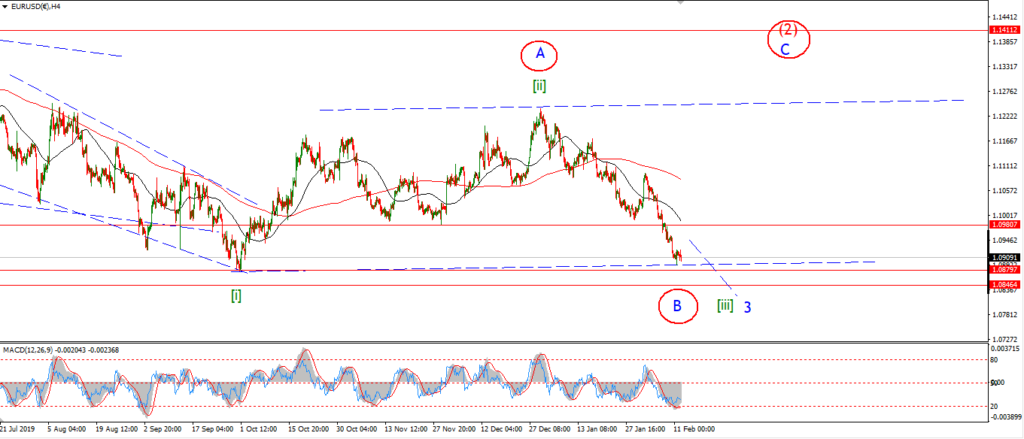
it is now possible to consider that alternate count again.
That calls for a larger rally up to above the 1.1239 level over the coming weeks.
For the moment I am happy to continue calling this a wave (ii) rally,
rather than the bigger alternate.
I will reconsider this count depending on what happens over the coming days.
Tomorrow;
Wave ‘c’ of (ii) has reached the initial target level at the previous wave ‘iii’ low at 1.0990.
The higher target at 1.1095 is now within reach as long as 1.0855 holds.
GBPUSD
GBPUSD 1hr.
GBPUSD 4hr.
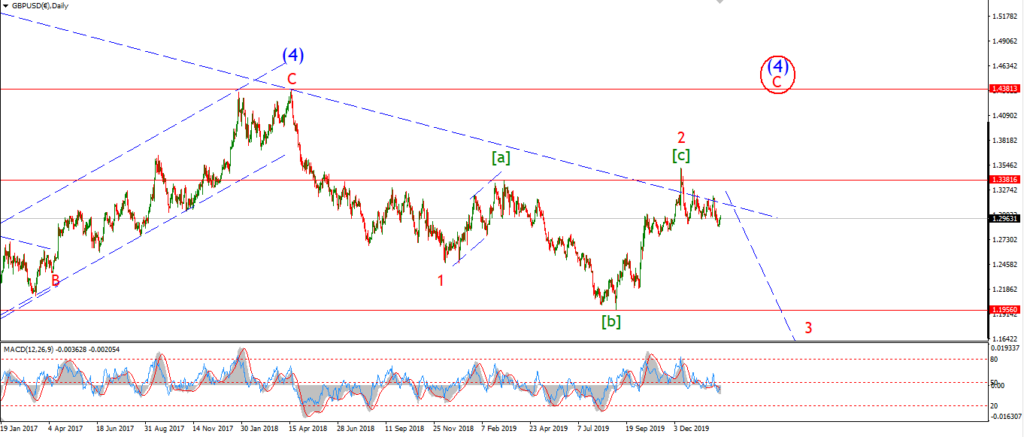
GBPUSD daily.
Given that we finally got the rally in EURUSD that was expected.
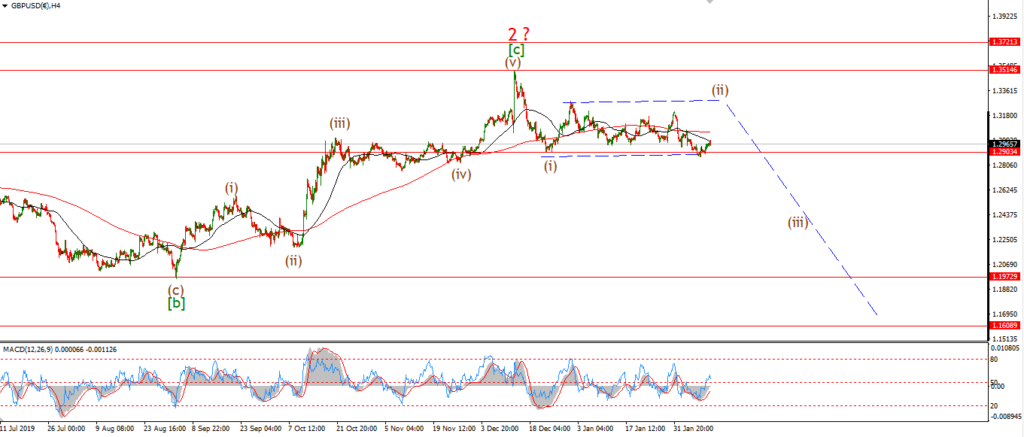
I don’t think it is too careless to continue to expect the same in cable also!
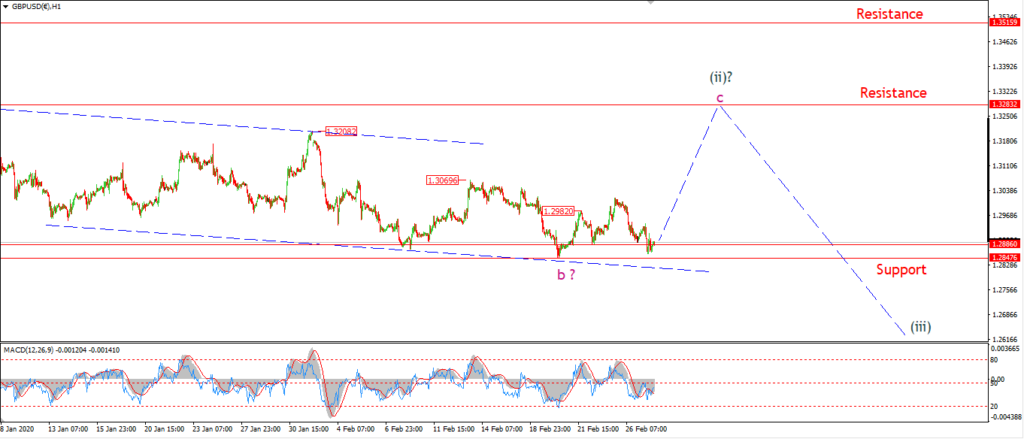
Wave ‘c’ is still nowhere to be found at the moment.
but the price is holding above the initial support at 1.2847.
As long as that level holds,
then a rally in wave ‘c’ is still the likely outcome.
Tomorrow;
watch for wave wave ‘b’ to hold at 1.2847.
A break of 1.2982 will signal wave ‘c’ has begun.
If we see a drop to the lower trend channel line again and then a rally off that point,
That will also count as wave ‘c’.
USDJPY.
USDJPY 1hr.
USDJPY 1hr.
USDJPY daily.
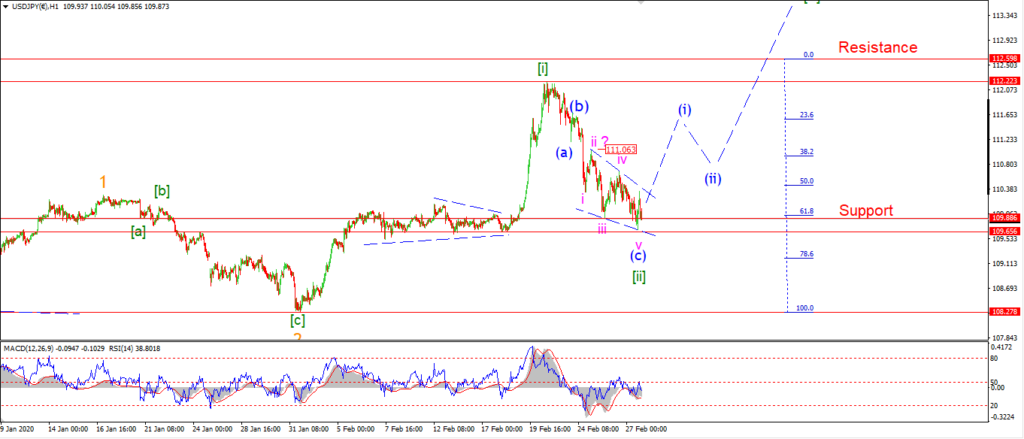
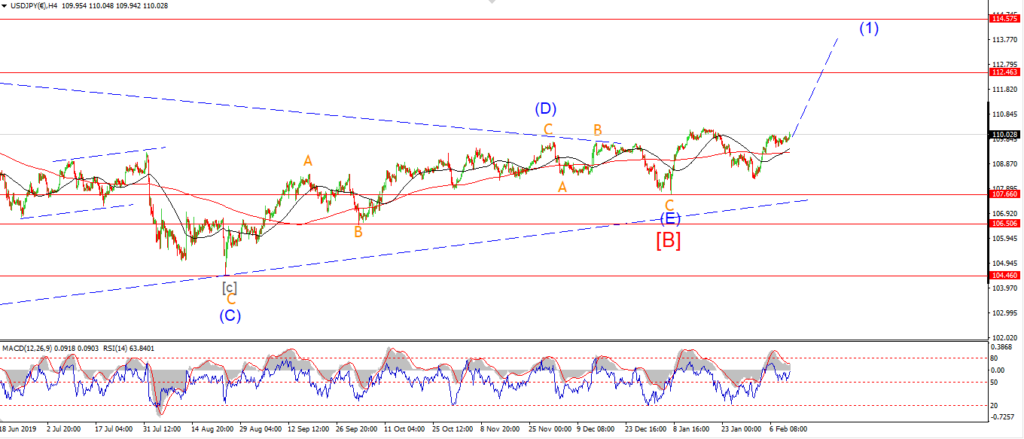
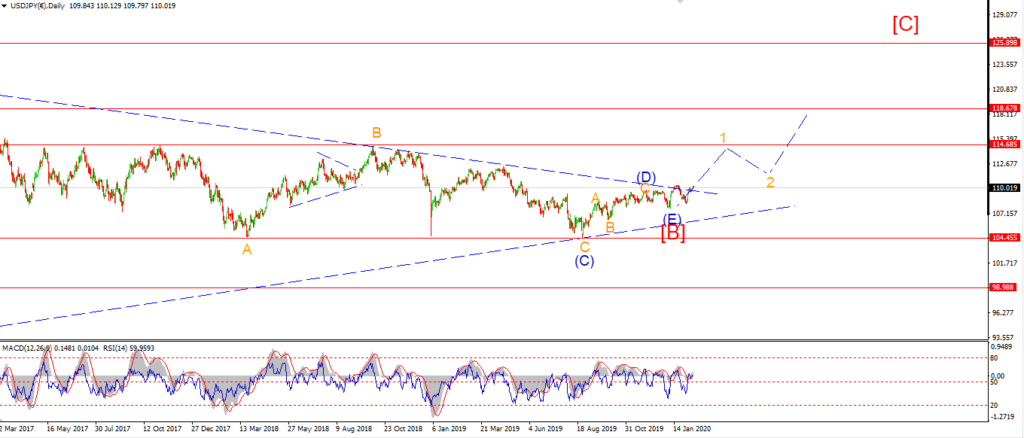
USDJPY is giving mixed signals these days.
This selloff in wave [ii] looks done now but the pattern keeps developing.
Todays new low may have completed an ending diagonal in wave (c) of [ii].
The price has spiked again off that low,
which suggests that momentum is beginning to favor the upside.
The key from this point on is to identify five waves up to begin wave [iii].
Tomorrow;
watch for wave (i) to begin with a sharp move back above 111.00 again.
DOW JONES.
DOW 1hr.
DOW 4hr
DOW daily.
Another day and another selloff in the stock market!
Boy doesn’t the scene change from rose tinted to complete blood bath in very short order!
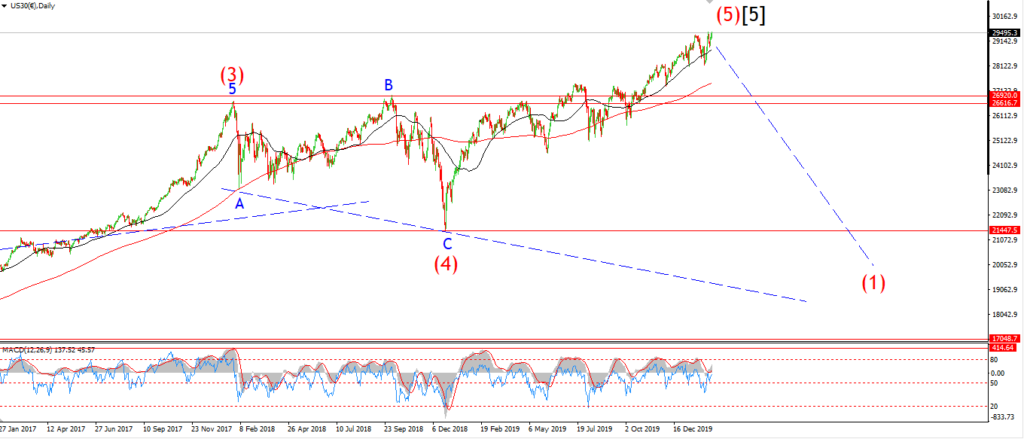
The extent of the selloff this week requires me to move up the degree of the wave count once again!
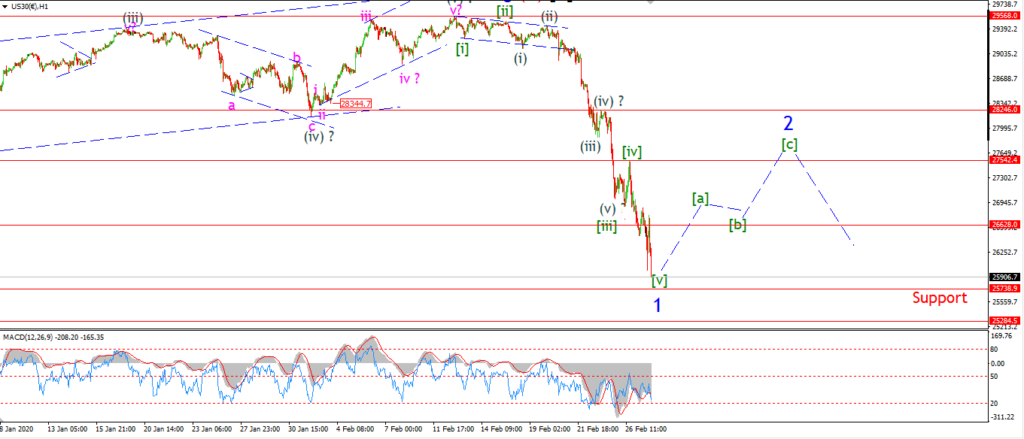
The decline off the high is now viewed as wave ‘1’ blue.
The reason for this change,
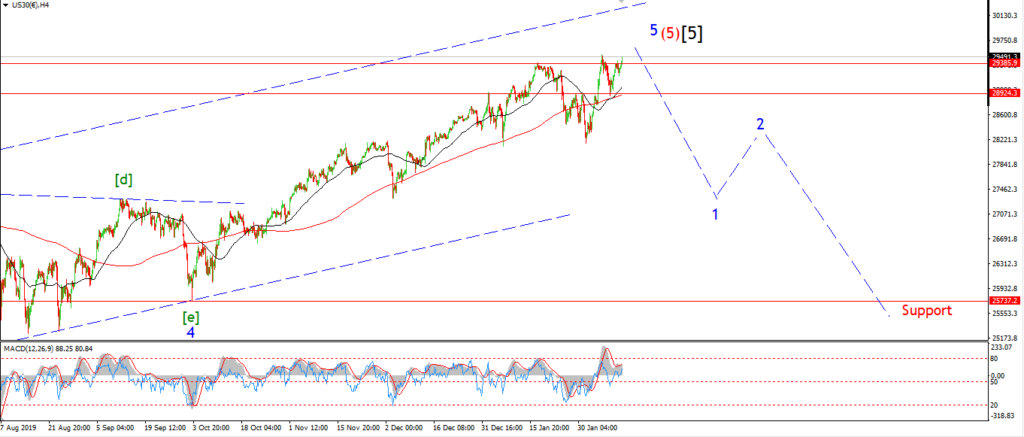
is because this decline has almost fully retraced the previous rally in wave ‘5’ blue.
Wave ‘5’ blue began back last October, and rallied for almost 4 months.
This decline in wave ‘1’ is going for about ten days in total!
Now that is what I call progress!
Tomorrow;
I expect that wave ‘1’ is near to completion now.
there may be one final low in wave [v] of ‘1’.
And wave [ii] will begin next week.
25738 is the most significant level of support below us now.
That level marks the low of wave ‘4’ seen on the 4hr chart.
A break of that level will confirm the bearmarket,
and should lead to a corrective rally in wave ‘2’ to begin.
GOLD
GOLD 1hr.
GOLD 4hr.
GOLD daily.
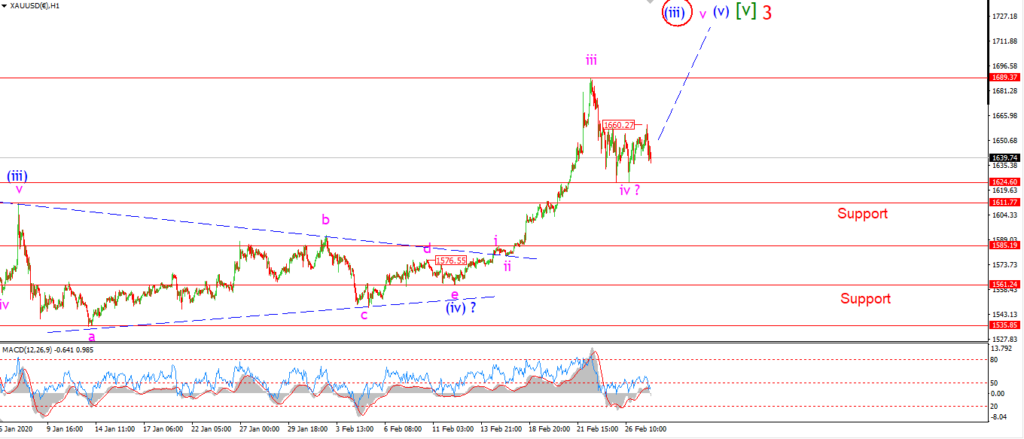
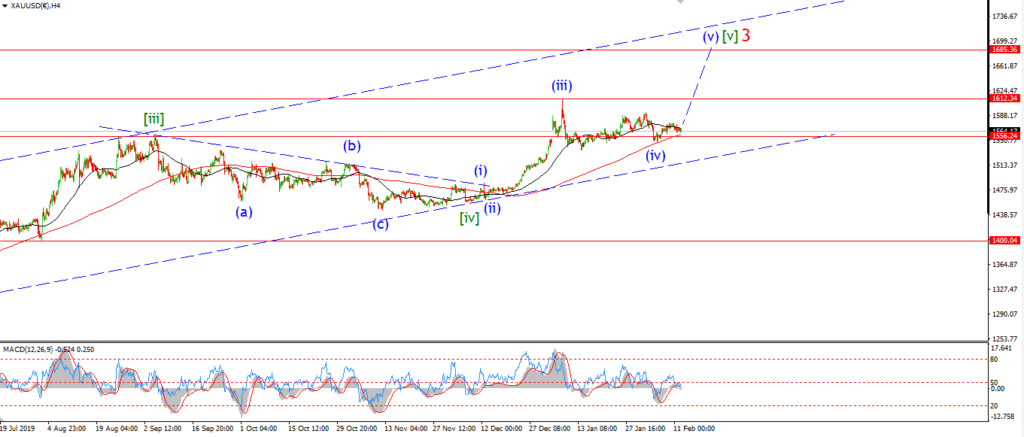
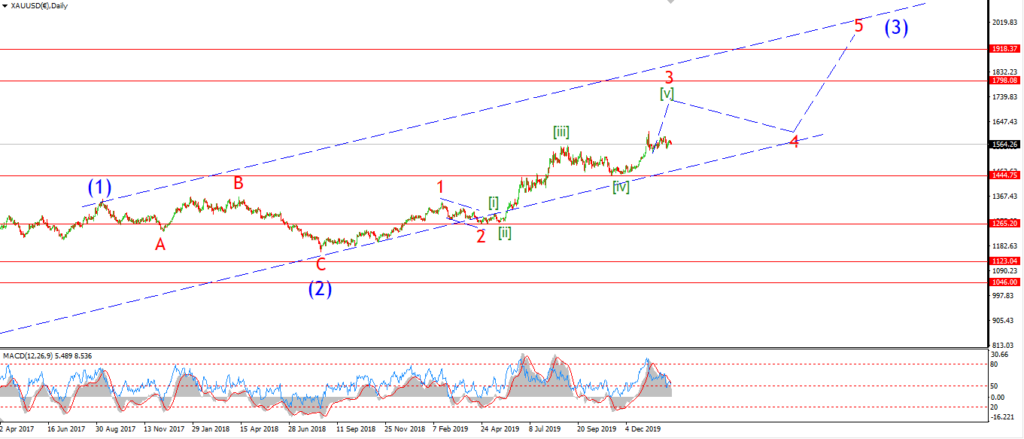
Gold is again holding the higher low above 1624.60 at wave ‘iv’.
As long as that level holds,
then I will stick to the bullish outlook in wave ‘v’ on the short term count.
The high of todays session reached 1660 again,
a break of this level again will confirm wave ‘v’ is underway.
And then we can expect a five wave rally back above 1689 again.
Tomorrow;
Watch for wave ‘v’ to hold above 1624 and continue higher above 1689.
CRUDE OIL.
CRUDE OIL 1hr.

CRUDE OIL 4hr.

CRUDE OIL daily.
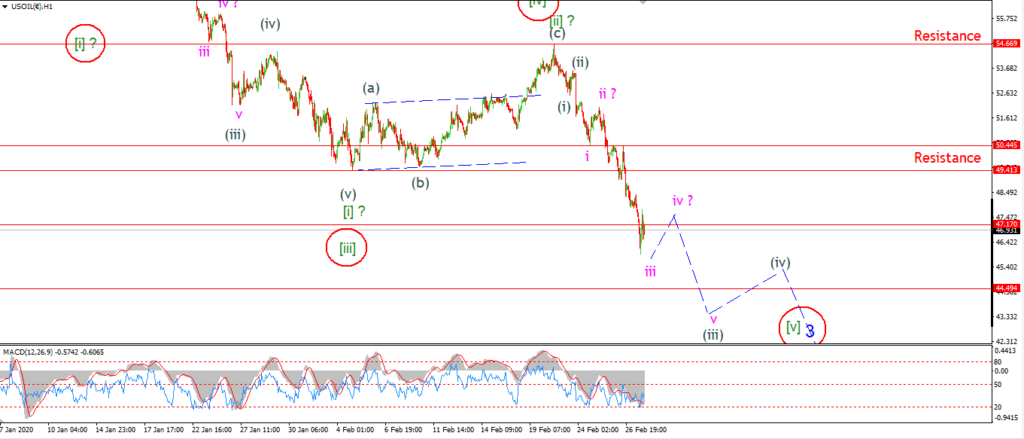
Crude took another dive lower today which has forced a rethink of the short term action.#
I had always expected this decline in wave [iii] to come eventually,
but I did think we would get a larger corrective lower high in wave (ii),
before the acceleration lower into wave (iii) of [iii].
But here we are!
Todays decline is viewed as part of wave (iii) of [iii] as per the main count,
or wave (iii) of [v] in the alternate count.
Tomorrow;
If this interpretation is correct,
then wave (iii) should continue lower for the next few sessions.
Wave ‘ii’i of (iii) should hold below resistance at 49.40 as wave (iii) develops.
S&P 500.
S&P 500 1hr
S&P 500 4hr
S&P 500 daily.
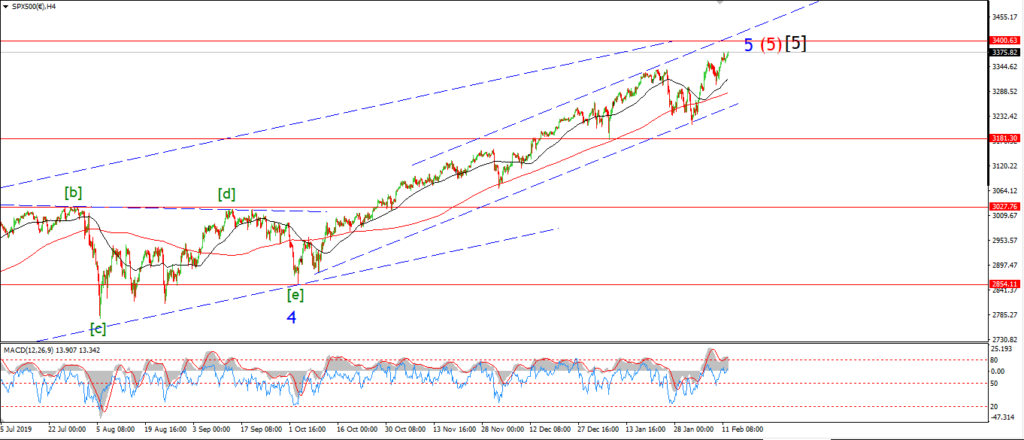
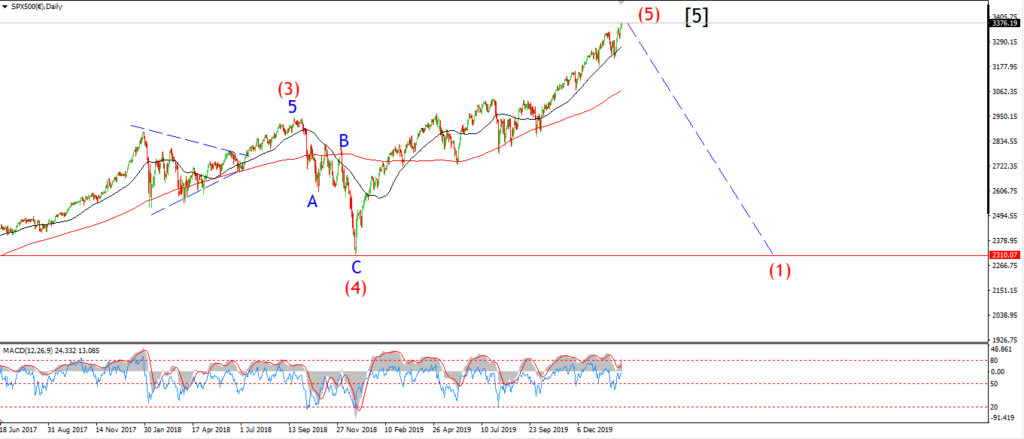
The short term count in the S&P gets an upgrade today also.
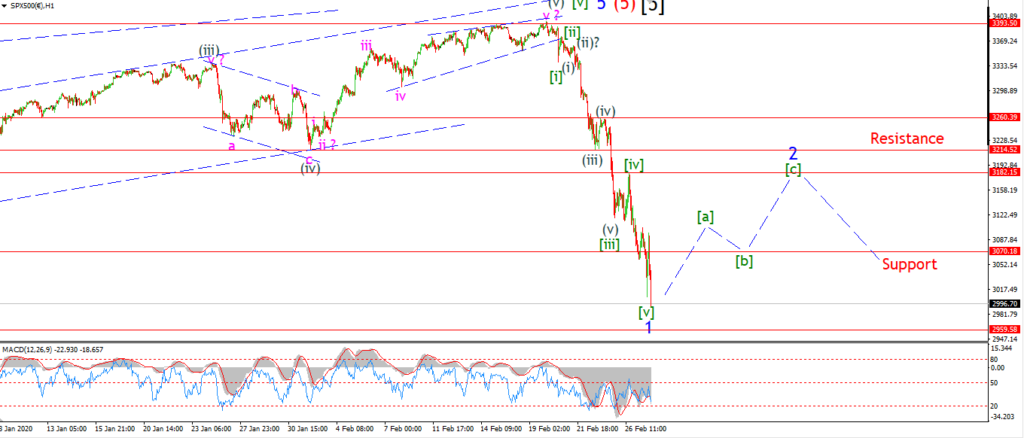
This decline is now viewed as wave ‘1’ down, for the same reasons as in the DOW.
And we should be closing in on the lows of that decline now.
Wave ‘1’ is down 370 points so far,
and it was a real humdinger alright!
But wave ‘2’ is the real key to the disaster that lies ahead for the stock market and for the economy as a whole.
I expect we will see a rebound begin soon enough in wave ‘2’.
And that rally should trace out a three wave correction higher.
The likely target zone for that rally lies between 3180 and 3260 where we have a cluster of previous fourth waves.
When wave ‘2’ completes,
we will have a very large bearish impulse wave staring us in the face.
This action should give way to a much larger ‘crash’ type scenario in wave ‘3’ down.
Wave ‘3’ should take the market down towards 2500 again.
Tomorrow;
Watch for wave ‘1’ to find a low in the area of 3000 again before wave ‘2’ begins.
SILVER.
SILVER 1hr
SILVER 4hr.
SILVER daily.
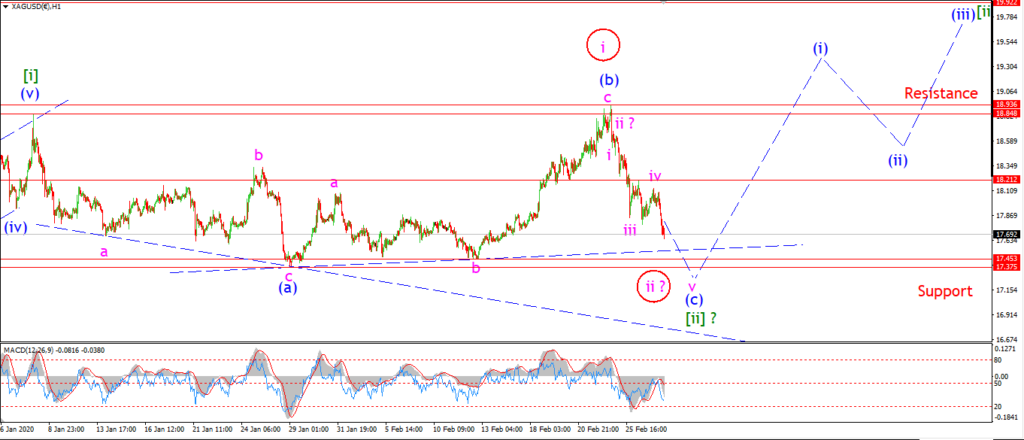
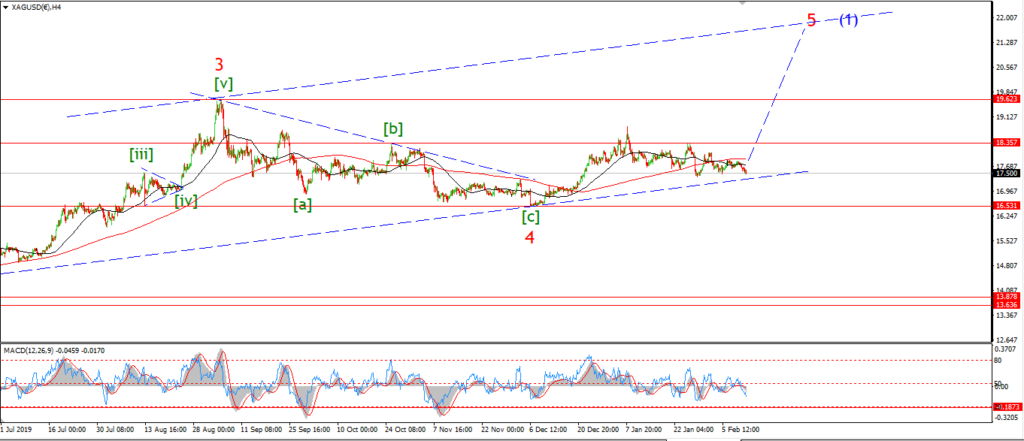
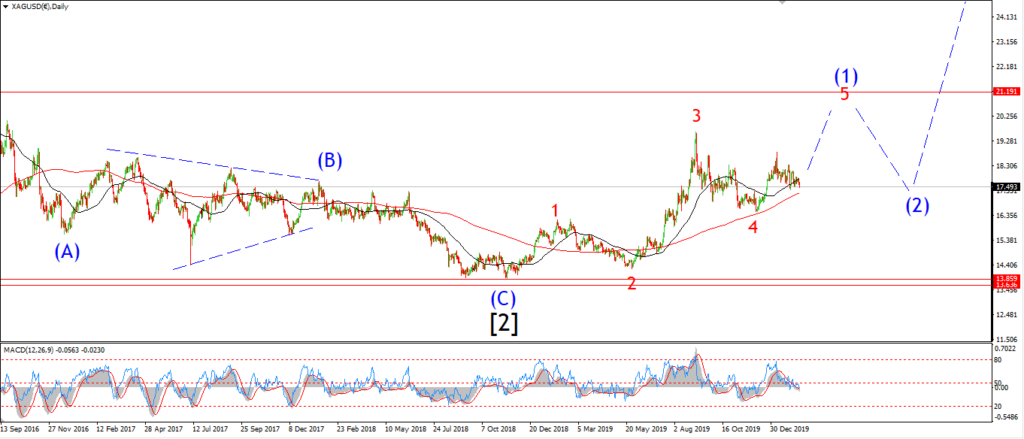
Silver is not holding up as well as Gold at all after the recent selloff.
The relentless nature of the decline is forcing me to reconsider the alternate count for wave [ii] green.
The decline off the high can be counted as an ongoing five wave structure in wave (c) of [ii].
in this scenario,
silver will break 17.37 again,
before then beginning to work higher in wave [iii].
Tomorrow;
The alternate count is the more bullish wave ‘i’ ‘ii’ scenario.
If the price rallies above 18.21 again,
that will shift the focus back to the bullish side in the short term.
Watch for wave (c) to complete with a break of 17.37.
U.S 10YR.
US 10YR 1hr.
US 10YR 4hr.
US 10YR daily.
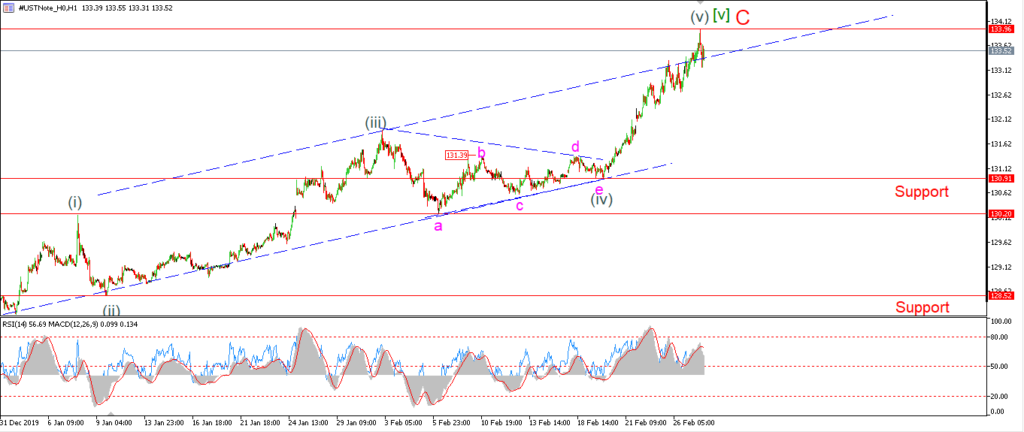
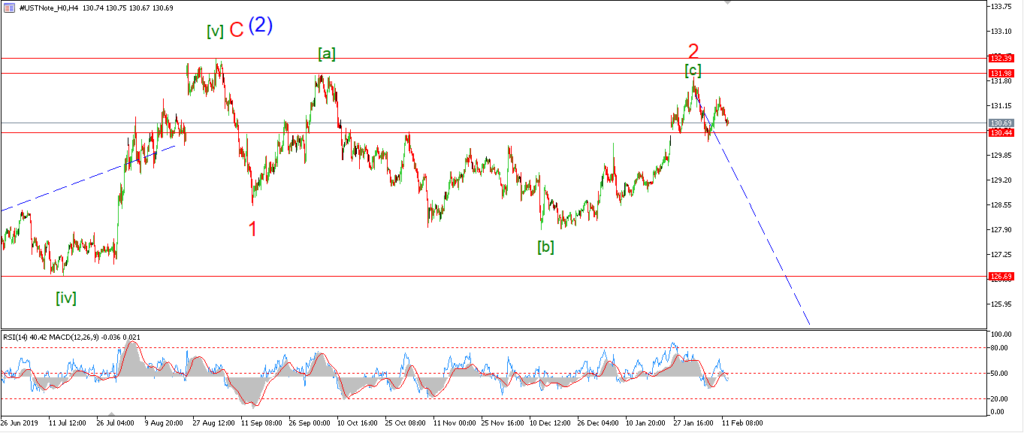
This evenings trade is going in the right direction again for a change!
After making a new high at 133.96,
the price took a turn lower and broke back into the trend channel again.
If we see a follow through to the downside tomorrow,
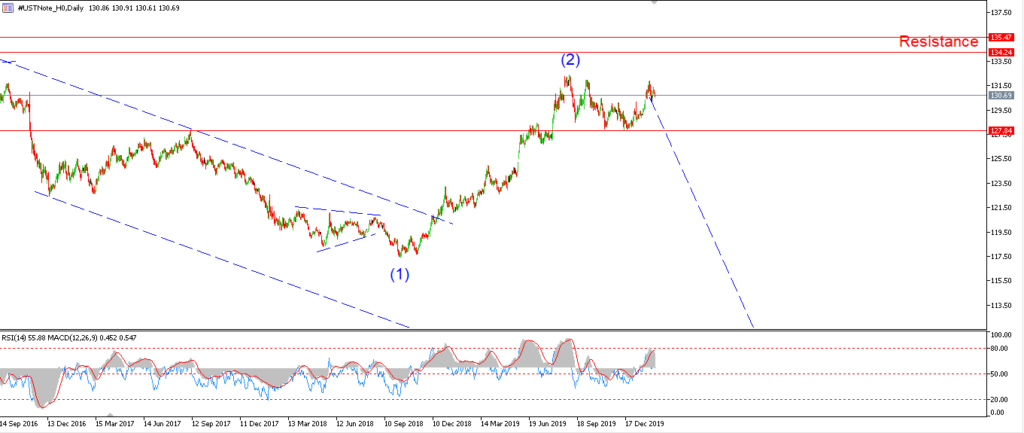
that will signal the possibility that wave ‘C’ has topped out.
A five wave decline from here that breaks below 130.91 again should be the confirmation we need that the trend is changing.
Tomorrow;
watch for 133.96 to hold,
a continued drop in a five wave form should continue.