
Good evening all.
Its the last days of January and right on que the market tanks! The pattern is getting interesting on that front now and so is the pattern in the metals.
So lets get into it shall we.
Here’s the weekend video recorded earlier this morning.
EURUSD.
EURUSD 1hr.

EURUSD 4hr.
EURUSD daily.
Ok,
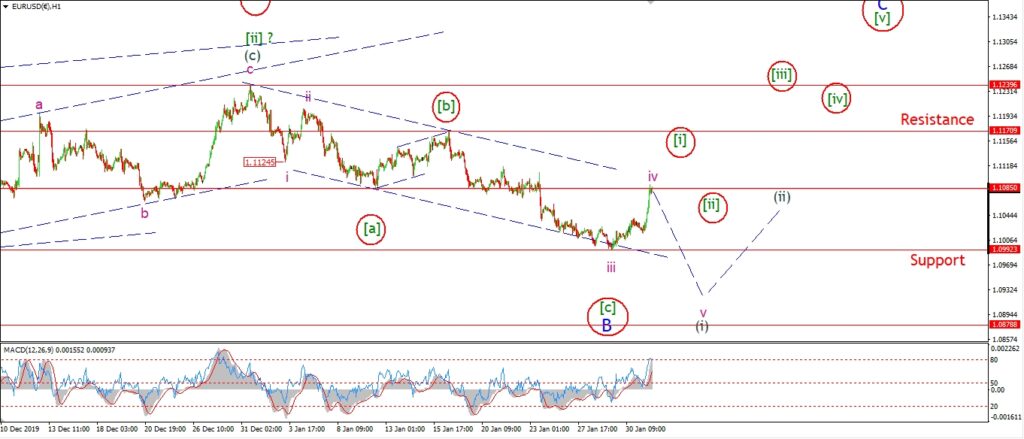
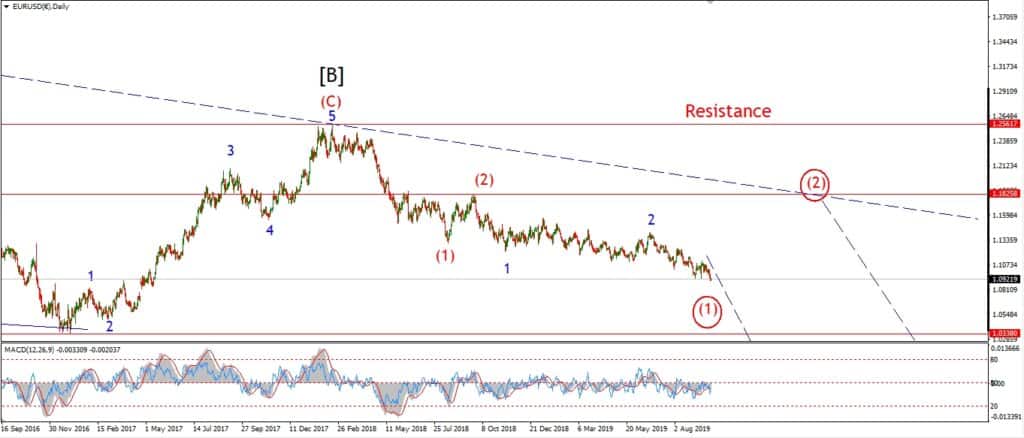
we are fast moving towards the alternate count in EURUSD today.
I have mapped out a path for the alternate count this evening,
this allows for a rally up to the 1.1400 level in wave ‘C’ in five waves as shown.
I have not switched to this count yet,
as I want to see a five wave pattern develop off the lows.
So far the rise off 1.0990 is still a three wave pattern.
This may develop further on Monday and give us enough to switch counts.
Monday;
If price falls again on Monday and breaks 1.0990, that will affirm the bearish count.
however,
a five wave rise in wave [i] alternate will force us to switch sides.
We may even get a bullish higher low early next week at wave [ii] as shown.
We are at an interesting turning point now with a possible bullish trade coming our way at wave [ii].
GBPUSD
GBPUSD 1hr.
GBPUSD 4hr.
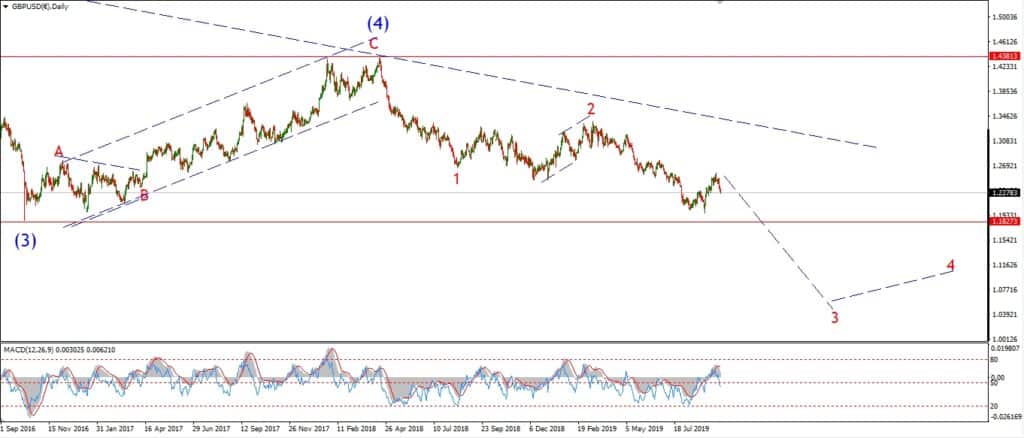
GBPUSD daily.
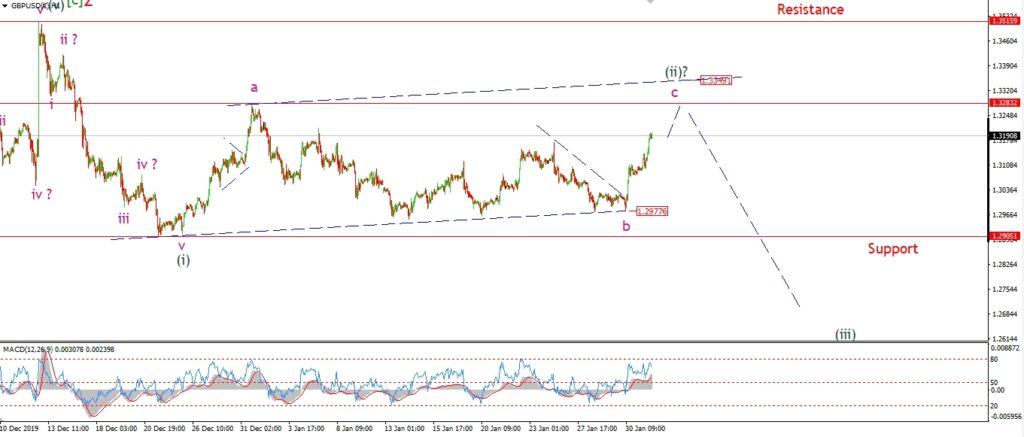
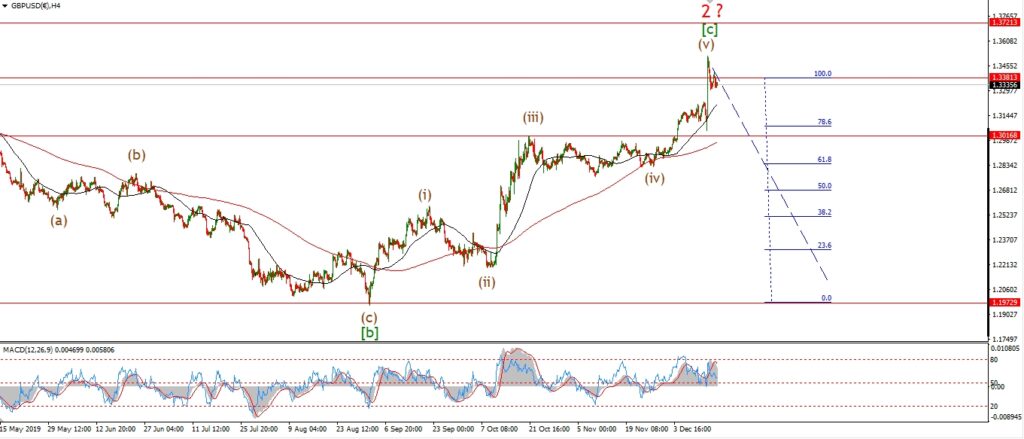
Cable is rallying in wave ‘c’ as called for by the short term count.
The minimum target for wave ‘c’ lies at 1.3283.
This is where wave ‘c’ will break the high of wave ‘a’ and complete a three wave pattern in wave (ii).
Once wave ‘c’ completes a five wave rally and hits the target area,
then I will look lower again to begin wave (iii) down.
Monday;
Watch for wave ‘c’ up to push higher into target at 1.3283.
The price will hit the upper trend channel line at 1.3350.
USDJPY.
USDJPY 1hr.
USDJPY 1hr.
USDJPY daily.
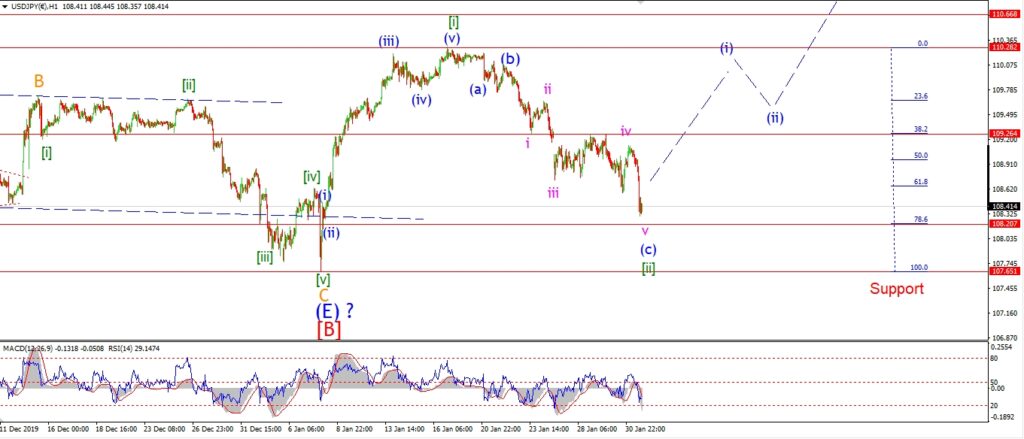
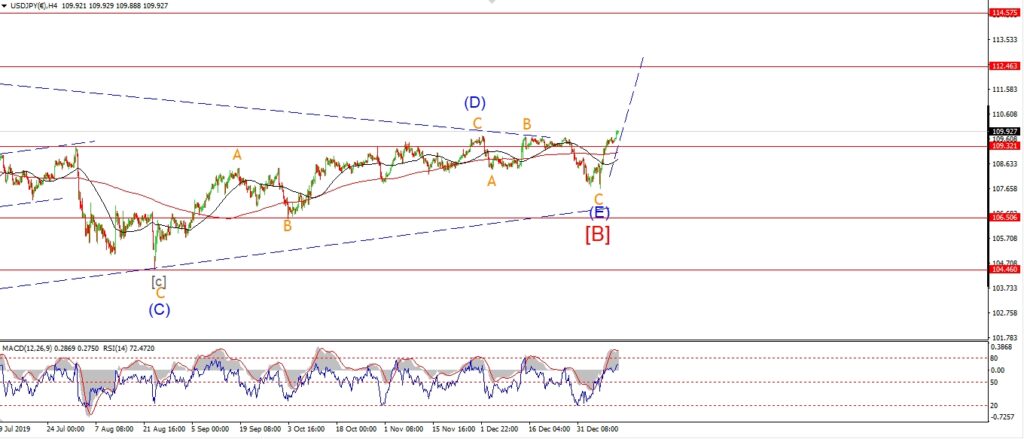
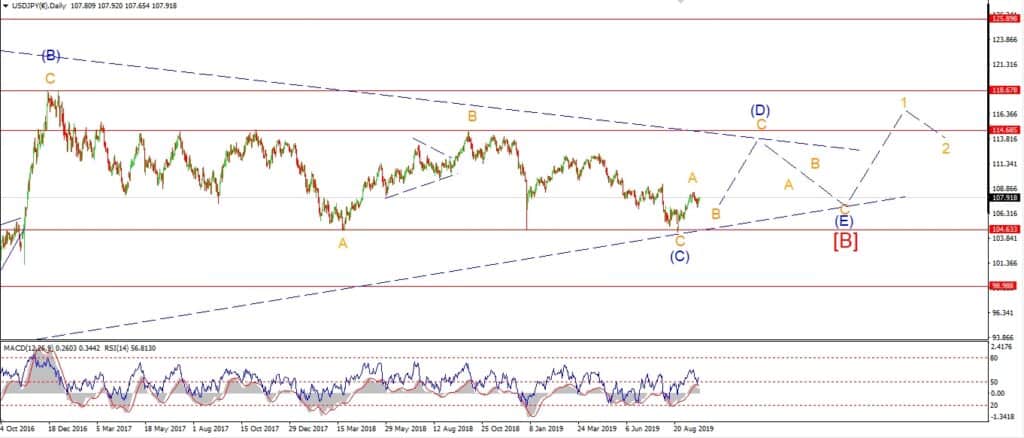
The action in USDJPY is really starting to push the limits allowed in this bullish count.
If this decline breaks 107.65,
I will have to rethink the pattern at the larger timeframe.
For the moment this decline still counts as a corrective decline.
So wave [ii] is still a possibility.
Monday;
Watch for wave (c) of [ii] to find a low soon.
A break above 109.26 again will signal that wave (i) up has begun.
DOW JONES.
DOW 1hr.
DOW 4hr
DOW daily.
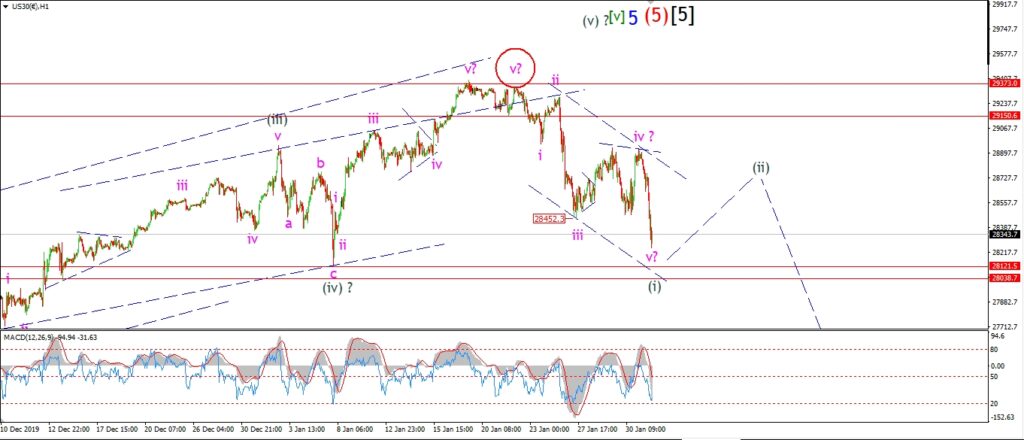
The DOW is really starting to develop a very interesting pattern right now.
the pattern was calling for another drop in wave ‘v’ of (i).
And todays decline has fulfilled that requirement.
So;
It is possible that wave (i) down has completed a five wave decline is now drawing to a close.
A break of that initial support level at 28120 again,
will add to the bearish setup.
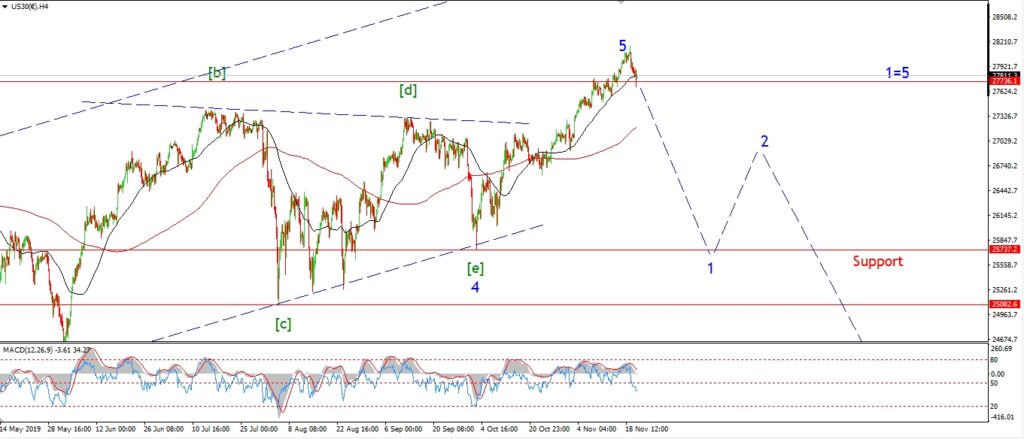
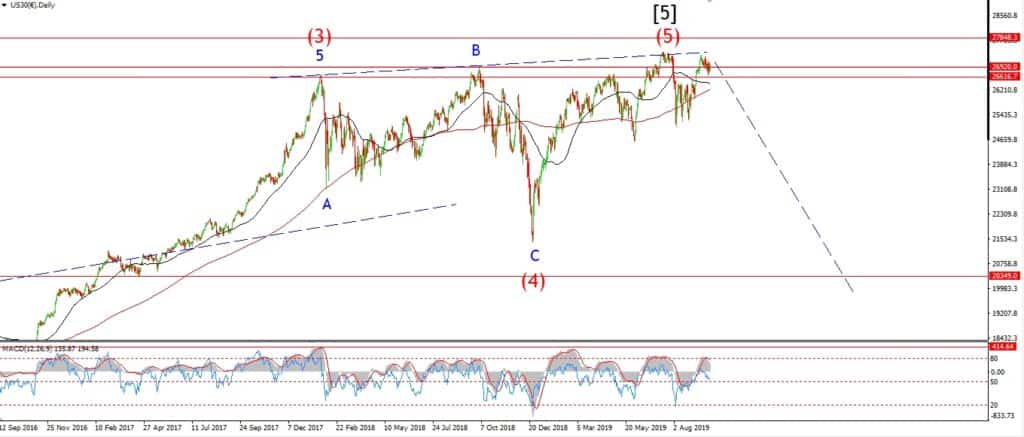
And when you take a step back and look at the whole pattern around the top,
it may be that the market is about to complete a larger head and shoulders pattern.
This will occur after a correction to a lower high in wave (ii).
So I will be watching that pattern as it develops.
Monday;
I would like to see a break of support at 28100,
but I think wave (i) will find a low pretty soon after that.
And then we should begin a correction higher in wave (ii).
Next week may bring us a completed bearish impulse wave at the wave (ii) lower high.
And then we can prepare for a sustained drop into wave (iii).
GOLD
GOLD 1hr.
GOLD 4hr.
GOLD daily.
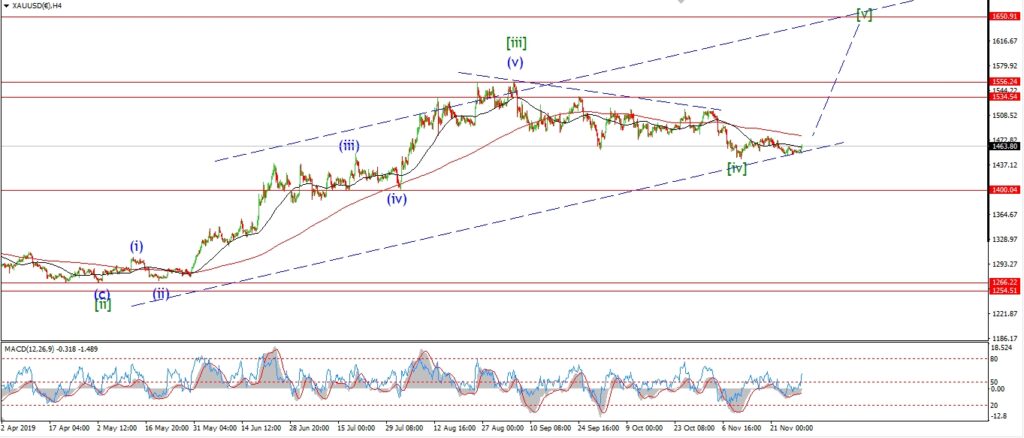
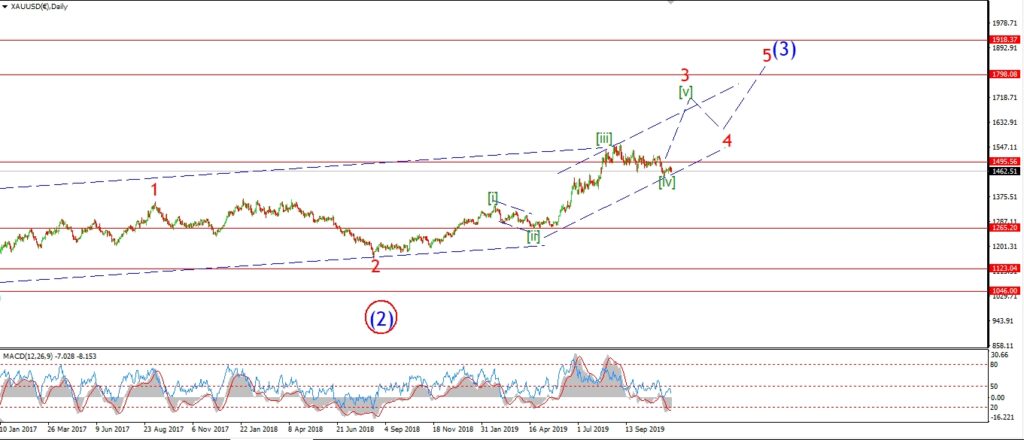
I mentioned the possibility of another wave count in the video today,
which could explain the recent corrective action in gold.
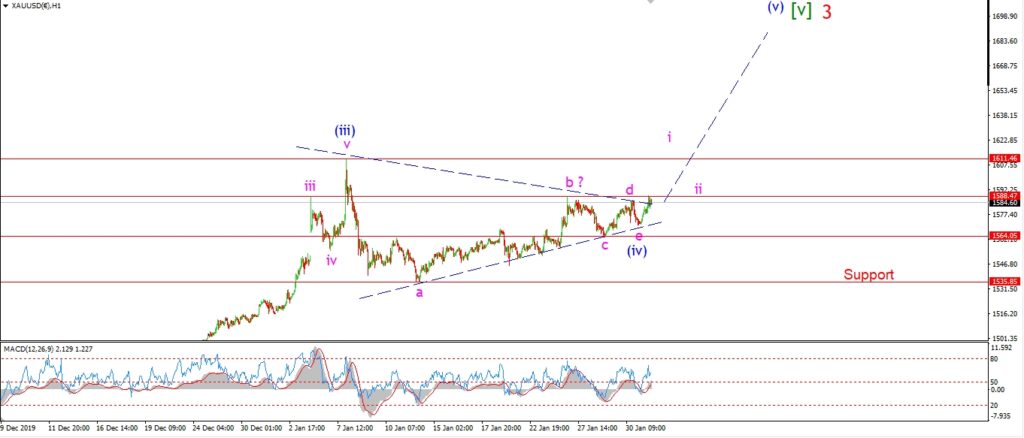
After todays failure to drop further in wave ‘c’ of (ii).
I have now switched to that alternate count this evening.
This count labelled the recent sideways action as a contracting triangle in wave (iv) of [v].
And it now calls for a rally in wave (v) of [v] to push us up towards the 1700 level.
Monday;
If this triangle is correct,
then the low at 1564 should hold.
A break of this level will rule out the triangle scenario.
Wave ‘i’ of (v) should begin now and break above the recent highs at 1611 again.
CRUDE OIL.
CRUDE OIL 1hr.
CRUDE OIL 4hr.
CRUDE OIL daily.
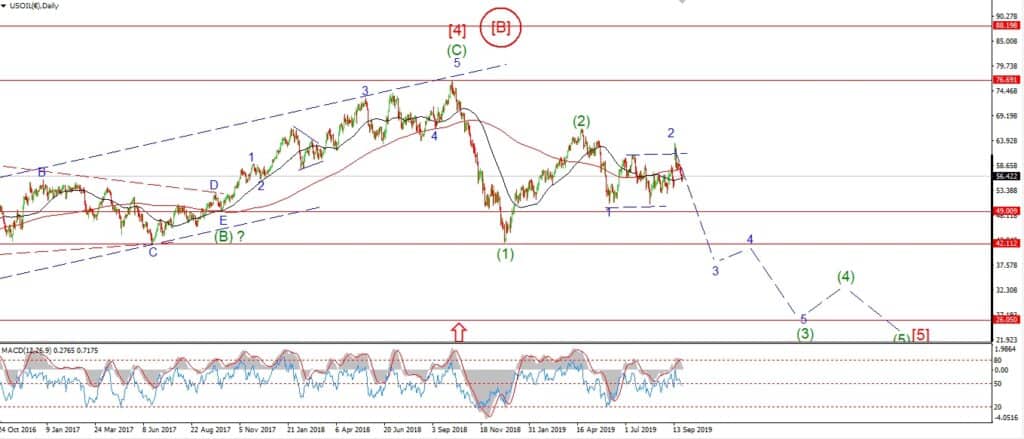
Crude oil cannot catch a break these days!
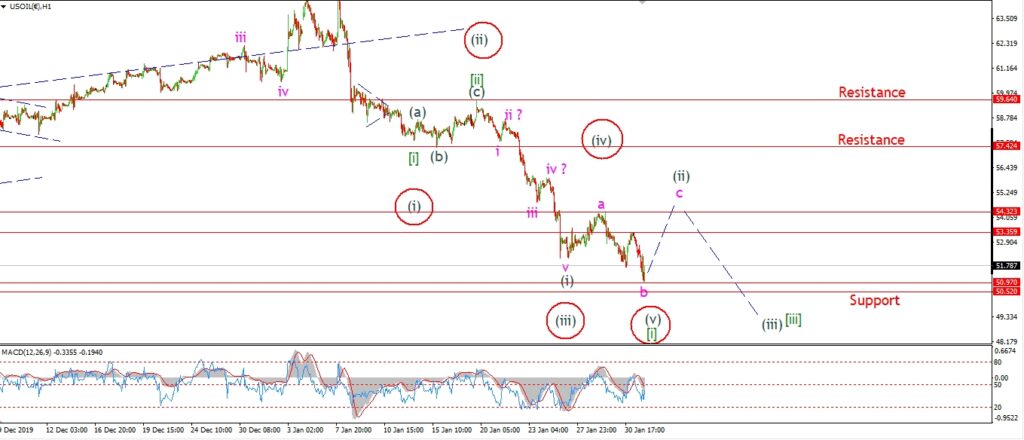
The decline today has traced out three waves overall off the wave ‘a’ high at 54.32.
So this still counts as a possible wave ‘b’ of (ii).
Where wave (ii) will trace out an expanded flat correction.
And wave ‘c’ of (ii) will rally again back to the wave ‘a’ high again.
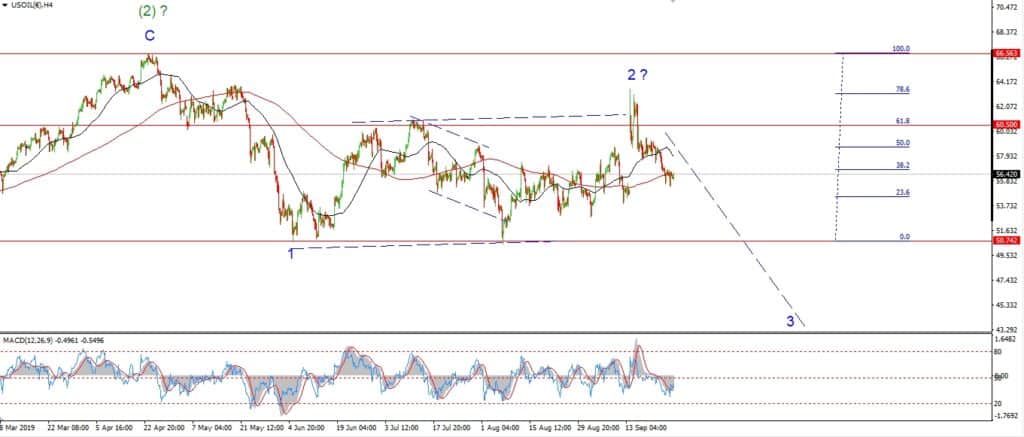
I have also expanded the alternate count tonight.
This count is tracking a possible five wave decline off the high.
And the price is now falling in wave (v) of [i].
If we see a clear five wave pattern lower
develop off that 54.32 level over the next days or so.
Then I will switch to the alternate count.
Monday;
Wave ‘b’ should find support at these lows.
Watch for a break of 53.36 again to signal wave ‘c’ has begun.
A further decline below support at 50.50 again will favor the alternate count.
S&P 500.
S&P 500 1hr
S&P 500 4hr
S&P 500 daily.
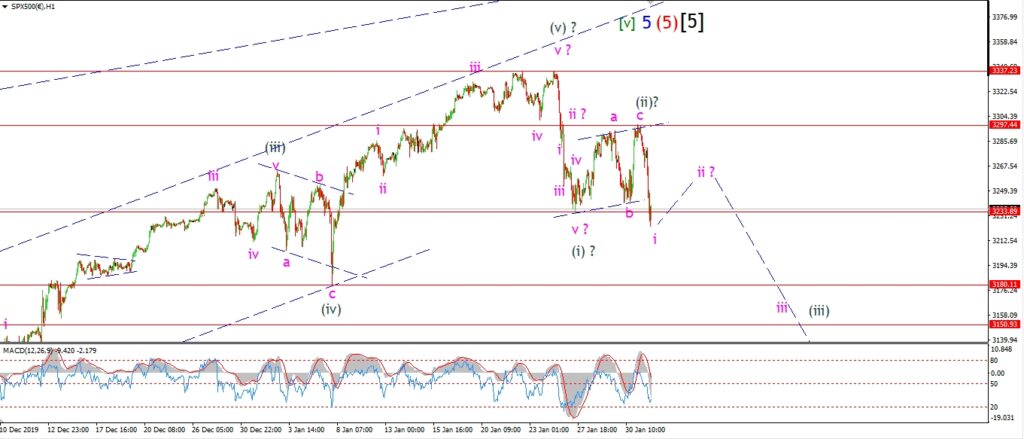
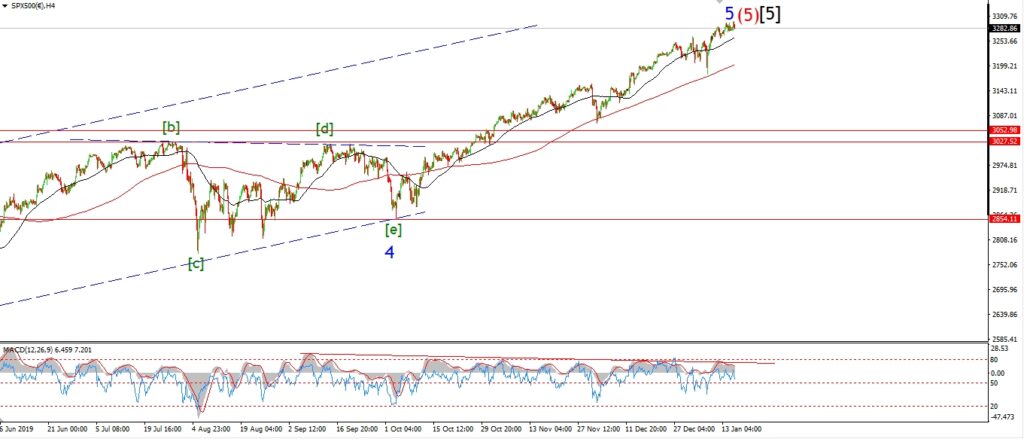
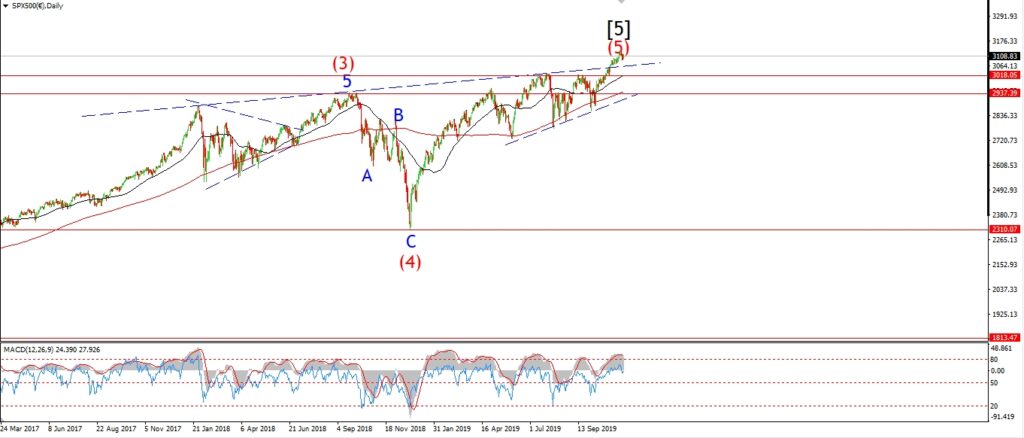
The aftermarket trade last night brought the price right back to that upper trend line in wave (ii).
Wave ‘c’ of (ii) hit the target to complete a three wave correction.
And then this morning,
futures sold off,
the pre-market trade opened lower,
and the price fell throughout the session breaking the low formed on Tuesday.
Todays trade may well have started a decline into a larger wave (iii) down.
And if that is the case,
then wave (iii) should take out that important near term low at 3180 at the previous fourth wave.
Monday;
Todays decline is labelled as wave ‘i’ of (iii).
So we should see a corrective lower high form below 3297 early next week at wave ‘ii’.
Wave ‘iii’ of (iii) should then carry the price back towards the 3150 level in five waves.
The wave (ii) high must hold from here.
SILVER.
SILVER 1hr
SILVER 4hr.
SILVER daily.
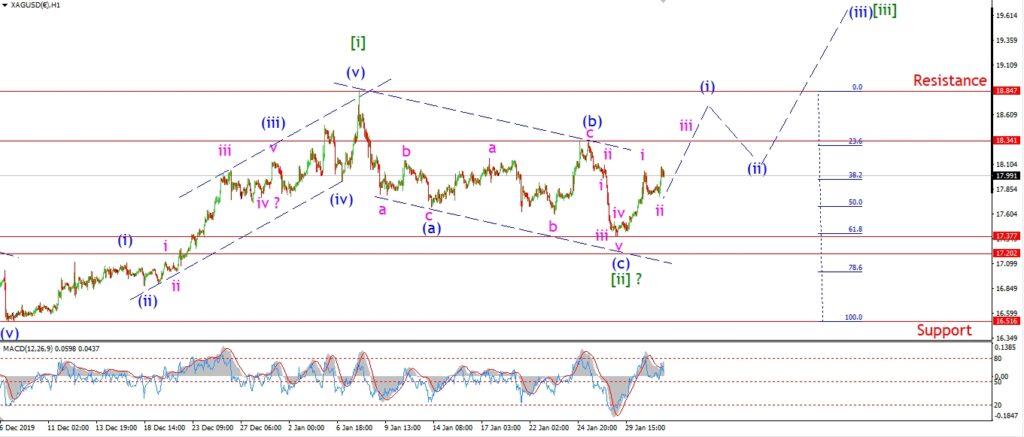
Silver dropped in a small three wave pattern in wave ‘ii’ this morning,
and then we saw a spike higher this afternoon.
This may be the first move higher in wave ‘iii’ of (i) as shown.
Wave ‘iii’ should break the recent high of wave (b) at 18.34.
And if that happens,
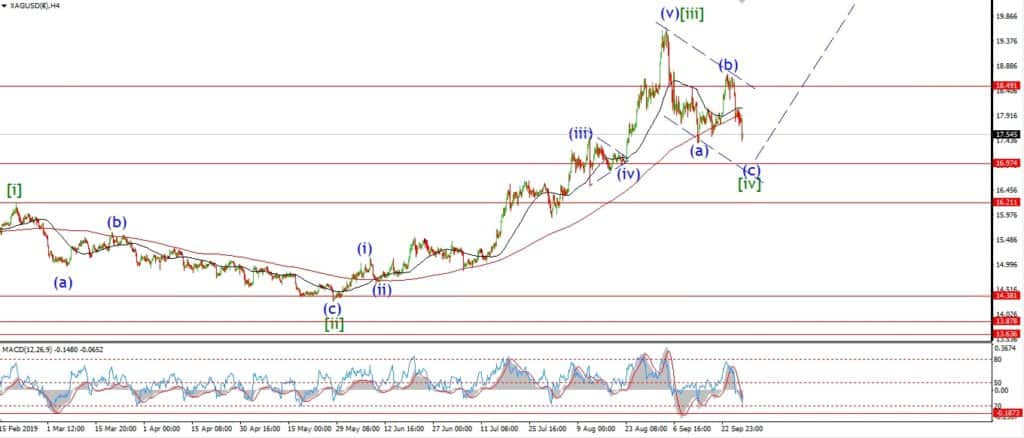
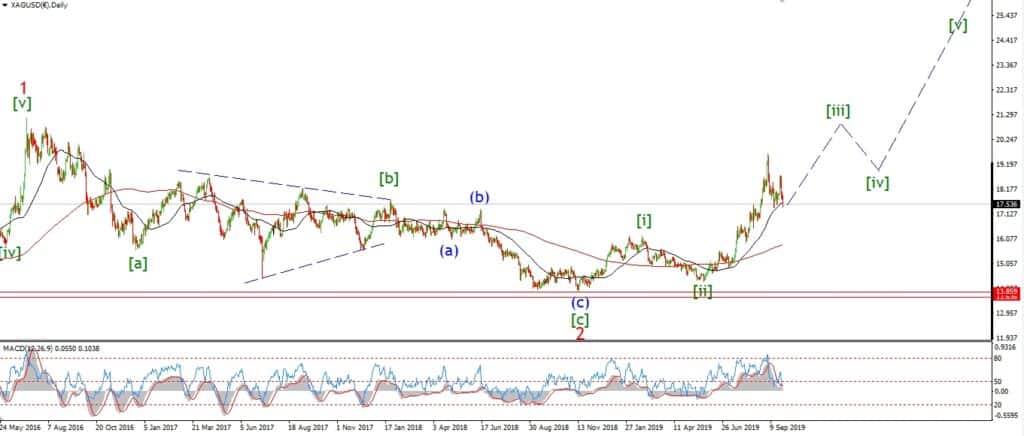
it will be a strong signal that the larger wave [iii] has begun.
Monday;
Next week is looking up as wave (i) should push up towards resistance again.
Watch for the low at 17.37 to hold from now on.
U.S 10YR.
US 10YR 1hr.
US 10YR 4hr.
US 10YR daily.
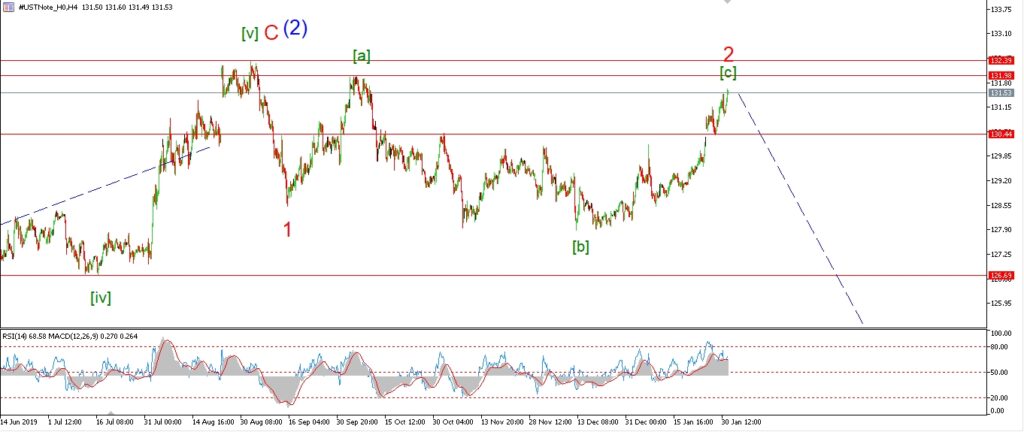
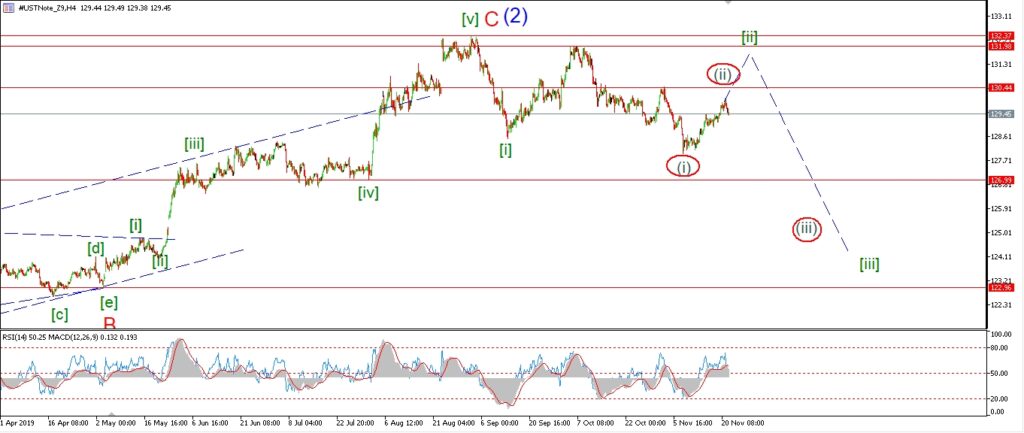
We are approaching a critical level in the 10YR now.
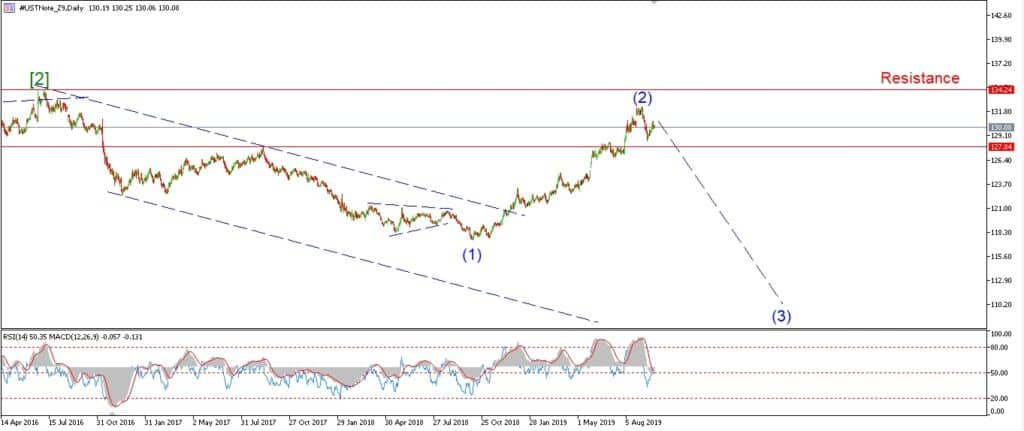
The Price has almost retraced the full decline off last Septembers high at 132.39.
Todays continued rally has forced a rethink on the longer term count.
It is still possible that this rally is part of a correction higher in wave ‘2’ red as shown.
But this rally must stop before 132.39 for this count to remain valid.
I am going to give this pattern a few days to play out before looking for a turn lower again.
Monday;
If the rally touches 131.98 and then fails with a sharp move lower.
That will signal the correction in wave ‘2’ is over.
Lets see how this goes on Monday.
Until Monday evening again,
Adios amigo’s.
God’s blessings to you all.
enda.