
Hello everyone.
EURUSD.
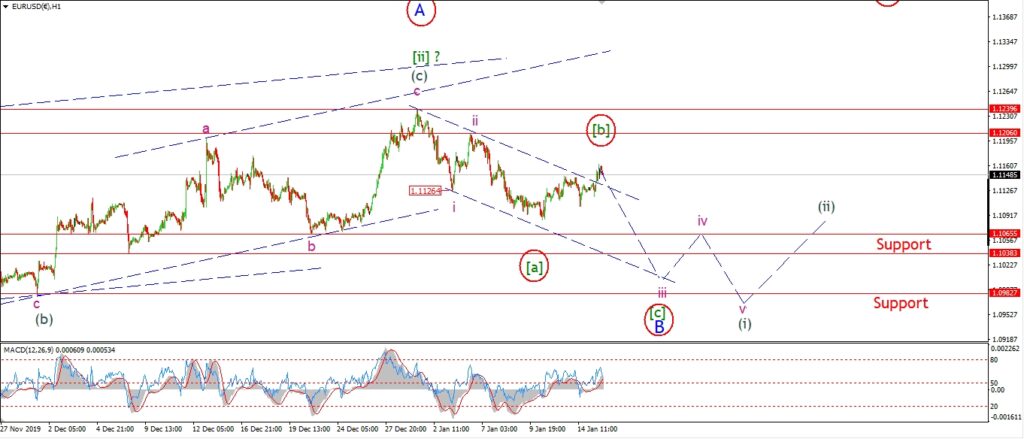
EURUSD 1hr.

EURUSD 4hr.
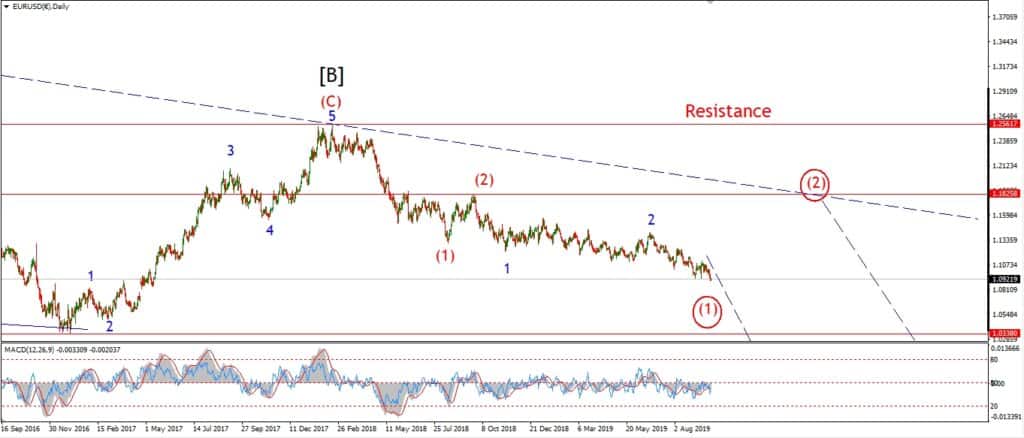
EURUSD daily.
The action in EURUSD has continued to grind to the upside in a very corrective fashion today.
This pattern can fit both the main count and the alternate count at the moment.
The main count calls for wave ‘iii’ down to carry the price lower,
so this correction can be part of an extended wave ‘iii’ pink.
Or;
in terms of the alternate count,
this correction higher could be wave [b] of ‘B’ as shown.
Both counts call for more downside to come in the short term.
Tomorrow;
Watch for wave ‘iii’ or wave [c] to turn lower again.
1.1206 must hold in both scenarios.
GBPUSD
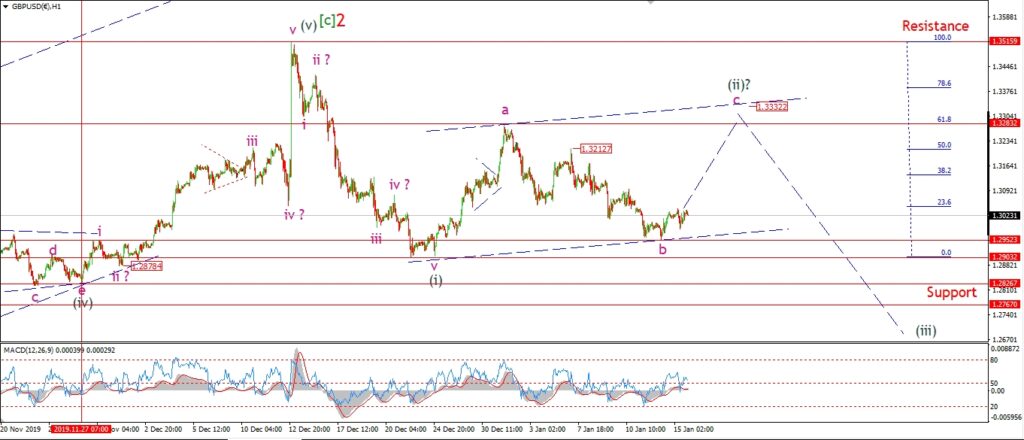
GBPUSD 1hr.
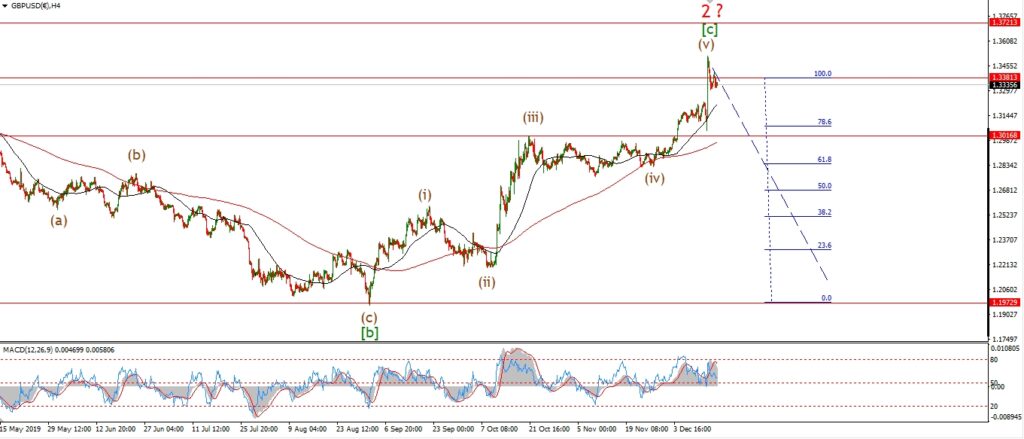
GBPUSD 4hr.
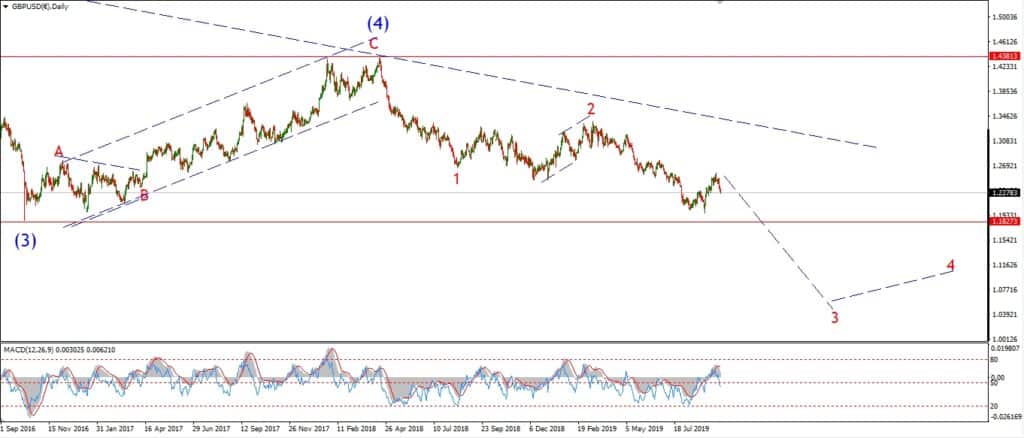
GBPUSD daily.
GBPUSD is slowly rising off Tuesdays lows today.
the pattern has not developed impulsively off the wave ‘b’ low just yet,
so it is early days for this wave ‘c’.
Wave ‘c’ will be confirmed with a break above 1.3212,
and the target for wave ‘c’ lies at the upper trend channel line at 1.3332.
Tomorrow;
If wave ‘c’ is now underway then price should hold above 1.2952.
wave ‘c’ should develop in a five wave pattern overall.
USDJPY.
USDJPY 1hr.
USDJPY 1hr.
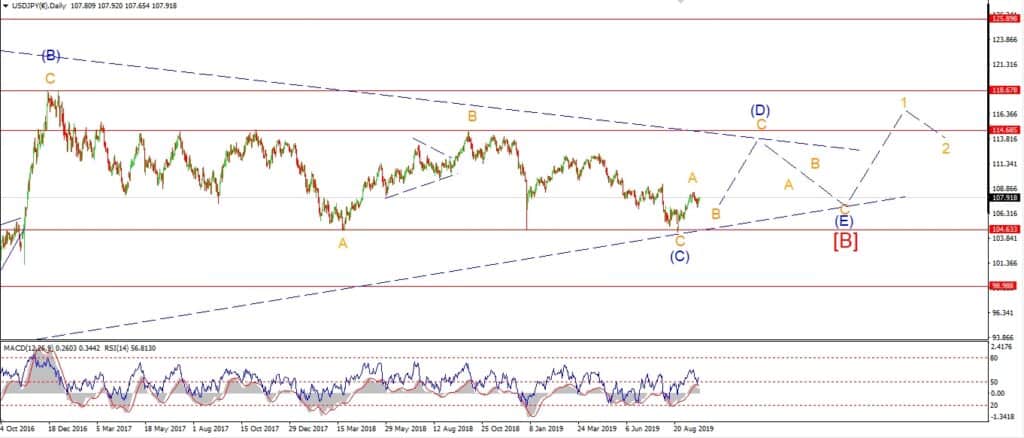
USDJPY daily.
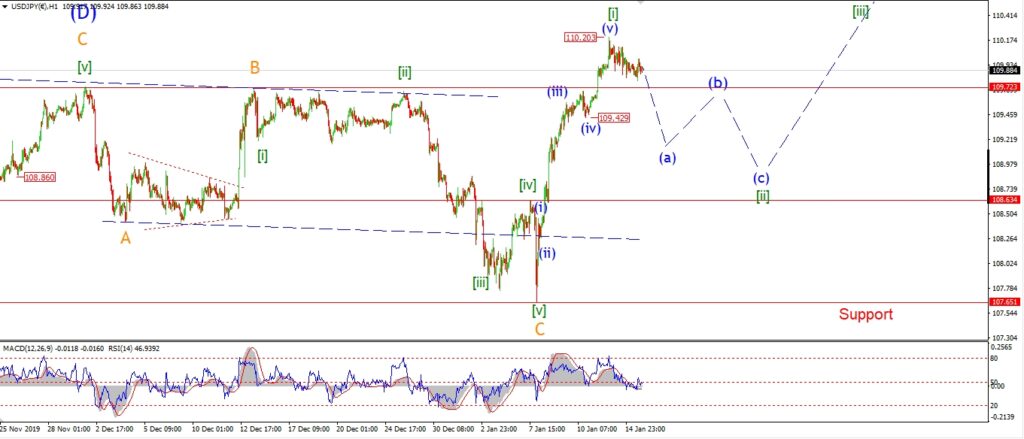
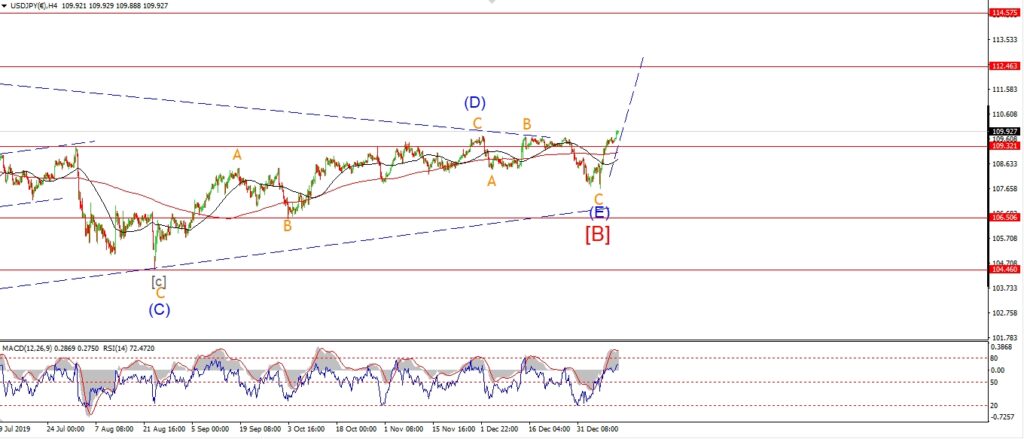
USDJPY is hanging on to the recent gains made in wave [i] so far.
I suspect wave [ii] will come in soon enough,
but the action off the high has not confirmed wave [ii] yet.
I think a break of the previous fourth wave at 109.42 will be enough to signal wave [ii] is underway.
The short term action is pretty messy off the high,
this could be a leading diagonal in wave ‘a’ of (a) but I will just have to let this play out to see how wave (a) develops.
Tomorrow;
watch for wave (a) down to take the price lower for the rest of the week.
109.42 is the initial target.
DOW JONES.
DOW 1hr.
DOW 4hr
DOW daily.
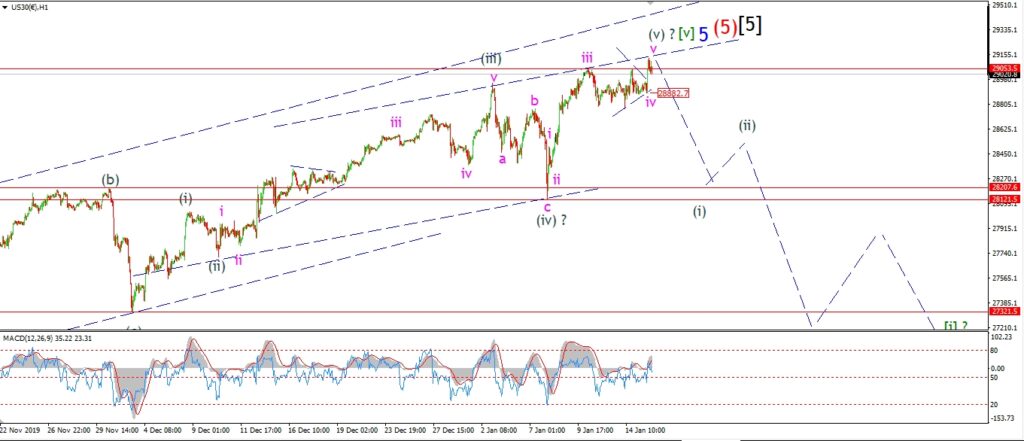
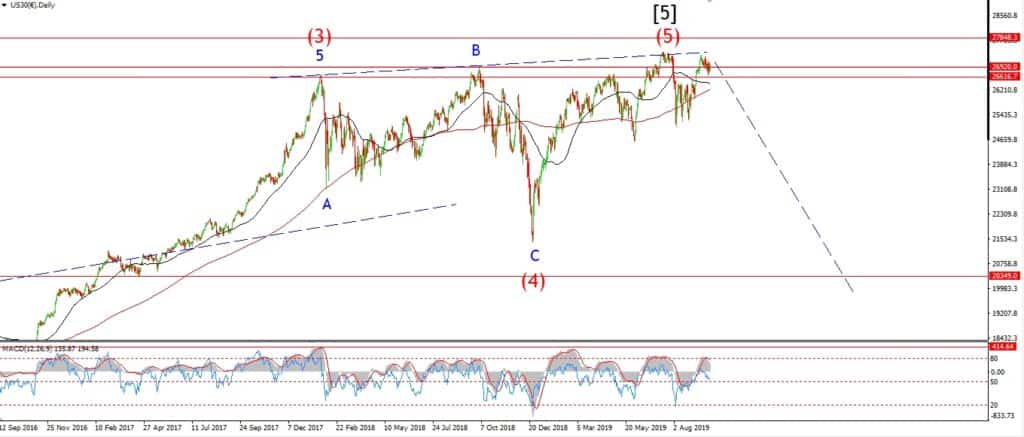
There is a good chance that the recent sideways action is all part of a contracting triangle as shown.
This triangle pattern is labelled as wave ‘iv’ of (v).
The price did spike higher again today to touch the upper trend channel line.
so this rally is likely part of wave ‘v’.
There has not been any reaction off the trend channel line as I write.
If there is no drop off the high tomorrow,
and price holds above 29000,
then we may be looking at an extension higher in wave ‘v’ pink.
Tomorrow;
Watch for a possible break of 29000 again and a continuation lower in wave (i).
GOLD
GOLD 1hr.
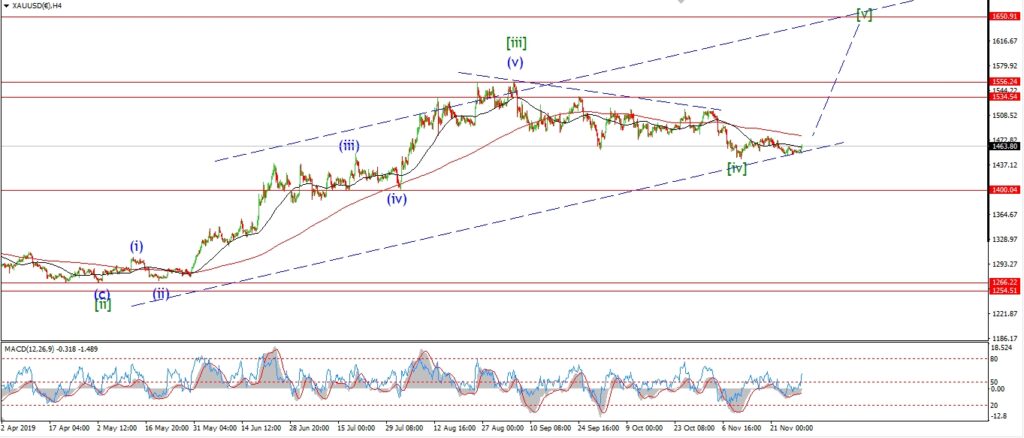
GOLD 4hr.
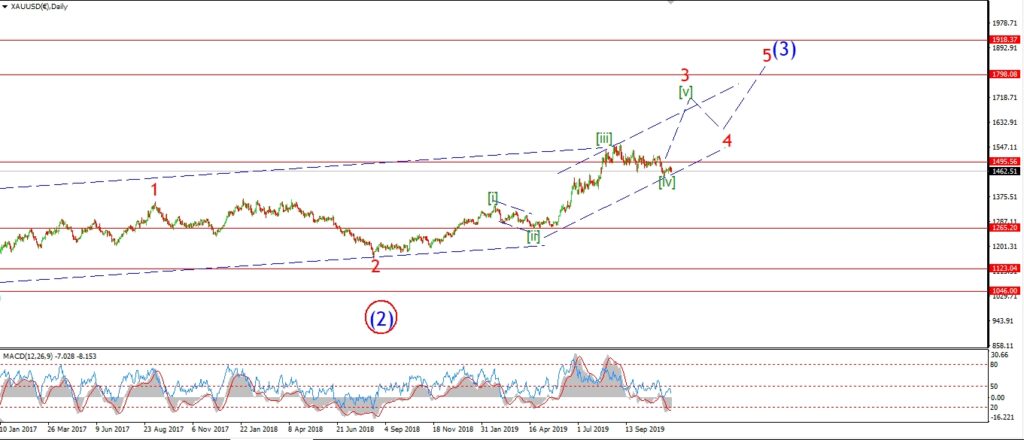
GOLD daily.
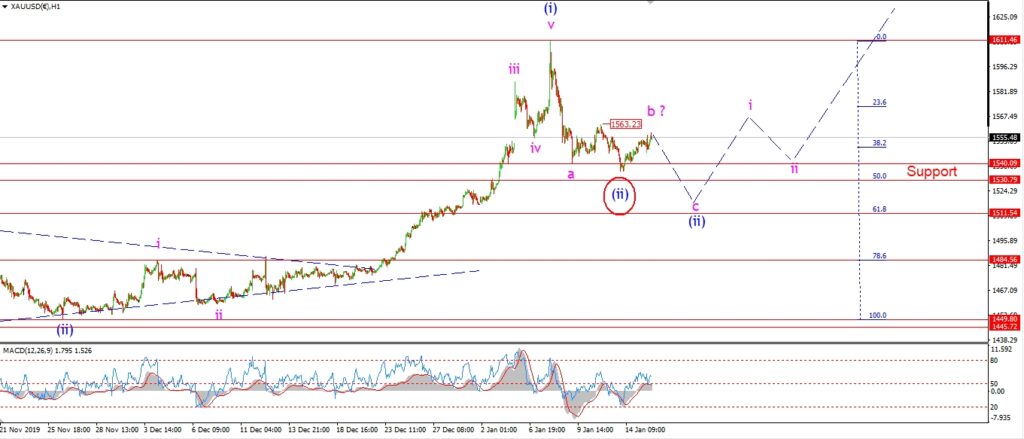
Gold turned higher off support again today.
This is now viewed as a small ‘c’ wave to complete wave ‘b’ pink as shown.
Wave ‘b’ can be either an expanded flat, or a running flat.
A break above the interim high at 1563 will classify wave ‘b’ as an expanded flat.
And then we are likely to see a decline again into wave ‘c’ of (ii).
Wave ‘c’ of (ii) should find support at the 62% retracement at 1511.
Tomorrow;
Watch for wave ‘b’ to top out above 1563 and then turn lower into wave ‘c’.
CRUDE OIL.
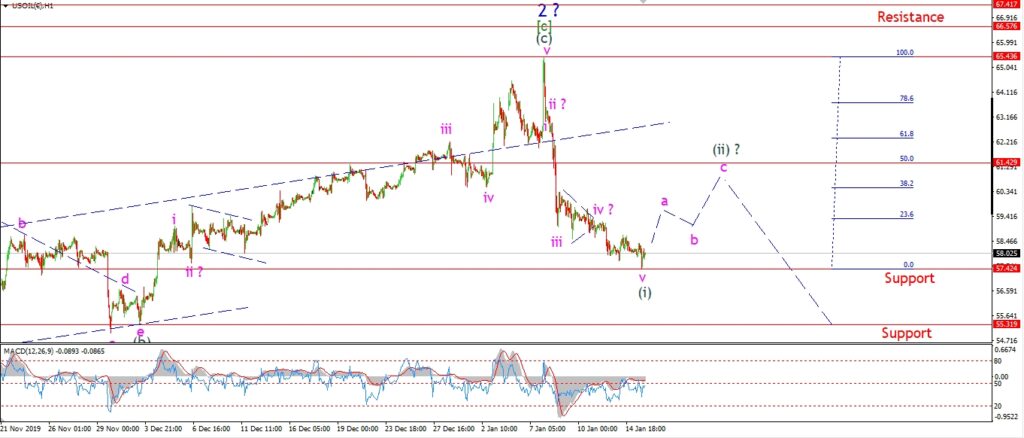
CRUDE OIL 1hr.
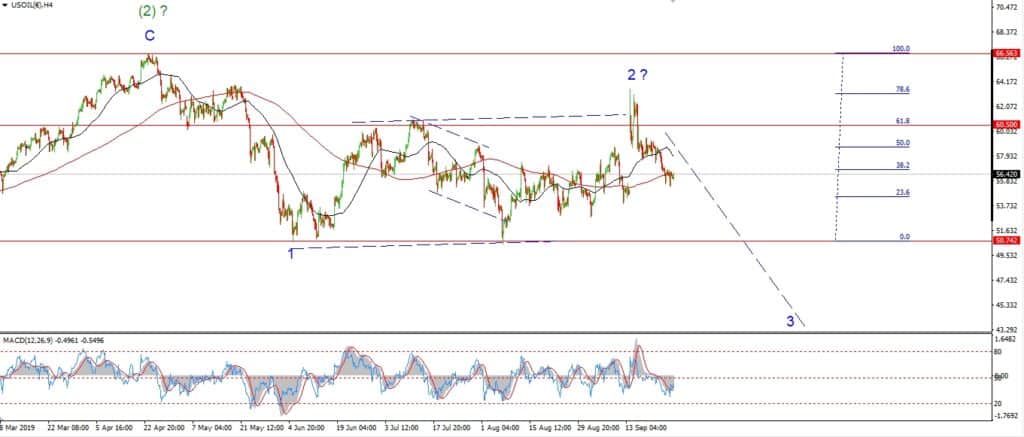
CRUDE OIL 4hr.
CRUDE OIL daily.
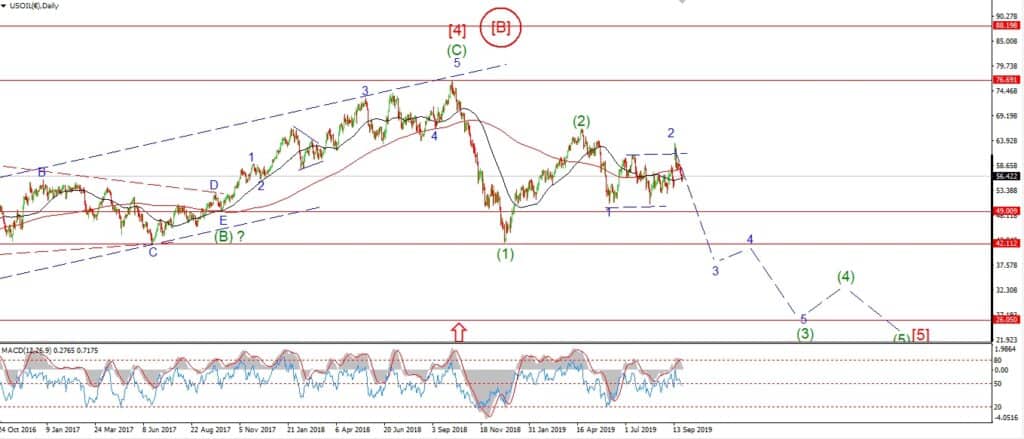
Crude oil is finding it hard to correct higher after that recent sharp decline.
Wave (ii) should begin soon,
but so far there is no sign of it!
The low of the session lies at 57.40 so this level takes the wave (i) label now.
The 50% retracement now lies at 61.40,
and this becomes the target for wave (ii).
Tomorrow;
Watch for wave ‘a’ of (ii) to begin with a push back above 59.00 again.
S&P 500.
S&P 500 1hr
S&P 500 4hr
S&P 500 daily.
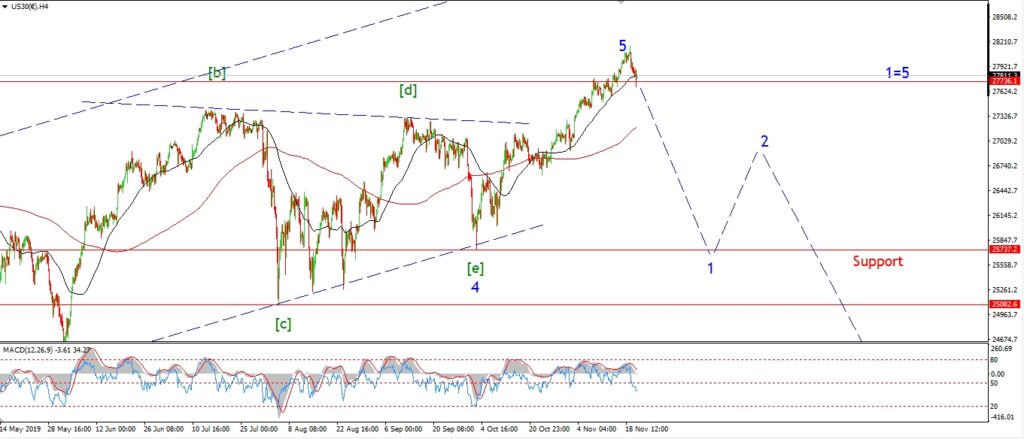
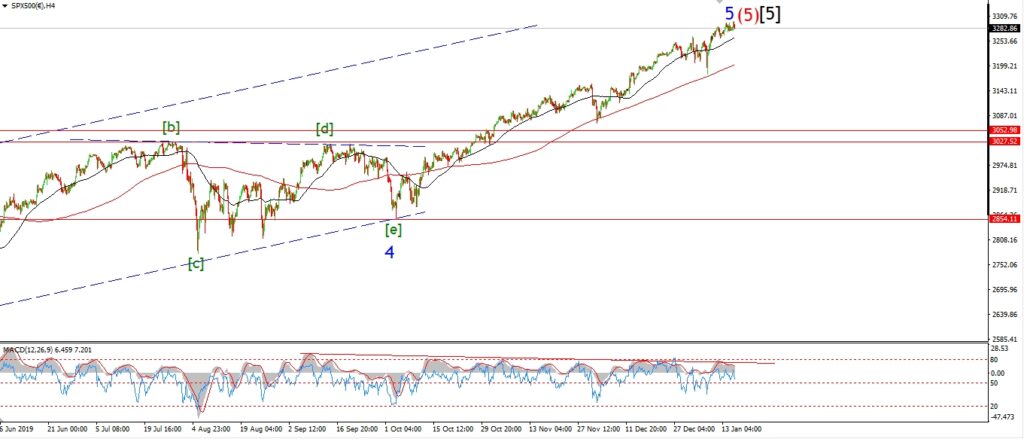
It is very interesting to note the subtle momentum divergence on the 4hr chart.
Ever since the beginning of this whole rally in wave ‘5’ blue back in October last.
The high in MACD was registered within the triangle wave ‘4’ on September 13th.
And off that momentum high,
MACD has registered a series of lower highs.
All the time the price was rallying to new extremes.
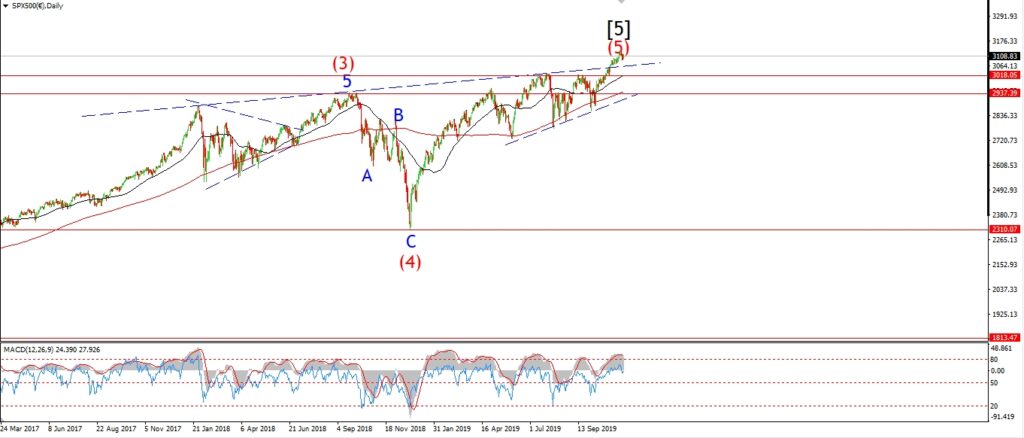
Leadership in this rally has been narrowing for the last year at this point,
add a momentum divergence on top of that in wave ‘5’,
and we have the technical setup in place for a sharp reversal.
Tomorrow;
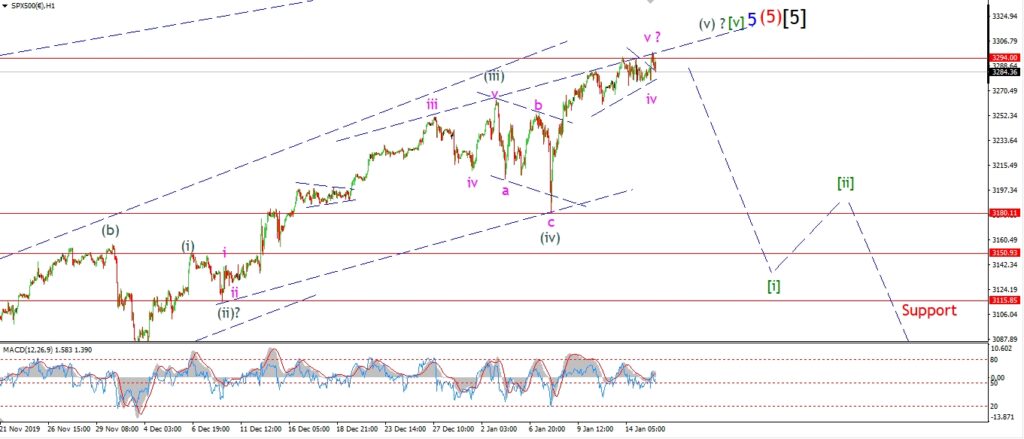
The short term pattern is unresolved at the moment.
There is no sign of a reversal off the upper trend channel line yet.
So I will have to wait and see how wave (v) concludes.
SILVER.
SILVER 1hr
SILVER 4hr.
SILVER daily.
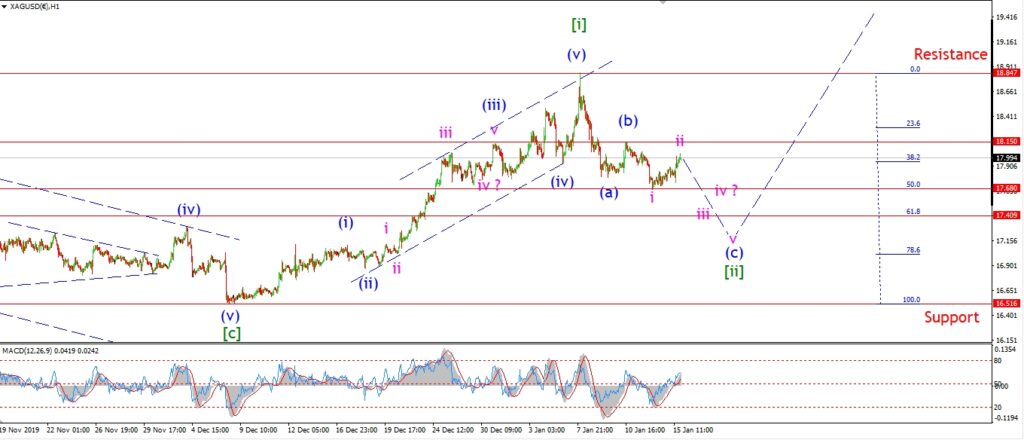
The rise off Tuesdays low looks more corrective in Silver than Gold,
so I think this may be a second wave correction as shown.
Wave ‘ii’ pink should complete below 18.15 at the wave (b) high,
and then wave ‘iii’ of (c) should drop back into the 17.40 area again.
Five waves down in wave (c) should complete at about 1715.
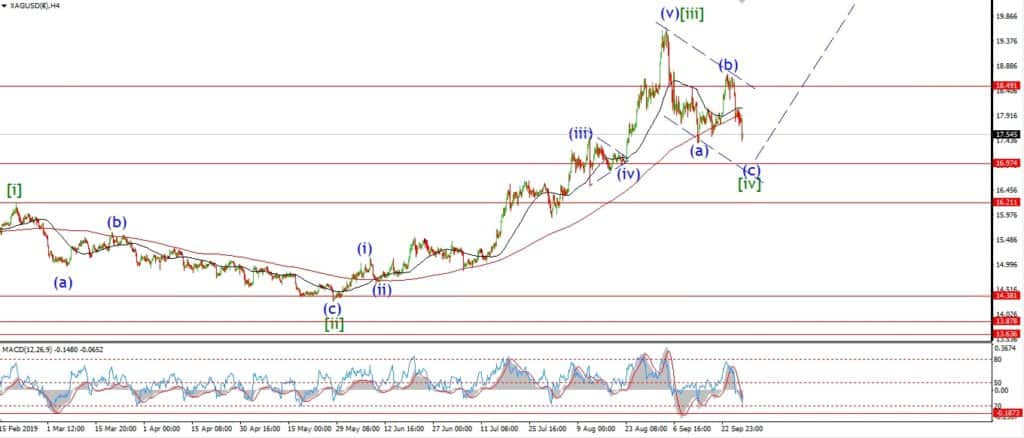
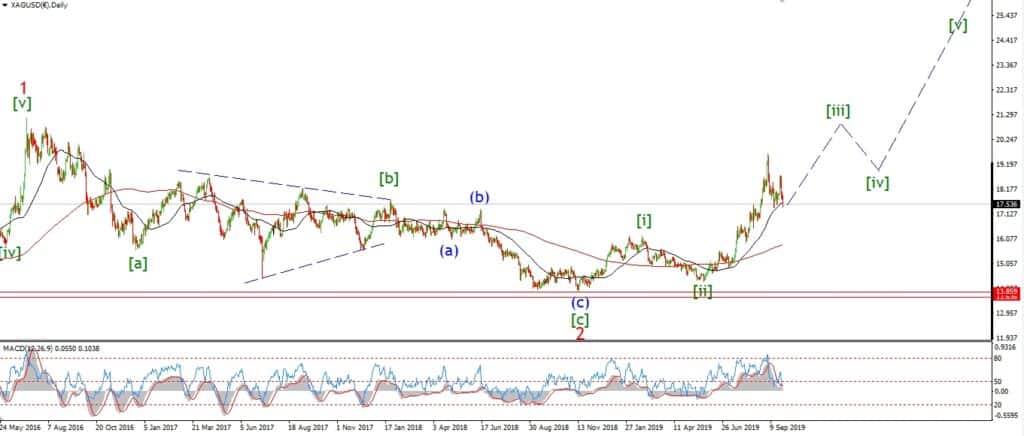
And then I will be looking for a rally to begin in wave [iii].
Tomorrow;
Watch for wave ‘iii’ of (c) to turn lower again and break 17.68.
U.S 10YR.
US 10YR 1hr.
US 10YR 4hr.
US 10YR daily.
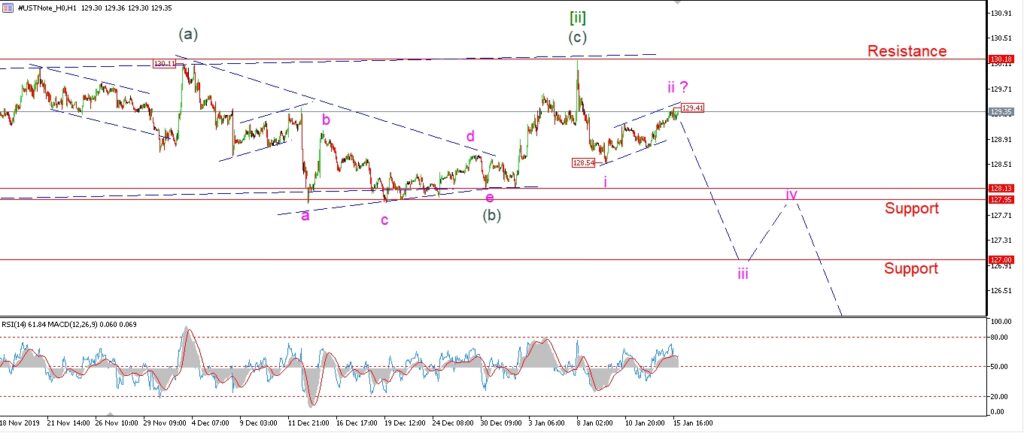
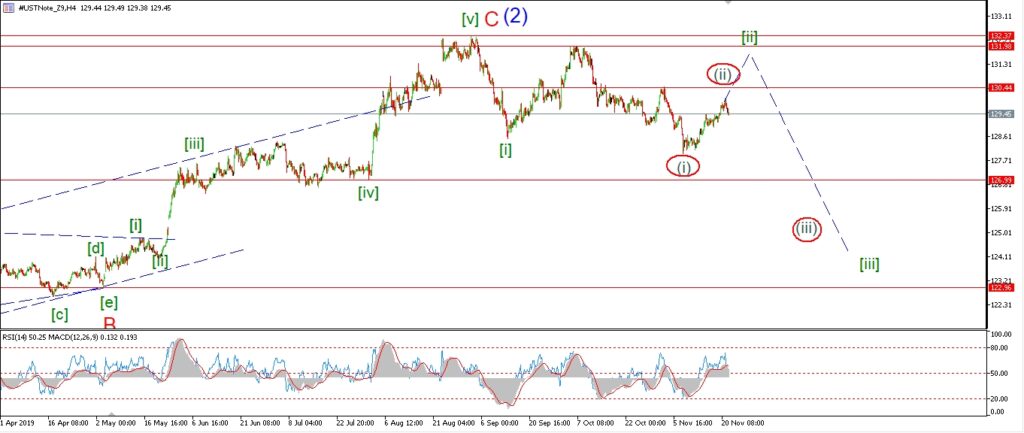
Three waves up in wave ‘ii’ has hit 129.41 at todays highs.
this should be enough to complete the correction in wave ‘ii’.
If we see a return lower again
and a break of 128.54,
that should signal wave ‘iii’ down has begun.
Tomorrow;
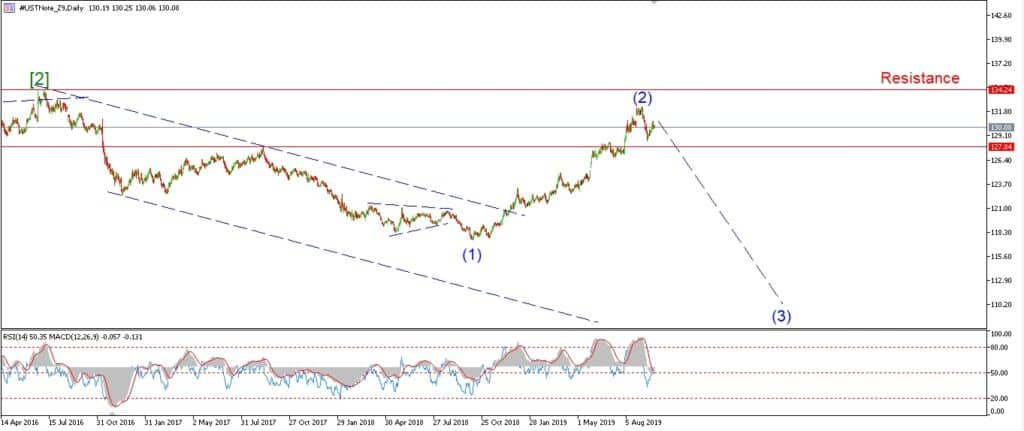
130.18 should continue to hold for the long term now.
And wave ‘iii’ down is likely to begin before the end of the week.
Watch for a break of 128.54 at the wave ‘i’ low.