
Hi there everyone.
I came across this chart from a financial historian who lived over 140 years ago.
His name was Samuel Benner. and he produced this chart back in 1872.
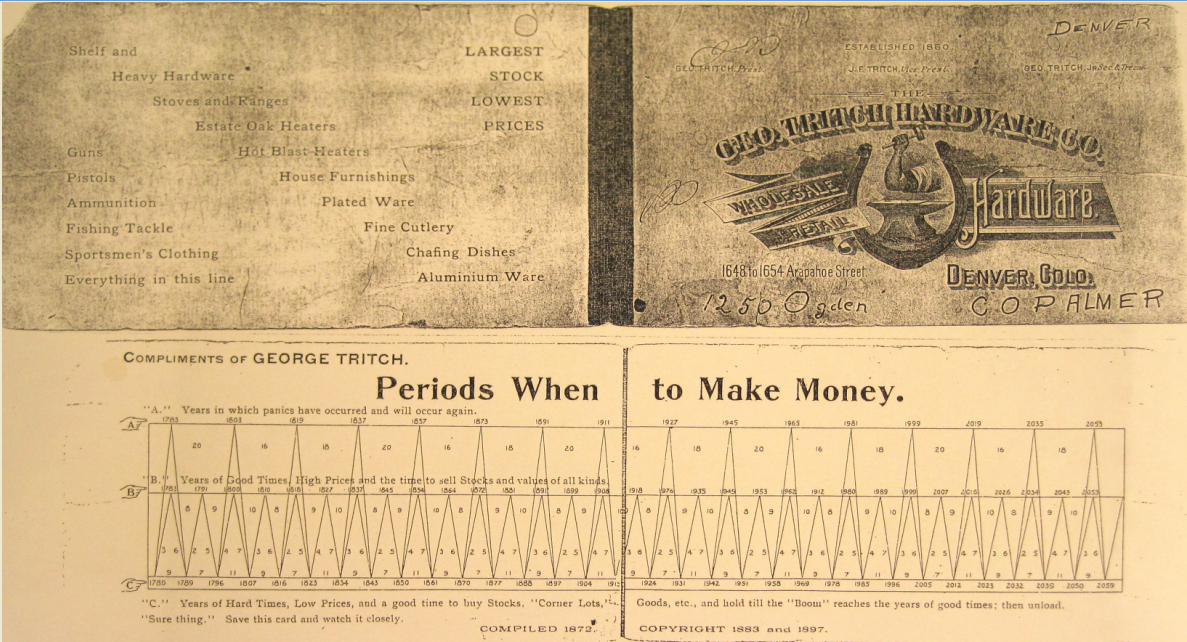
Have a good look at the last 20 years of projections, and just remember that this chart was produced 147 years ago.
Now down to business.
EURUSD.
EURUSD 1hr.
EURUSD 4hr.
EURUSD daily.
Well my Mama told me,
there’ll be days like this!
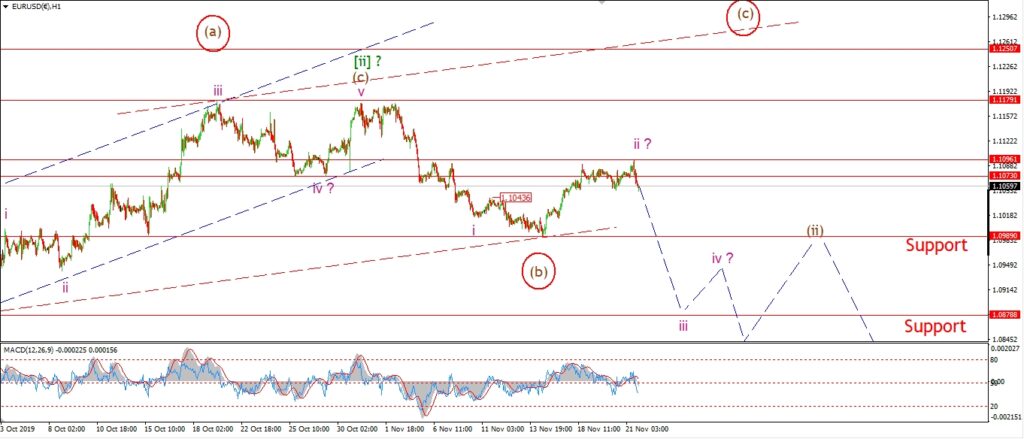
EURUSD has again achieved a whole lot of nothing today.
This is frustrating in a sense,
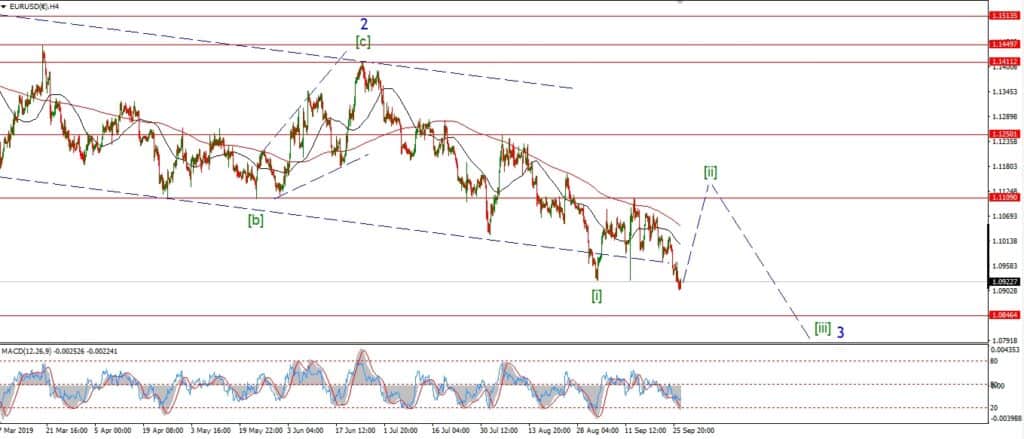
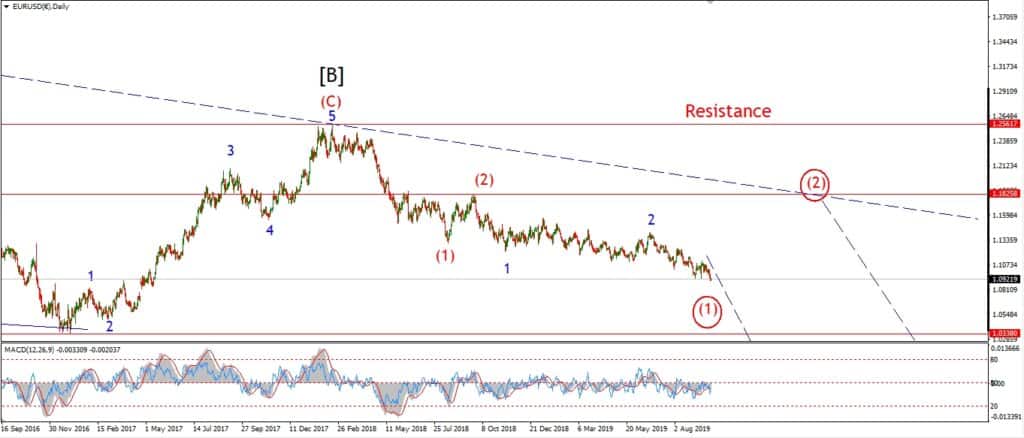
because I still have no solid confirming price action in either wave count.
I will be forced to wait another day to see if the market moves back into wave ‘iii’,
or if we get a move that favors the alternate count.
Tomorrow;
Watch for this evenings decline to accelerate into a third wave down.
A break of 109.89 will confirm the current count.
GBPUSD
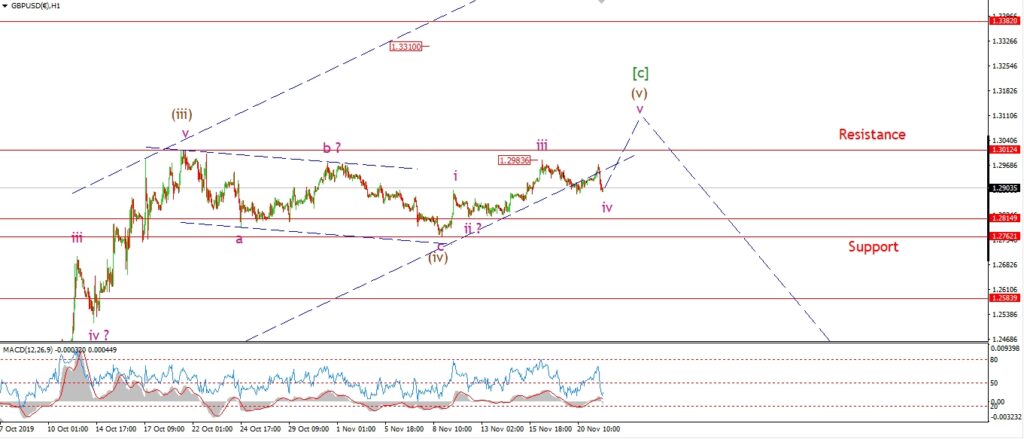
GBPUSD 1hr.
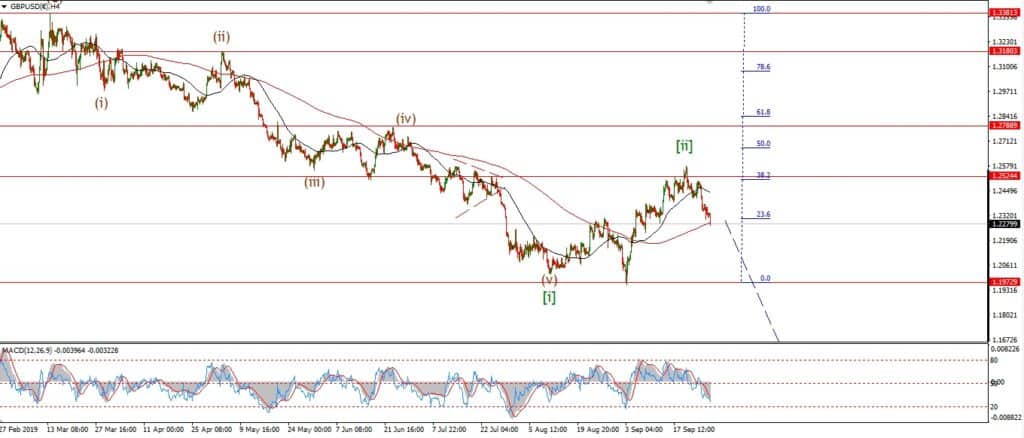
GBPUSD 4hr.
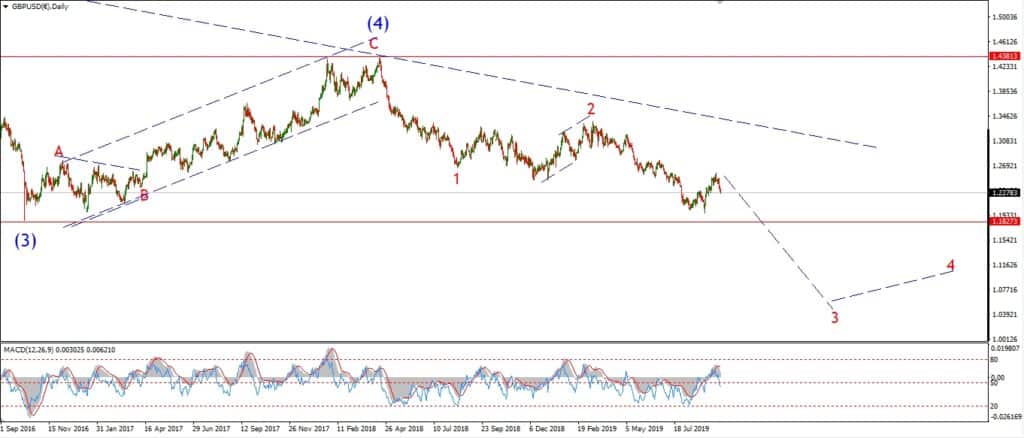
GBPUSD daily.
It’s a similar but even more frustrating story in cable!
We have now spent the last month just grinding sideways.
and the price has been stuck within a 250 pip range.
This does explain the difficulty in tracking the action I think!
It is still possible that todays drop is part of wave ‘iv’ of (v) as shown.
Although I think we will need to see a push back above 1.3012 again tomorrow to save this count now.
Tomorrow;
Any further drop below 1.2815 at wave ‘ii’ pink,
will rule out this current count.
Watch for wave ‘v’ to at least break 1.2983.
USDJPY.
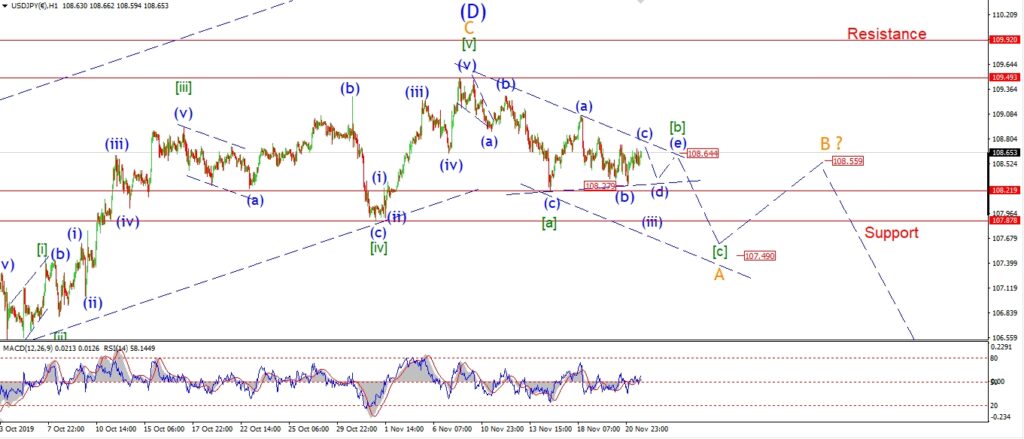
USDJPY 1hr.
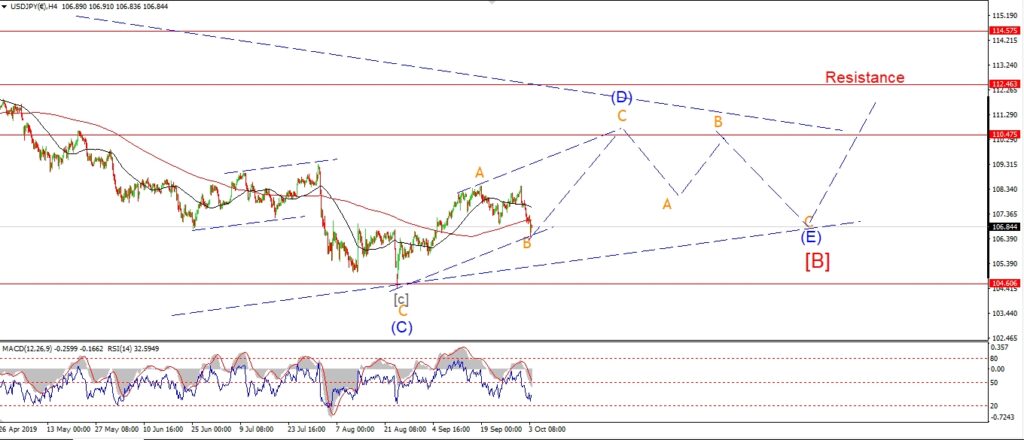
USDJPY 1hr.
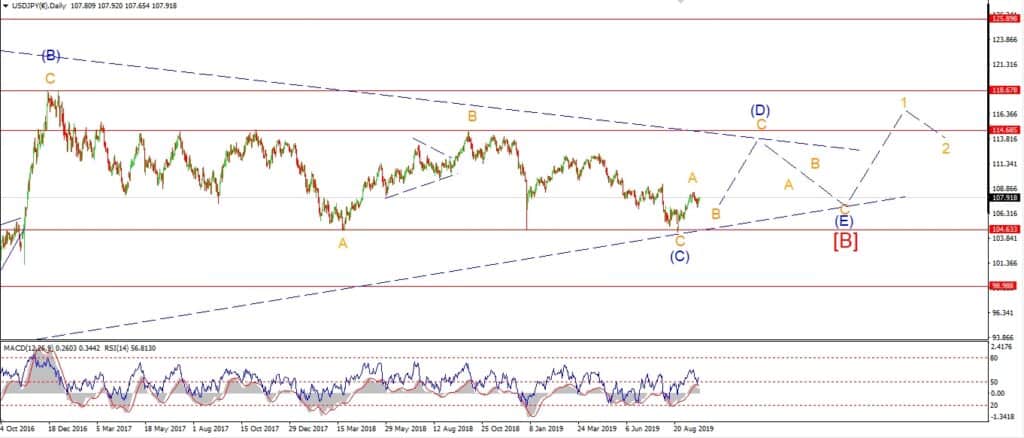
USDJPY daily.
I have switched to a slightly different interpretation for wave ‘A’ this evening.
This still involves a three wave decline off the high.
But wave [b] is now viewed as a triangle rather than a running flat.
This new short term count will invlove another day of sideways action at least
before dropping into wave [c] again.
The target for wave [c] remains at 107.50.
Tomorrow;
Watch for wave [b] to continue sideways.
The price must hold above the wave (b) low at 108.27 as the triangle progresses.
DOW JONES.
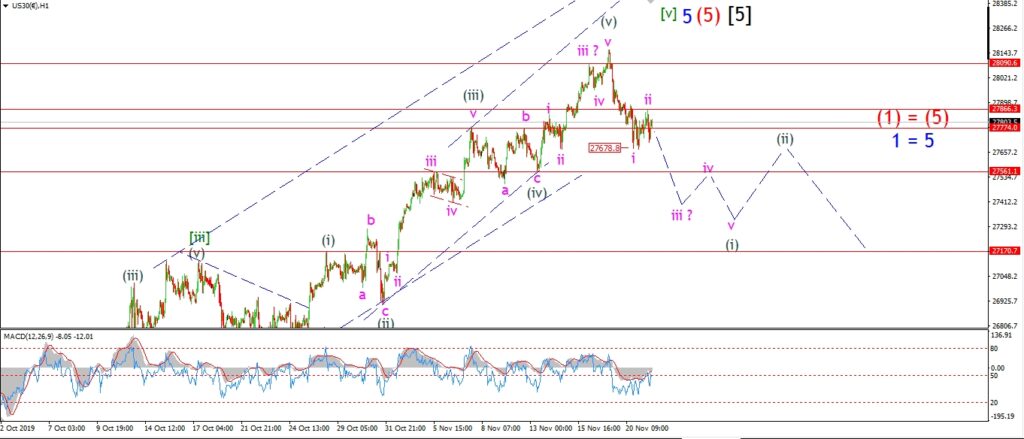
DOW 1hr.
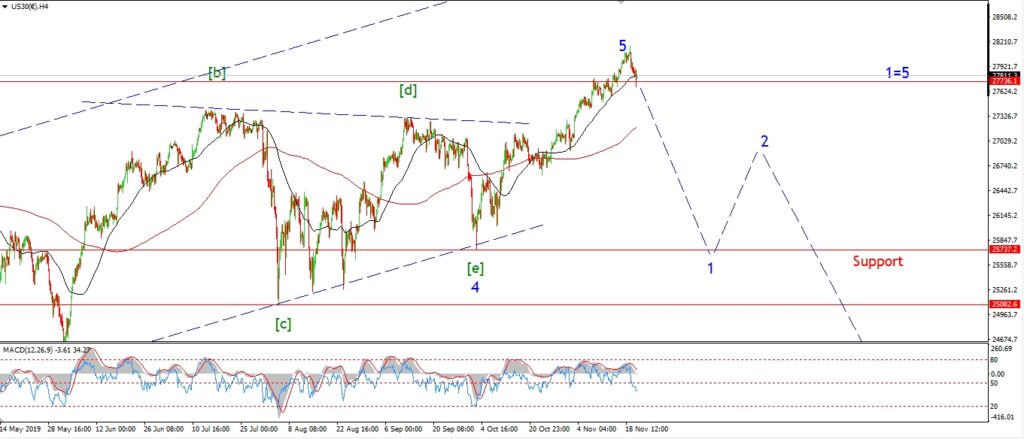
DOW 4hr
DOW daily.
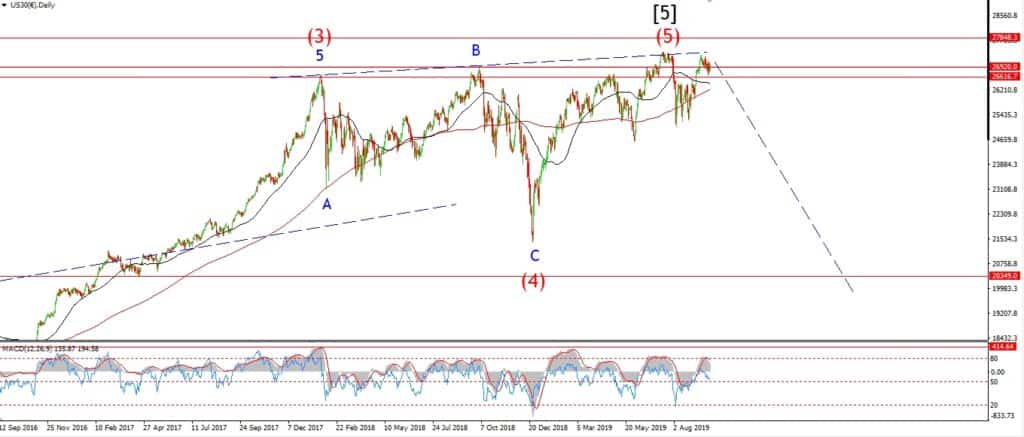
The Dow is stuck today within some corrective action.
I have labelled this sideways move as wave ‘ii’ pink.
And the Wednesdays low now becomes the wave ‘i’ pink.
If this is correct,
then the market has created a bearish impulse wave off the high at wave ‘ii’.
And now we should be ready to fall again into wave ‘iii’ of (i) starting tomorrow.
If the price falls below 27670 again,
that should signal wave ‘iii’ of (i) has begun.
Tomorrow;
Watch for wave ‘ii’ to hold at todays high of 27865.
The price is off that level this evening,
so it is possible that wave ‘iii’ has already begun.
GOLD
GOLD 1hr.
GOLD 4hr.
GOLD daily.
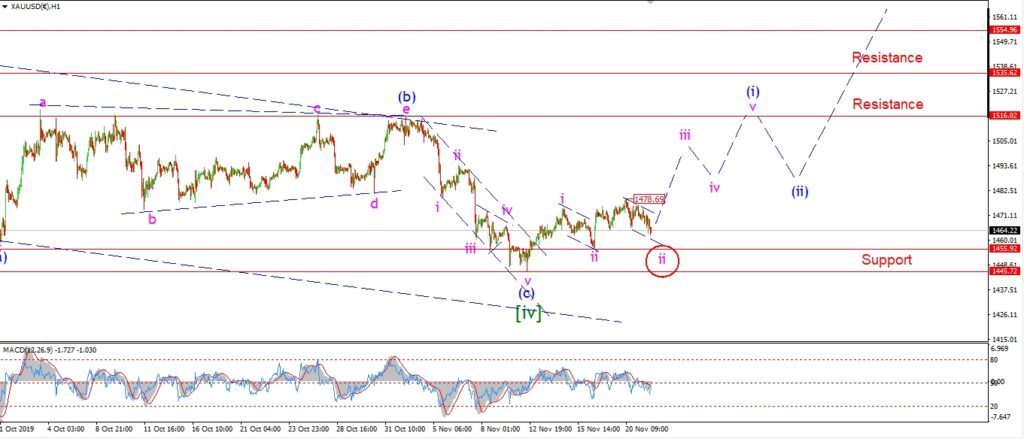
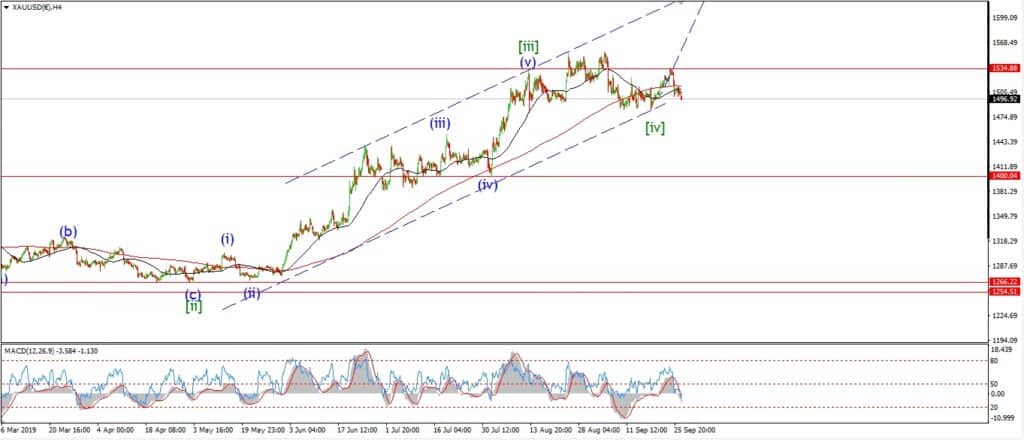
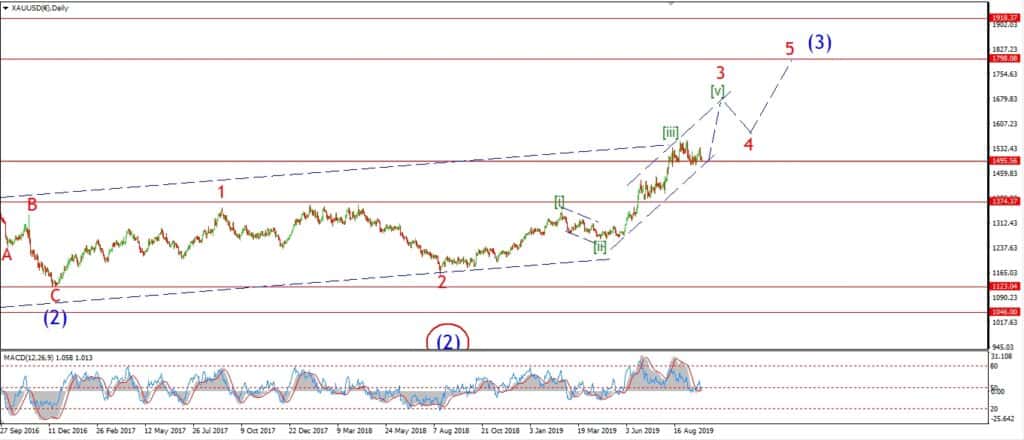
Gold is tracing out a small corrective pattern to the downside again today.
The drop off Wednesdays high is in three waves,
and so far we are holding above the wave ‘ii’ low of 1455.
This action may be the initial impulse move to begin wave ‘iii’ up,
and this will be especially true if wave ‘iii’ extends higher into a clear five wave pattern itself.
I will have to wait and see on that front.
But so long as price holds above 1455,
then this bullish pattern is still the most likely interpretation.
If we see a drop into 1455,
followed by a rally above 1479 again.
That will trigger the alternate count shown.
Tomorrow;
Watch for wave ‘ii’ to hold at 1455.
wave ‘iii’ will be confirmed with a break of 1479 again.
CRUDE OIL.
CRUDE OIL 1hr.
CRUDE OIL 4hr.
CRUDE OIL daily.
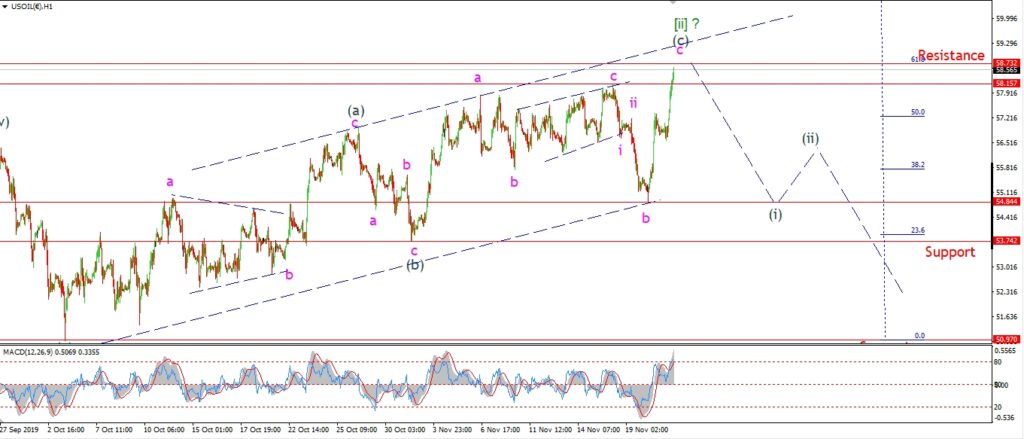
The rally in crude has triggered the alternate count this evening.
Wave [ii] is now a double combination complex correction.
This simply means waves (a) and (c) trace out extended three wave patterns,
and they are joined by a simple three wave pattern in wave (b).
The overall outcome of this correction higher is the same.
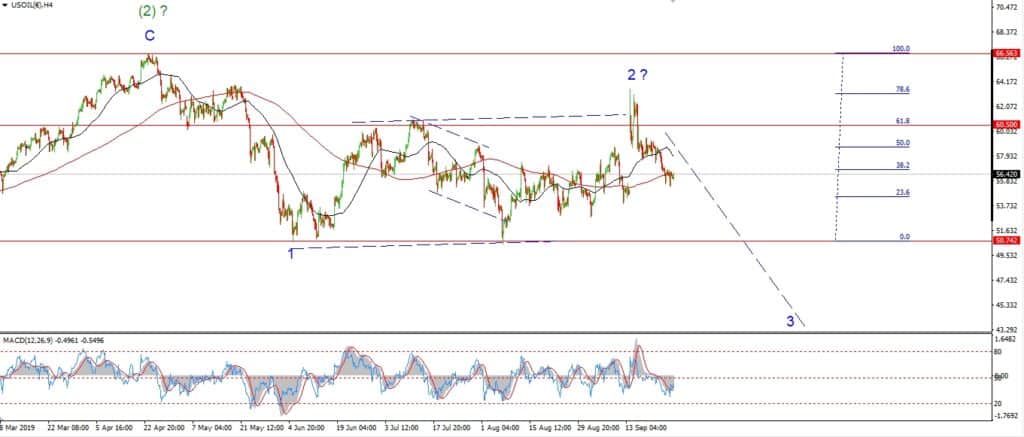
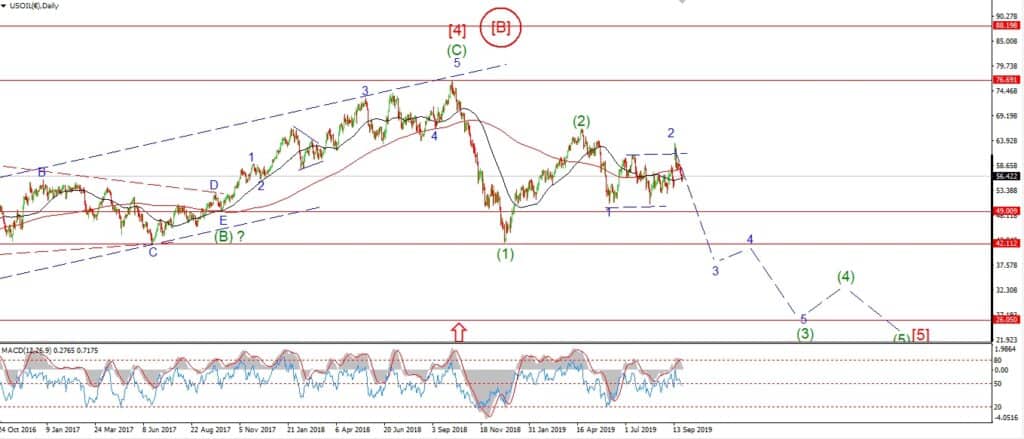
Wave [iii] down will wipe out all of these gains before the end of the year.
And crude will fall into the next leg down in the ongoing bearmarket.
This new count does allow for some more upside but not much.
Wave (c) should top out at about 59.30.
And then wave (i) should carry us lower again.
Tomorrow;
Wave ‘c’ of (c) should top out close to resistance.
We may even get the initial move down into wave (i) tomorrow.
S&P 500.
S&P 500 1hr
S&P 500 4hr
S&P 500 daily.
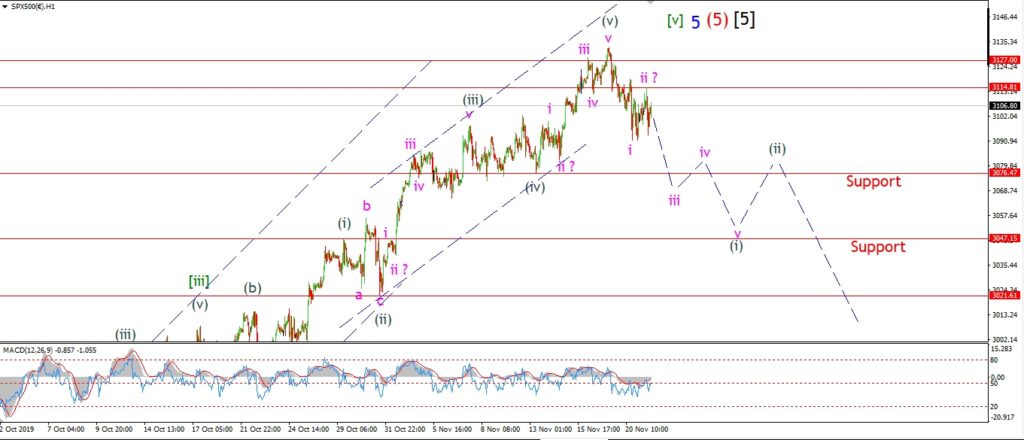
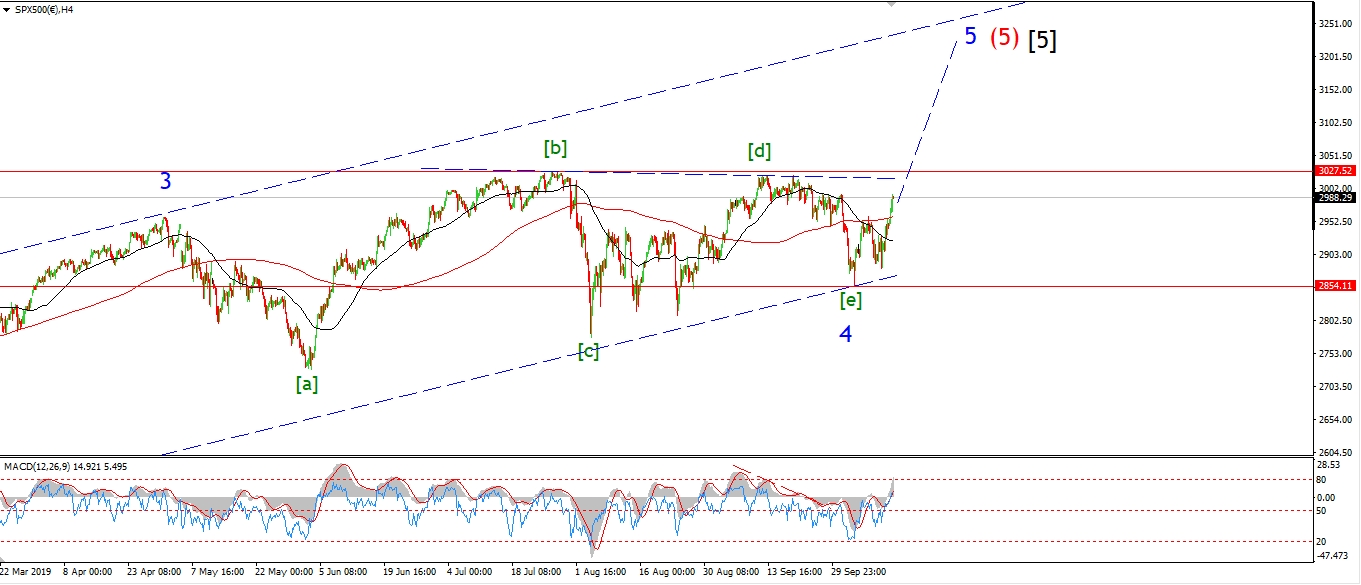
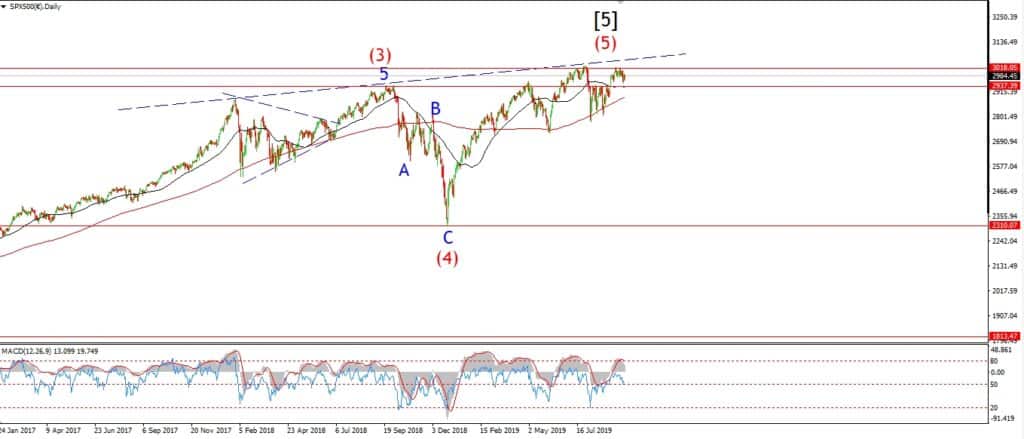
The S&P is down off the high in a possible impulse wave.
Although wave ‘i’ best counts as a leading diagonal which is never ideal!
I will be mush happier with this count,
if we get a clear follow through over the next few sessions in wave ‘iii’ down.
A break of 3076 in wave ‘iii’ is now the minimum expected target.
And it will be the testing point for this bearish count.
If we cut down through that level and push towards 3047,
then I think we will be a solid ground with the bearish outlook.
Tomorrow;
Watch for wave ‘ii’ to hold at todays highs,
and wave ‘iii’ down to continue through support.
SILVER.
SILVER 1hr
SILVER 4hr.
SILVER daily.
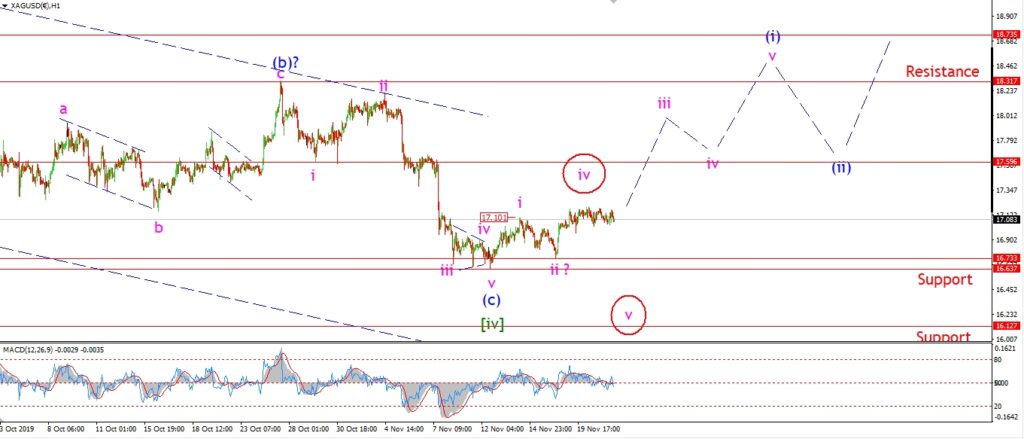
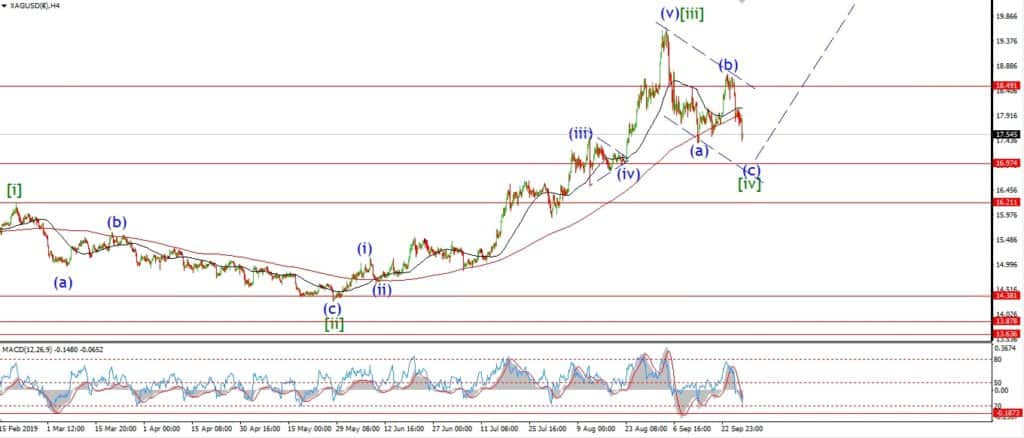
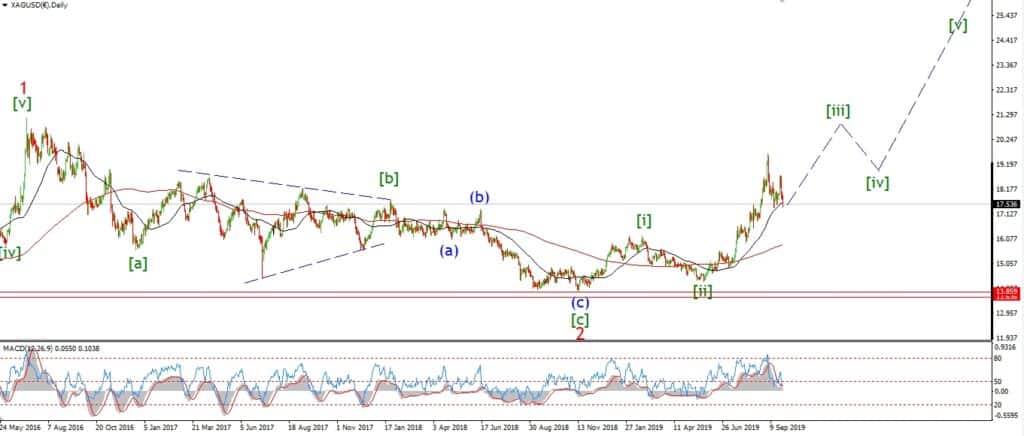
Silver is really teasing us these days.
As with gold,
the short term action is hinting at a breakout move ahead,
but the price has failed to follow up on that just yet.
A push above 17.59 is what we need to turn the tide in favor of the bullish count,
and rule out the alternate count.
So that is what I want to see tomorrow.
Tomorrow;
watch for 16.73 to hold again.
Wave ‘iii’ up has stalled long enough now,
so lets see if we get confirmation tomorrow with a break of 17.59.
U.S 10YR.
US 10YR 1hr.
US 10YR 4hr.
US 10YR daily.
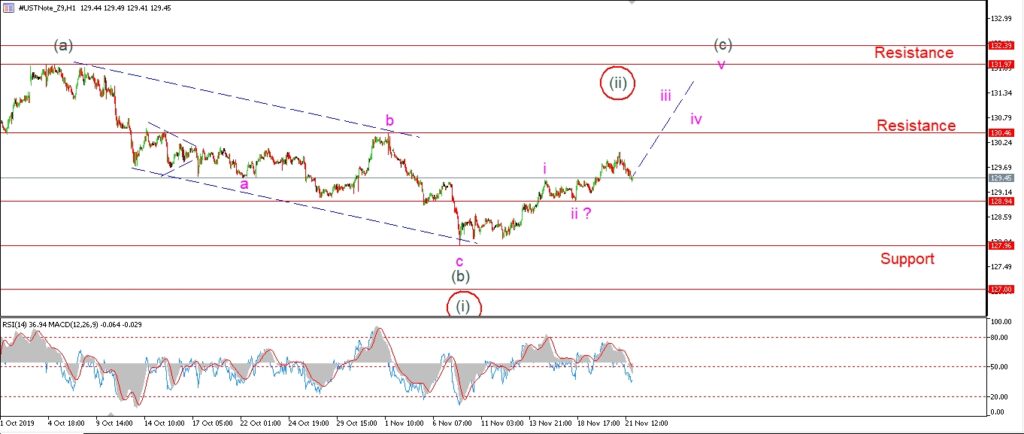
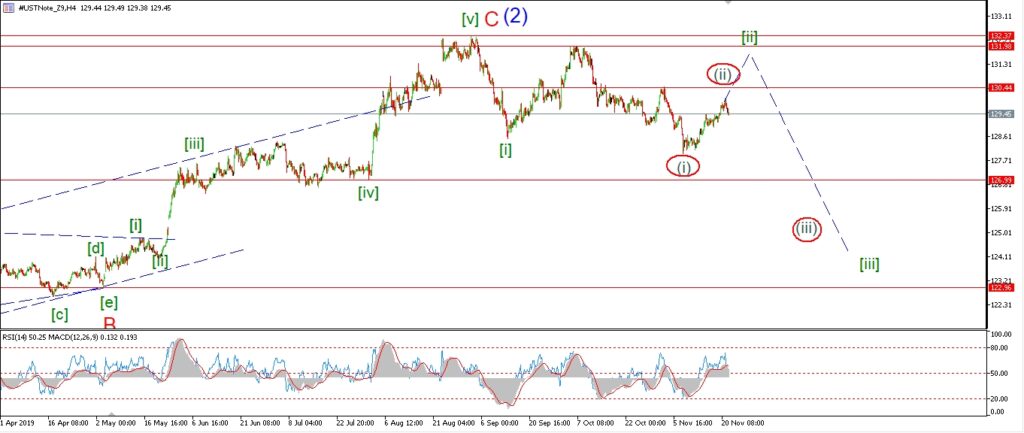
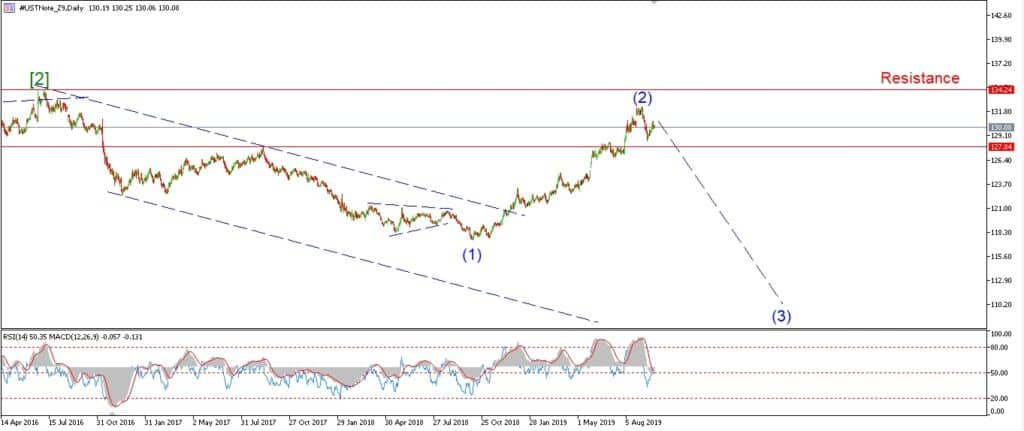
Todays action has opened up the alternate count scenario a little more.
I have shown this possible alternate count on the 4hr and 1hr charts this evening.
This is a similar bearish count to the one I was working with last week.
Except it involves a series of 1,2, bearish impulse waves
now in place off the high at wave (2).
If this is correct,
then we will not see a break of 130.46 at all.
And the price will fall back below 127.96 again to begin wave (iii) down.
I will switch to this wave count if we get a break of 128.94 at the wave ‘ii’ low.
I have not ruled out the current short term count,
but I just think it is worth looking seriously at this bearish setup also.
Tomorrow;
If wave ‘iii’ comes in tomorrow and breaks resistance at 130.46,
that will rule out the alternate count.
128.94 must hold now.