
Good evening to one and all.
EURUSD.
EURUSD 1hr.
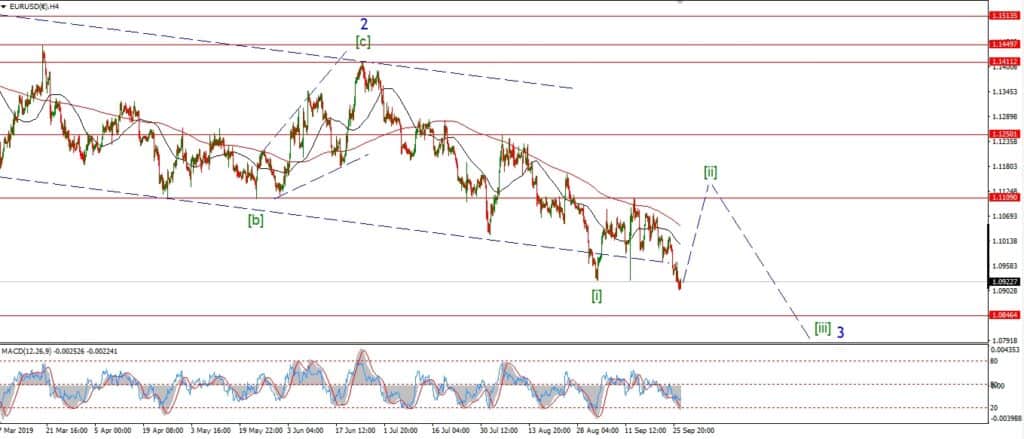
EURUSD 4hr.
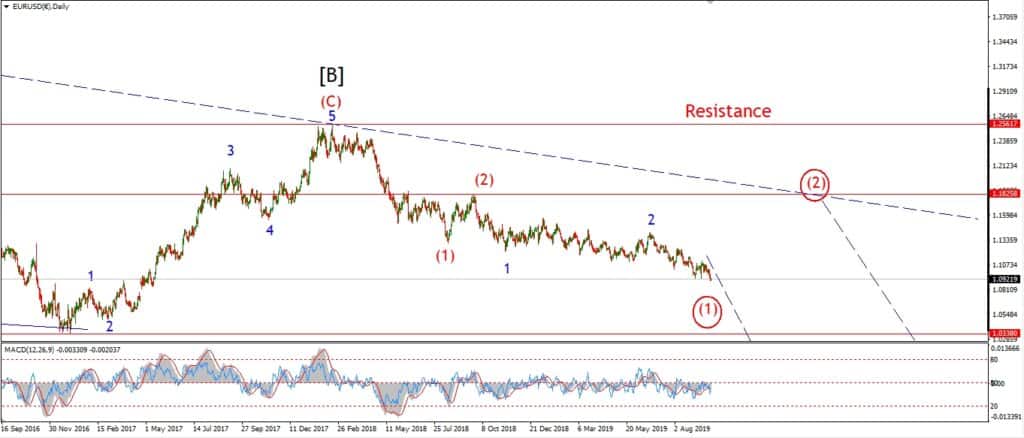
EURUSD daily.
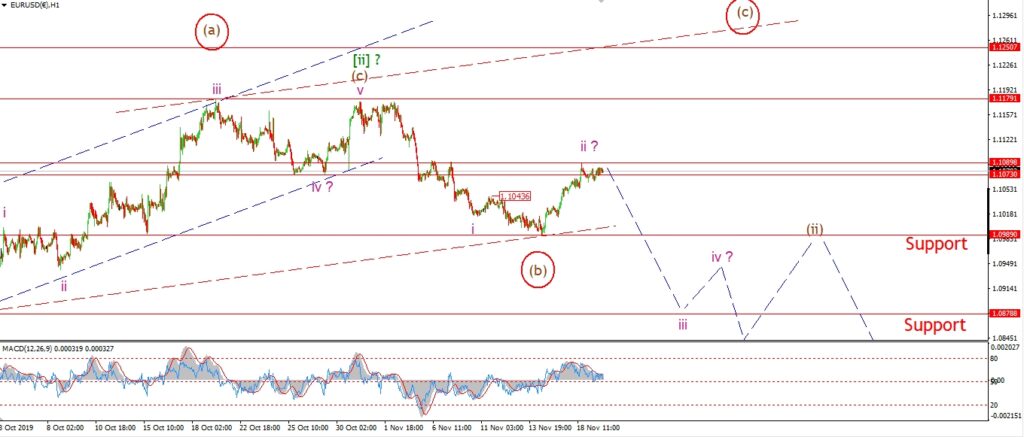
EURUSD is dead in the water today,
and although nothing really happened today,
the short term action is beginning to favor the alternate count.
I will give the current count another day or two to prove itself,
so the decline in wave ‘iii’ better start tomorrow!
With that in mind,
I have shown a little more detail for the alternate count this evening.
The red trend channel shows a possible path for the three wave correction.
In this scenario,
wave (c) would rally in five wave off the recent low.
And the target for that rally lies at about 1.1300.
Tomorrow;
Wave ‘iii’ down must take over tomorrow and bring the price back below 1.1000 again.
Watch for an early spike lower to begin wave ‘iii’.
GBPUSD
GBPUSD 1hr.
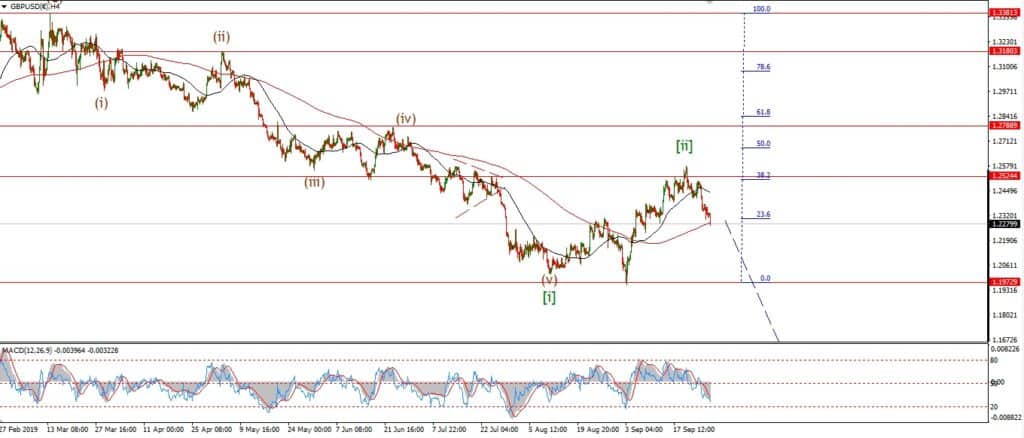
GBPUSD 4hr.
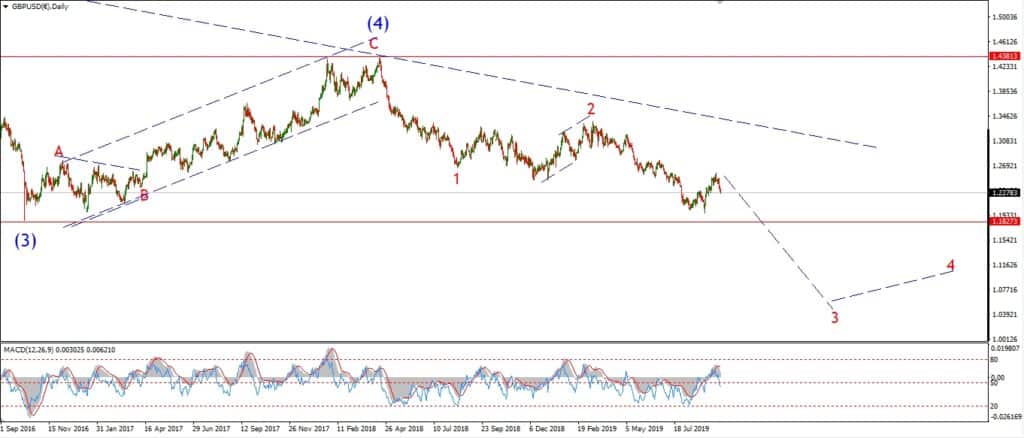
GBPUSD daily.
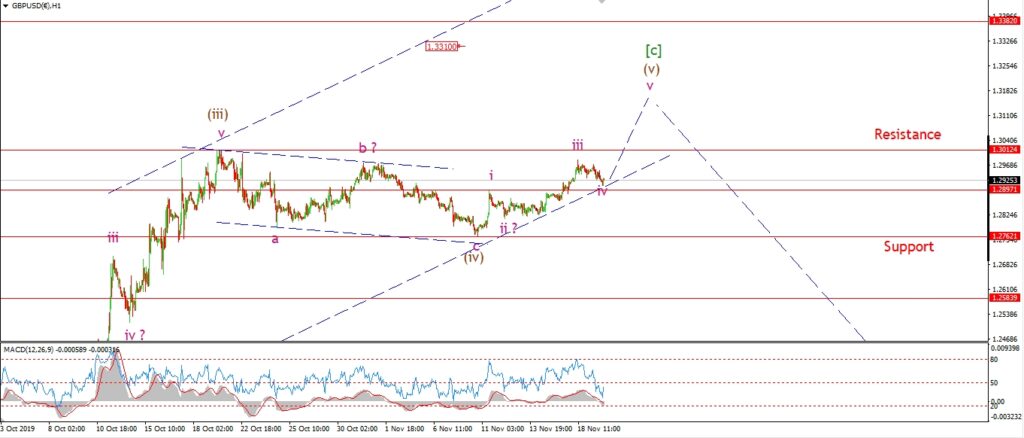
Cable has corrected slightly lower today which is an unexpected twist to the short term count.
I have relabeled the chart this evening to show this decline as wave ‘iv’ of (v).
And this count suggests another push higher in wave ‘v’ will come to complete the larger pattern.
The decline today must hold above 1.2897 at the wave ‘i’ high in order to remain valid as a clean impulse wave.
So we must see a turn higher soon,
and a break above 1.3012 at the wave (iii) high.
Tomorrow;
Watch for wave ‘v’ to push higher again and break initial resistance.
We may not reach the 1.3380 level in wave (v),
but the minimum target at 1.3012 is all that is really needed
to signal that this rally is done.
USDJPY.
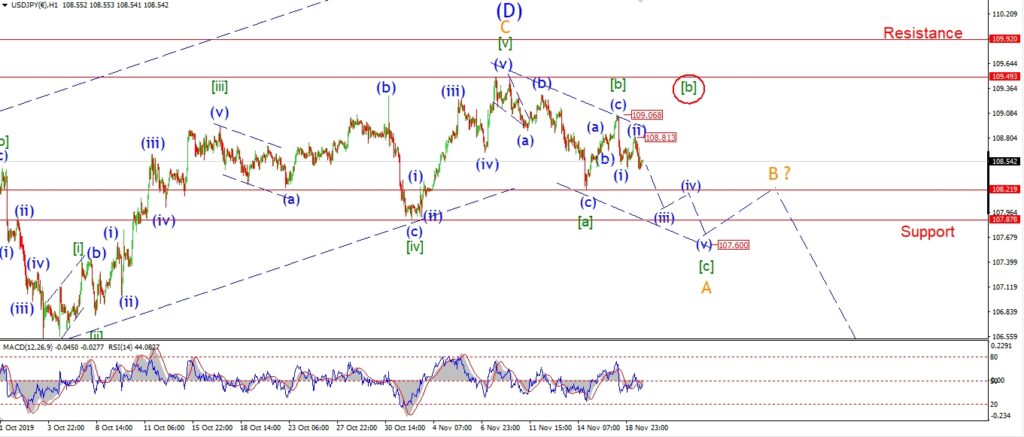
USDJPY 1hr.
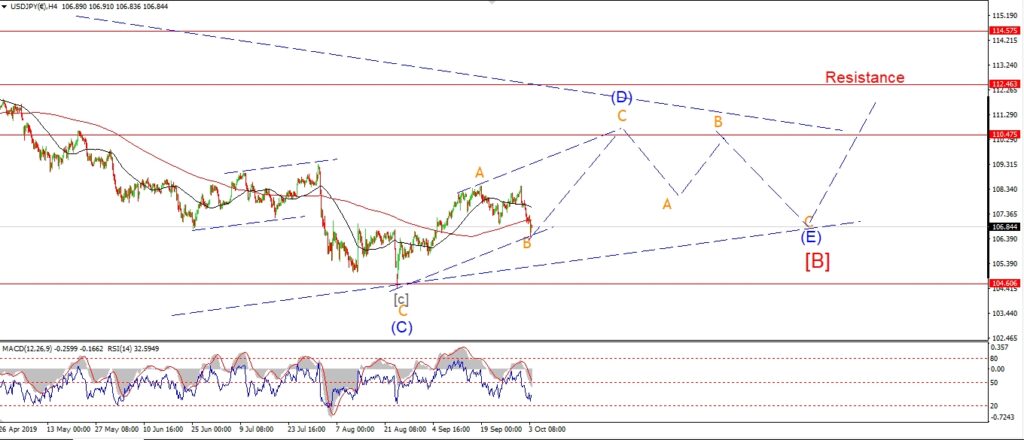
USDJPY 1hr.
USDJPY daily.
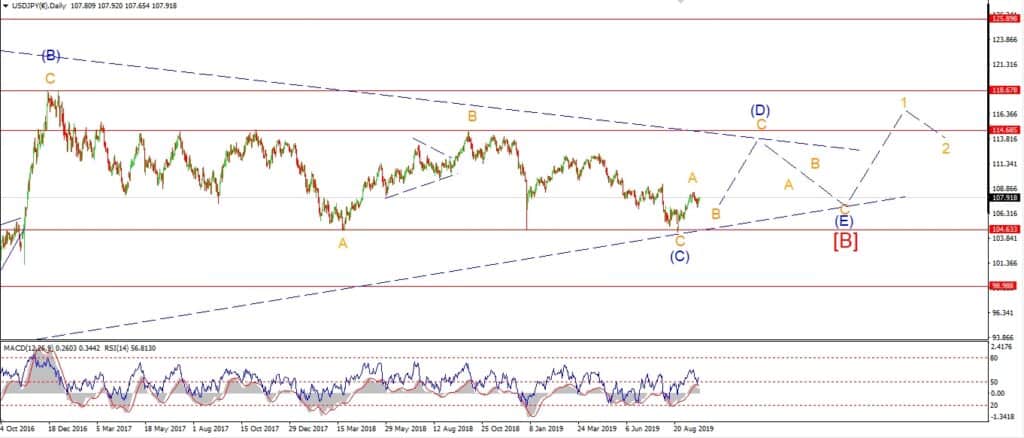
USDJPY is lower today again to begin a possible third wave down in wave [c] green.
This decline in wave (iii) blue must continue tomorrow and break 108.21 at a minimum.
that will achieve the minimum expected target for wave [c],
but I do expect wave [c] to continue into about 107.87 to complete.
I have shown a possible alternate count for wave [b] circled in red.
A break of 108.82 again will trigger this count.
Tomorrow;
Watch for wave (iii) to drop below 108.21 at a minimum.
DOW JONES.
DOW 1hr.
DOW 4hr
DOW daily.
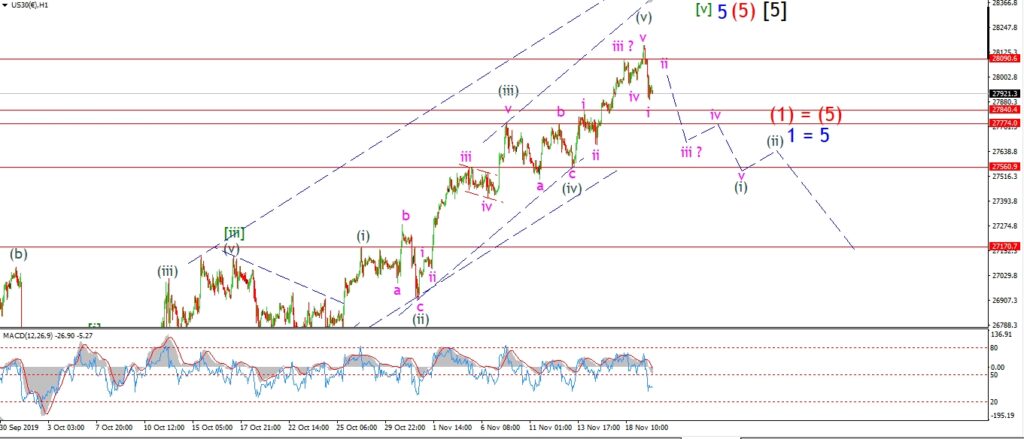
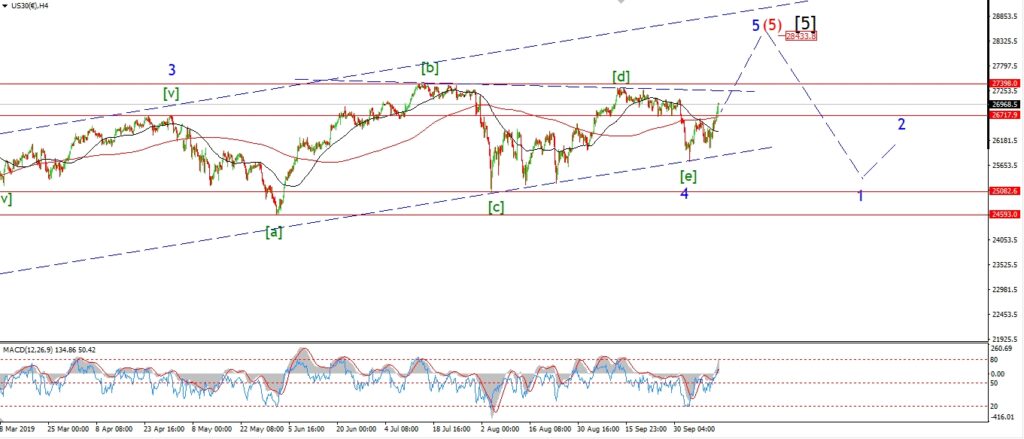
The DOW traded higher in the premarket early this morning and then gapped lower off the high to open the trading session today.
The early high reached 28090 before the spike lower come in.
I refuse to get too excited about this action now,
as I have been so often disappointed by the relentless bullishness!
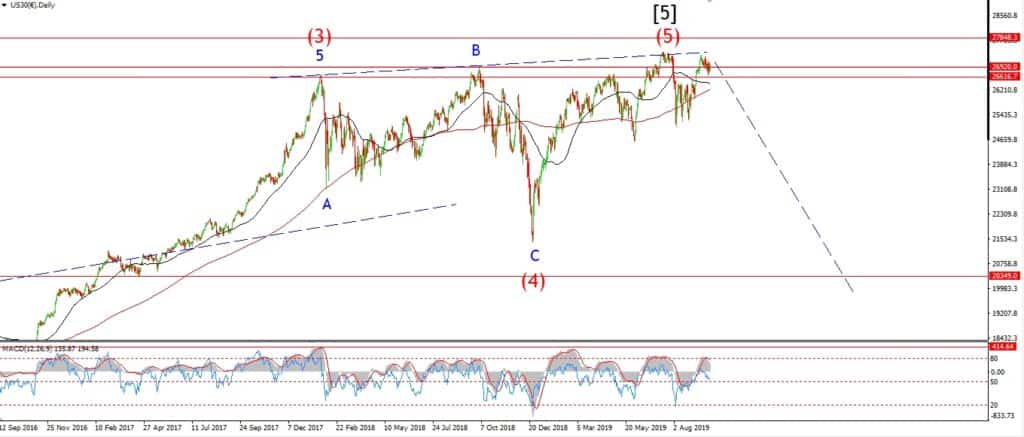
But the bear-market has to start somewhere……….why not here?
It is still possible that this decline is part of wave ‘iv’ of (v).
A break below 27800 will disprove that possible alternate count.
On this evenings chart,
I have shown todays drop as wave ‘i’ of (i).
If the decline continues for the rest of the week and traces out a five wave pattern,
Then the short term pattern will become very interesting indeed.
If wave (i) down breaks 27500 again,
That will be real hint that something bigger is occurring here.
For now,
I proceed with caution.
Tomorrow;
Watch for 28090 to hold and wave ‘ii’ of (i) to create a lower high below that level.
Wave ‘iii’ down should break 27770 again.
GOLD
GOLD 1hr.
GOLD 4hr.
GOLD daily.
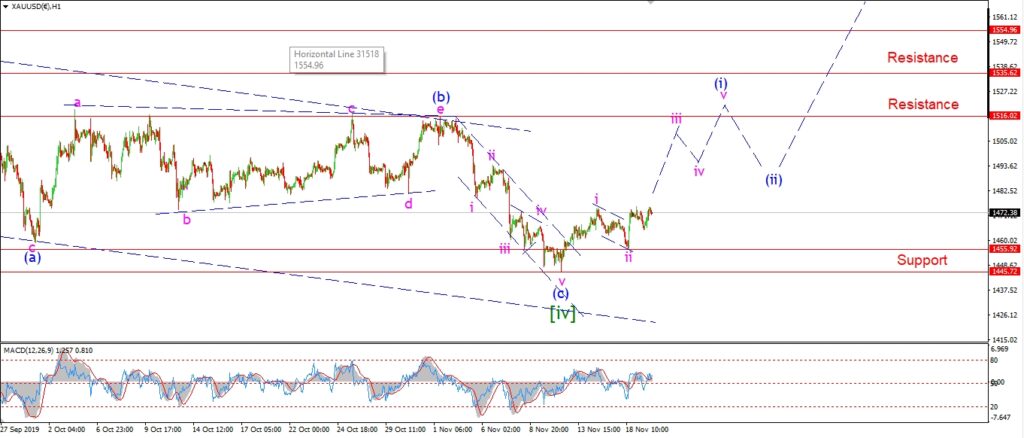
Gold is holding above the recent wave ‘ii’ low at 1455.90 so far.
The price is threatening to break above the wave ‘i’ high all day,
but without any luck just yet.
If this is the beginning of wave ‘iii’ up,
then we should see a push back above 1500 again by the end of the week.
If that happens,
it should be enough to confirm the market has turned into wave (i) up.
Tomorrow;
Watch for price to continue to hold above 1456.
Wave ‘iii’ of (i) should turn higher again by tomorrow evening at the latest.
CRUDE OIL.
CRUDE OIL 1hr.
CRUDE OIL 4hr.
CRUDE OIL daily.
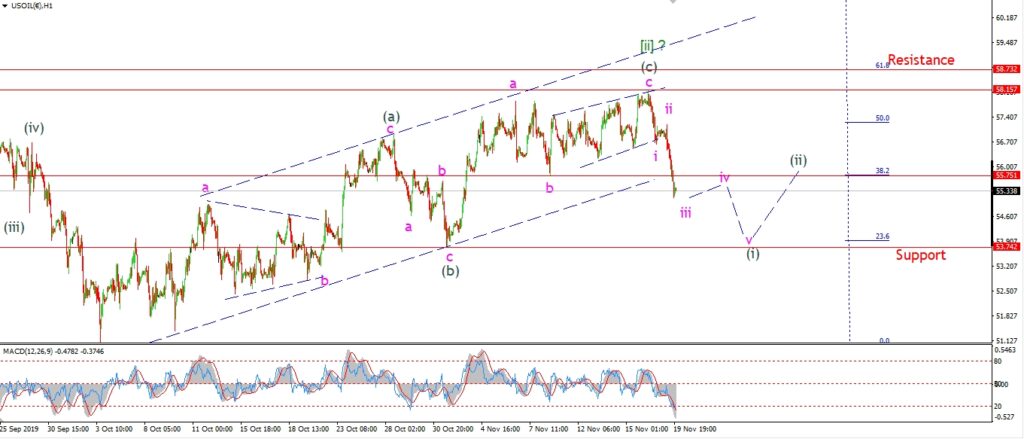
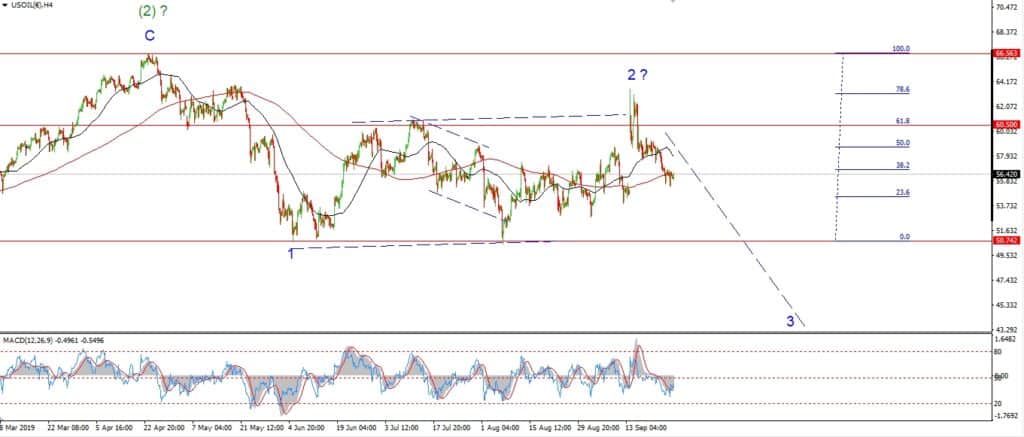
Crude took another large step lower today after a small sideways correction overnight.
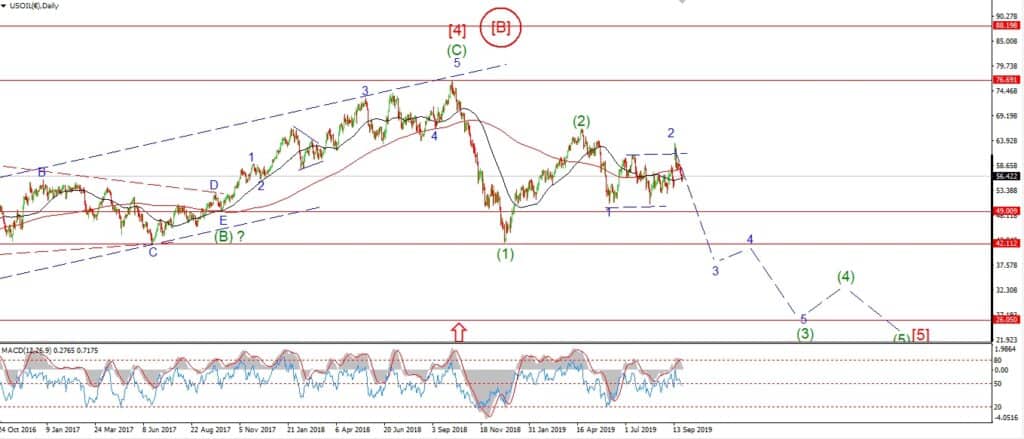
I have labelled this decline as wave ‘iii’ of (i).
and if this is correct,
we are in for another exciting ride to the downside for the next few months as wave [iii] down takes over.
Firstly,
we need to see five waves down as shown on the short term chart
before we can be more sure of the longer term implications.
On the plus side,
Crude has broken that initial support level at 55.75 today.
The next support lies at 53.74 at the previous wave (b).
And I would like to see wave (i) take out that level before turning higher into wave (ii).
Tomorrow;
Watch for wave ‘iv’ to hold below 56.50 or so.
Wave ‘v’ should take over by Thursday evening at the latest.
S&P 500.
S&P 500 1hr
S&P 500 4hr
S&P 500 daily.
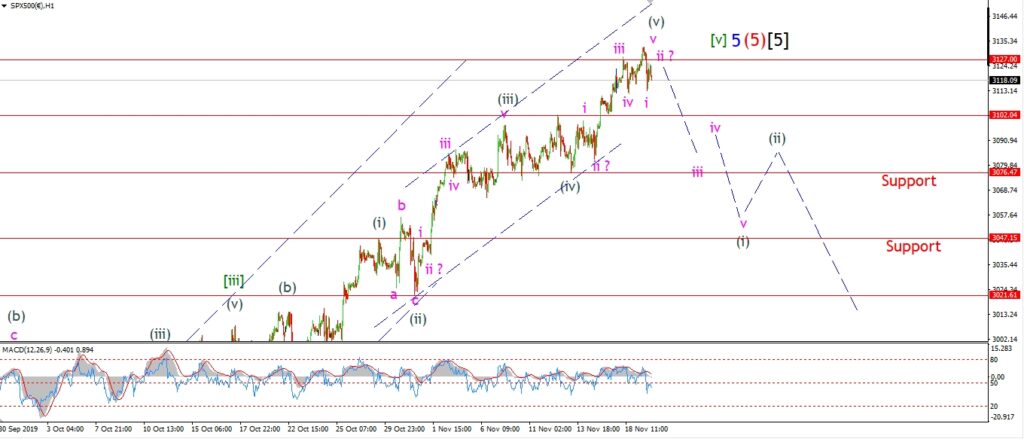
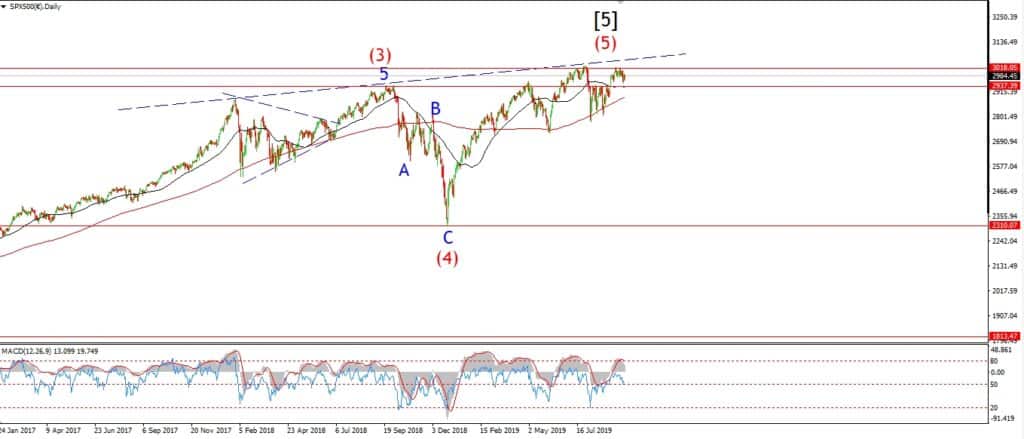
The S&P is off the highs also today,
and I am just speculating on whether this is the turn Im waiting for or not!
As usual I am ready for this market to turn,
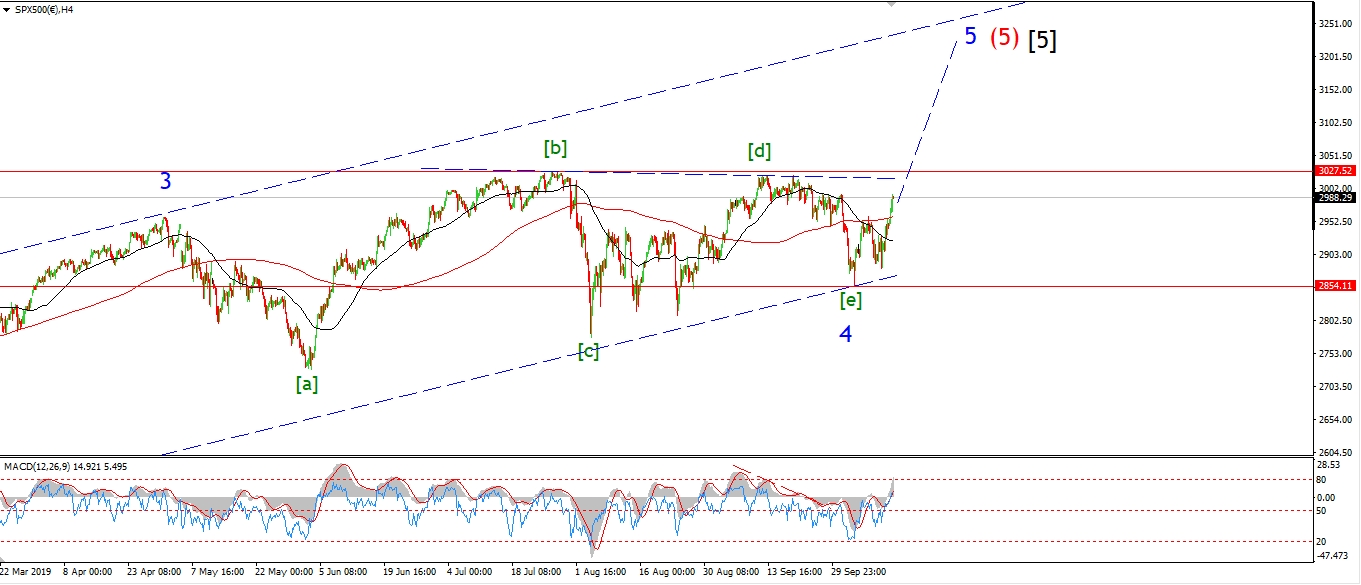
but only a more sustained push back below 3070 again
will be big enough to really open up the bearish possibilities.
The price is hanging slightly below the highs this evening.
If we see a spike lower tomorrow to take out the 3100 level
that will favor the bearish count I have shown this evening.
However,
If we see a return higher again tomorrow,
Then todays lows will become the low of wave ‘iv’ pink and wave ‘v’ will be underway.
Tomorrow;
We are close to the top here,
of that I am pretty sure.
we just need the short term price action to give us the cue.
Watch for 3127 to hold and another spike lower in wave ‘iii’ of (i).
SILVER.
SILVER 1hr
SILVER 4hr.
SILVER daily.
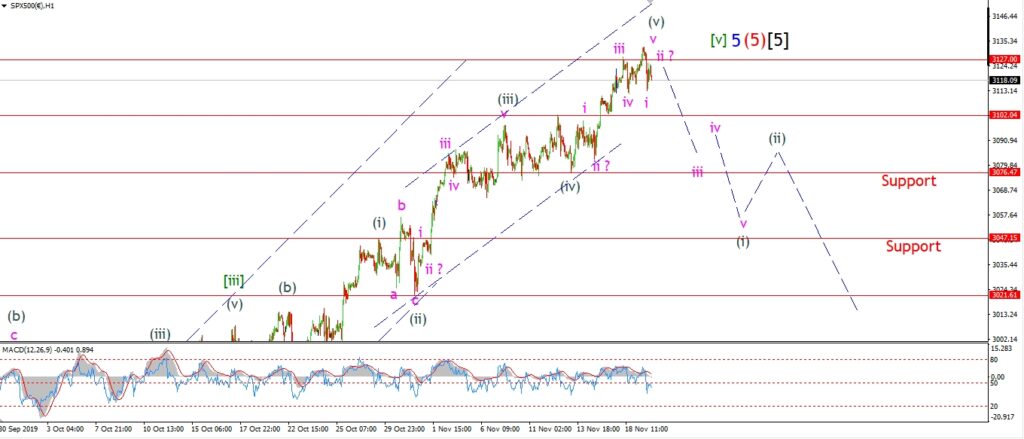
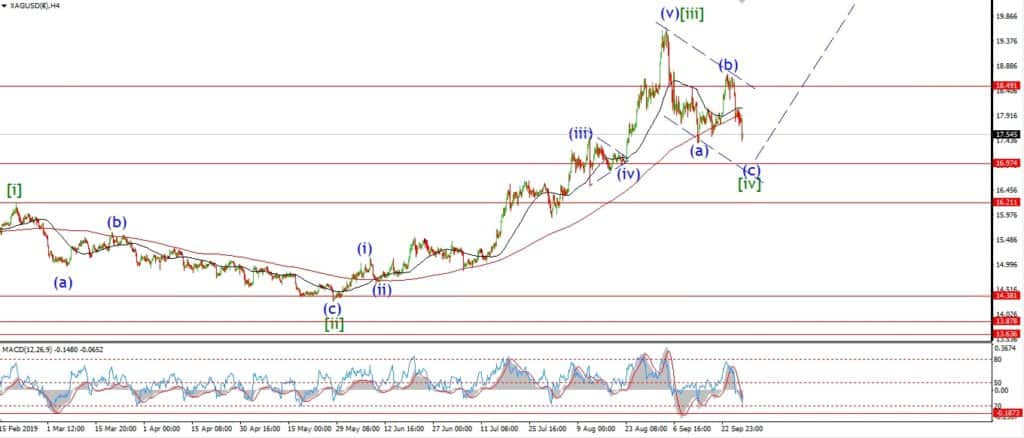
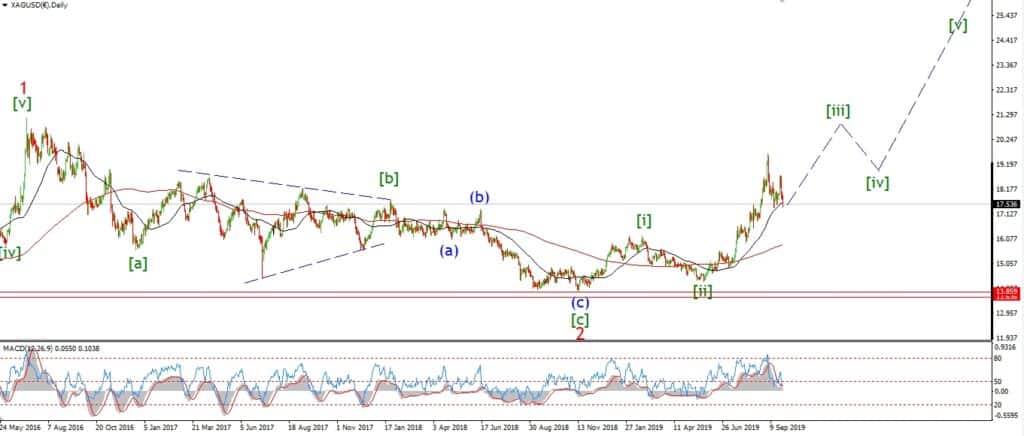
Silver did break above 17.10 today,
but the rise off the low is still only in three waves so far.
This action leaves open the possibility of that alternate count taking over and creating another new low in wave ‘v’.
The low at wave ‘ii’ lies at 16.73,
that level must hold from here and wave ‘iii’ up must continue higher tomorrow.
A break of 17.60 at wave ‘i’ will favor the bullish count.
Tomorrow;
Watch for wave ‘iii’ up to carry us higher again.
16.73 just hold.
U.S 10YR.
US 10YR 1hr.
US 10YR 4hr.
US 10YR daily.
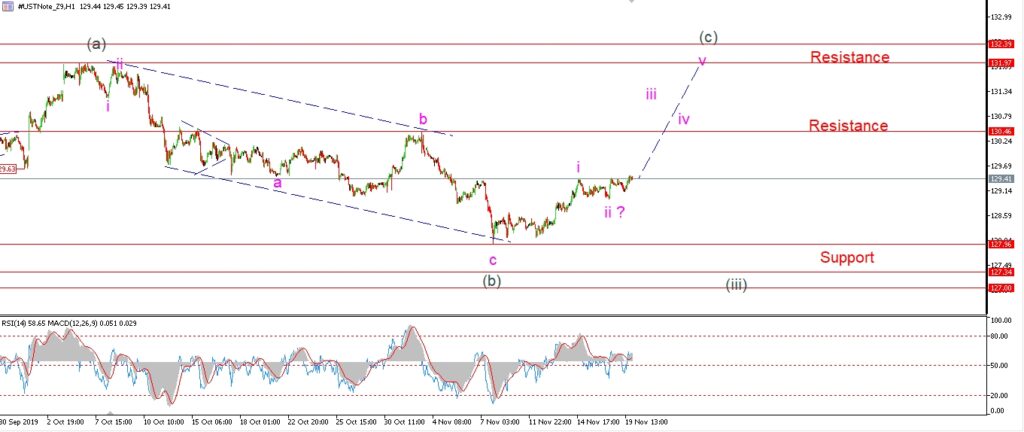
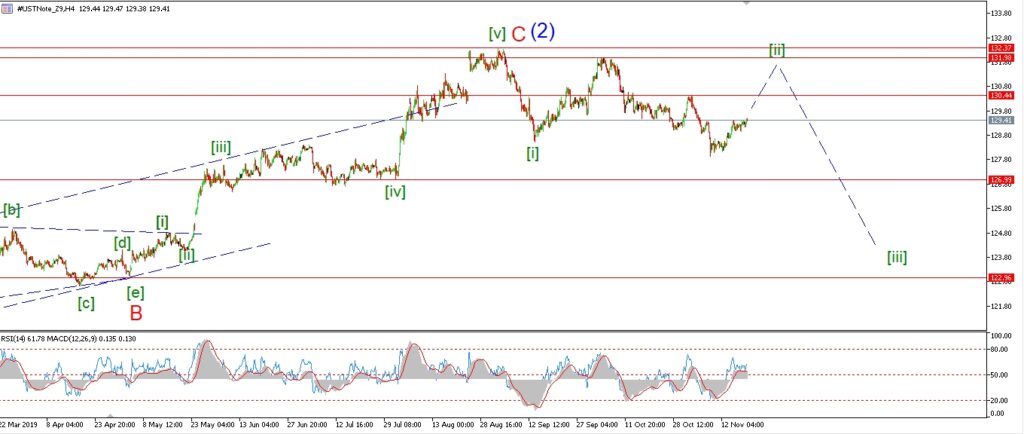
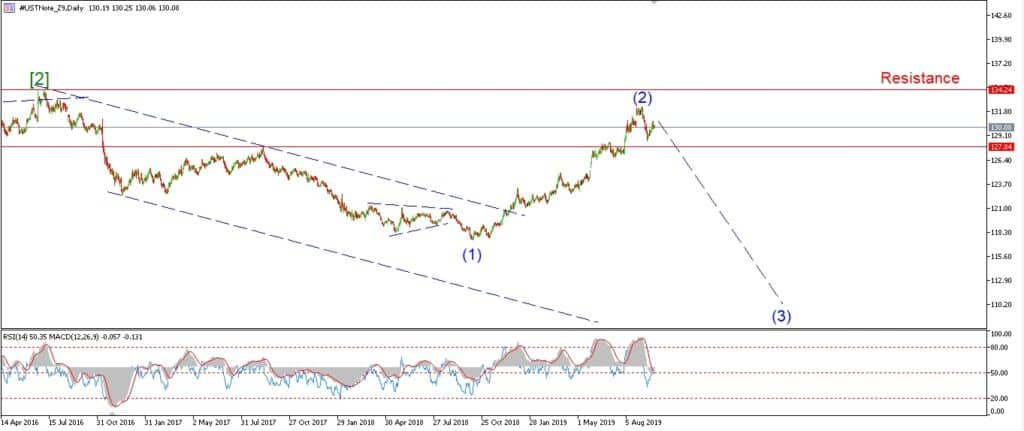
I have switched to the alternate count this evening after another break of 129.40 today.
This new count is tracking a simple flat or running flat correction higher in wave [ii].
And you can view this best on the 4hr chart.
It is essential that 132.97 hold from here,
but I realise that if we reach those levels
it will be hard for the market to resist a new high.
If wave [ii] traces out a running flat correction,
then we will not hit those levels at all.
In that case,
wave (c) of [ii] should find enough resistance at 130.46 to complete the pattern.
Tomorrow;
Watch for wave ‘iii’ of (c) to push up to resistance again.
127.96 should hold.