
Good evening folks,
back to normal after a long weekend!
So down to business.
EURUSD.
EURUSD 1hr.
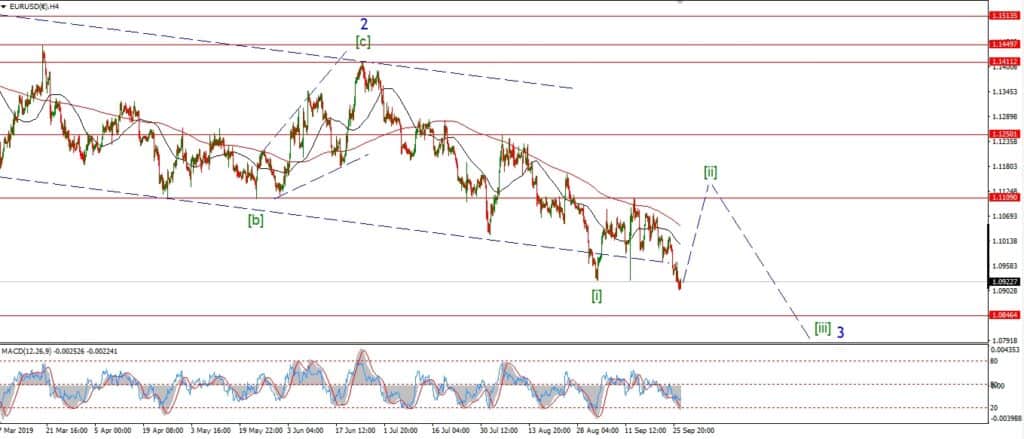
EURUSD 4hr.
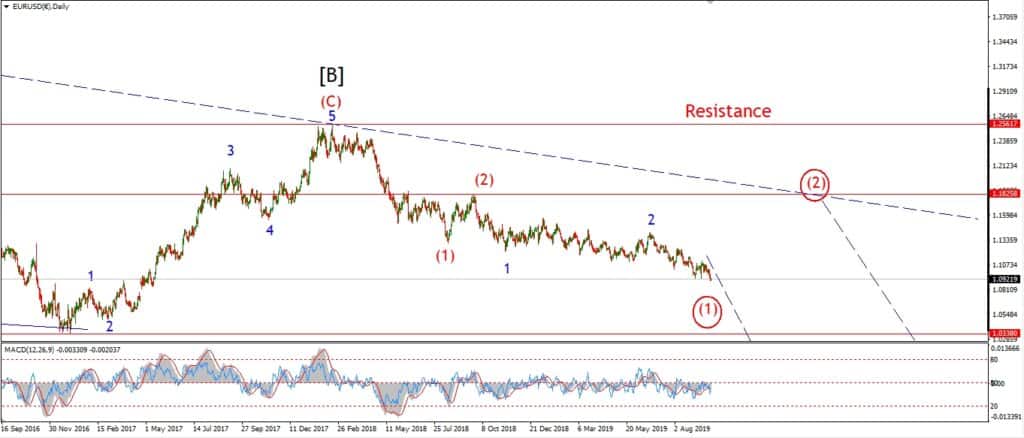
EURUSD daily.
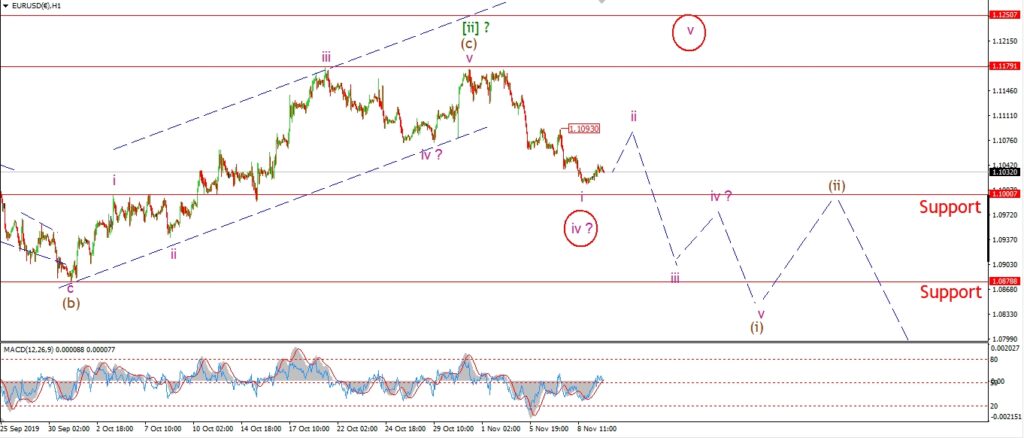
EURUSD has had a weak day with a very slight upside bias.
The price has failed so far to break initial support at 1.1007.
This is the high of the previous wave ‘i’,
if that level is broken it will rule out the current alternate count
and then we can concentrate fully on the downside in the short term.
I have shown the recent low as a possible wave ‘i’ of (i).
This will allow for a little more upside in wave ‘ii’ of (i) tomorrow.
The interim high at 1.1093 is a good target level for wave ‘ii’ to complete at.
Tomorrow;
Watch for wave ‘ii’ to trace out a three wave correction over the coming days.
If the price breaks 1.1000 tomorrow in a sharp spike lower,
that will indicate wave ‘iii’ of (i) has begun.
GBPUSD
GBPUSD 1hr.
GBPUSD 4hr.
GBPUSD daily.
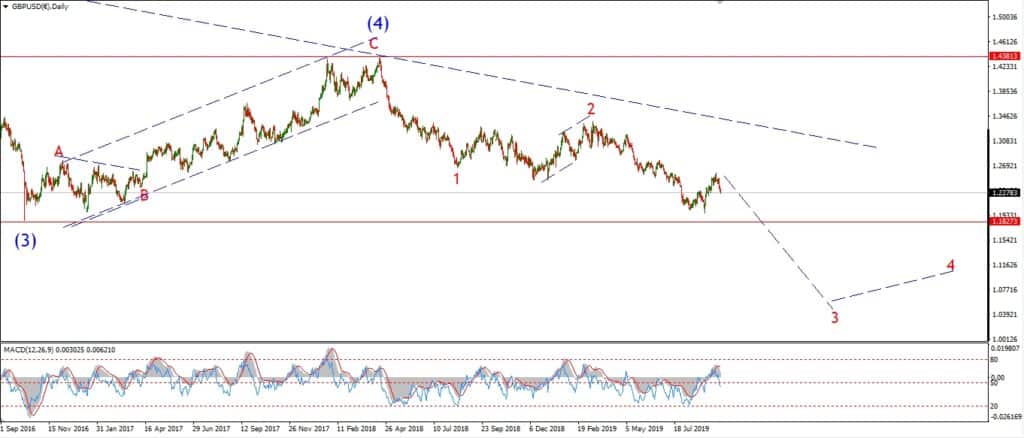
I have changed the larger degree wave count for cable today,
this is a result of the continued sideways action over the last few weeks.
So I will start on the daily chart and work inwards.
We are still working with a second wave correction in cable as you can see.
The action in wave ‘2’ red is labelled as an expanded flat correction.
With wave [c] of ‘2’ yet to complete.
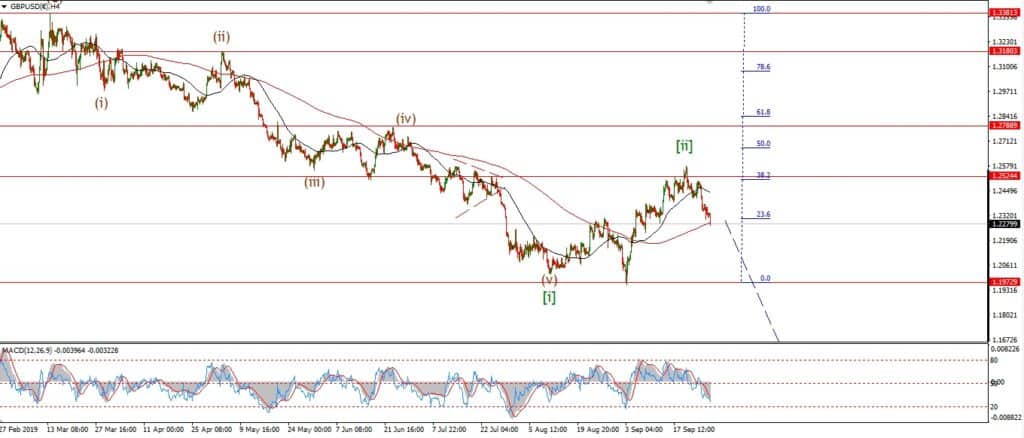
The 4hr chart shows the correction 3,3,5 internal pattern of wave ‘2’,
with wave (iv) of [c] now complete at the recent low.
Wave (v) of [c] should continue higher over the coming week.
The wave [a] high is the initial target for wave [c] to complete at 1.3380.
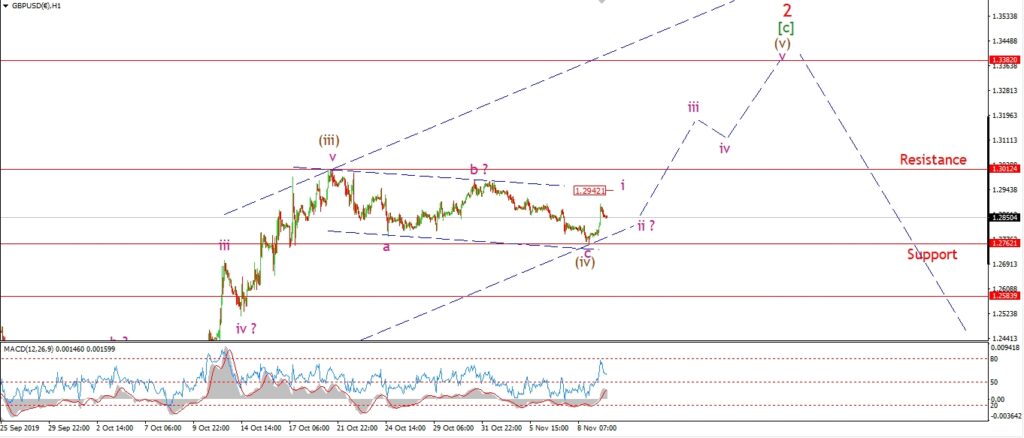
The hourly chart shows wave (v) now underway.
Todays spike out of a three wave correction in wave (iv) is labelled as wave ‘i’ of (v).
Wave ‘ii’ should create a higher low above 1.2762 at wave (iv).
This new wave count will be confirmed with a break above 1.3012.
Tomorrow;
Watch for wave ‘i’ to complete at about 1.2940 or so.
Wave ‘ii’ should find support in the rising trend channel.
And wave ‘iii’ of (v) should break 1.3012.
1.2762 should hold as wave (v) completes.
USDJPY.
USDJPY 1hr.
USDJPY 1hr.
USDJPY daily.
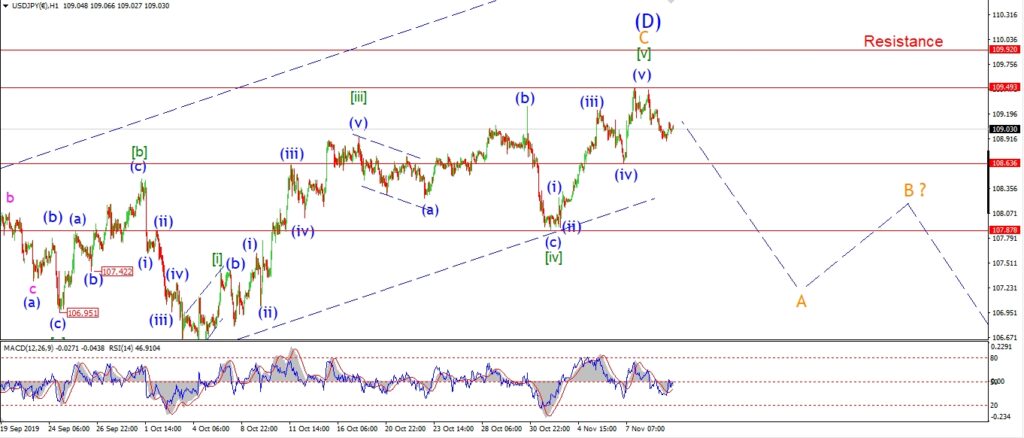
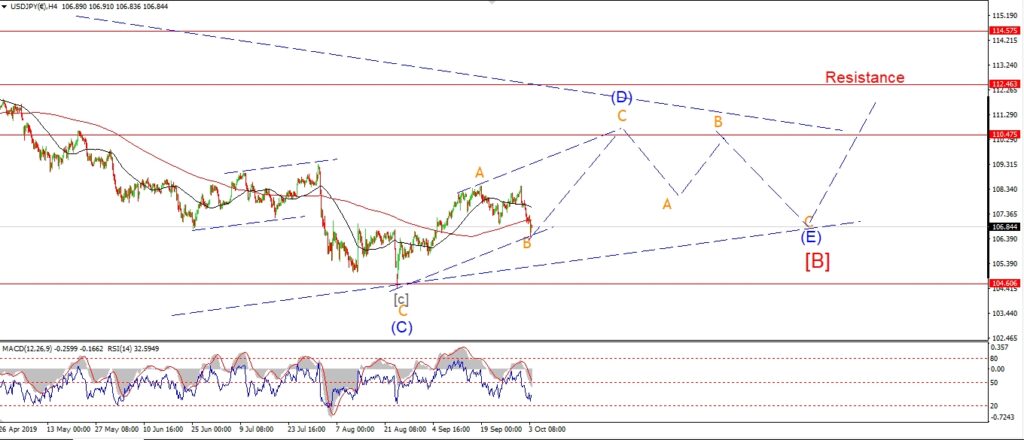
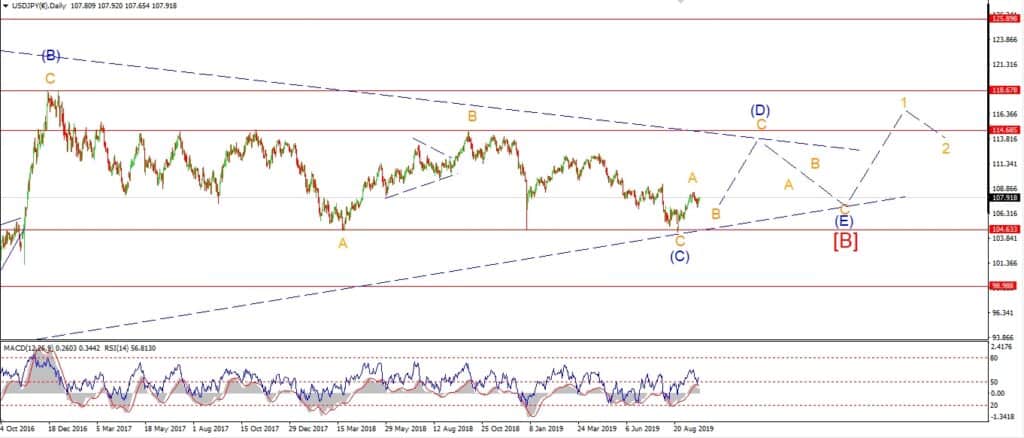
We are entering a turning point now in USDJPY,
but it is hard to call the top in place just yet.
The price is dropping today off the recent high at 109.49.
This suggests wave ‘A’ has begun,
but the pattern off that high is unclear at the moment.
I will have to wait and let the action develop over the coming days
in order to get a better picture of wave ‘A’.
A break of 108.63 will signal that the top is forming,
but we will have to see a break of 107.89 to confirm that wave ‘A’ of (E) has begun.
Wave ‘A’ of (E) can trace out either a three wave or five wave decline from here.
So the pattern could get pretty complicated over the coming week or so.
Tomorrow;
Watch for 109.49 to hold and wave ‘A’ to continue lower.
A break of 108.63 will favor the bearish outlook in wave (E).
DOW JONES.
DOW 1hr.
DOW 4hr
DOW daily.
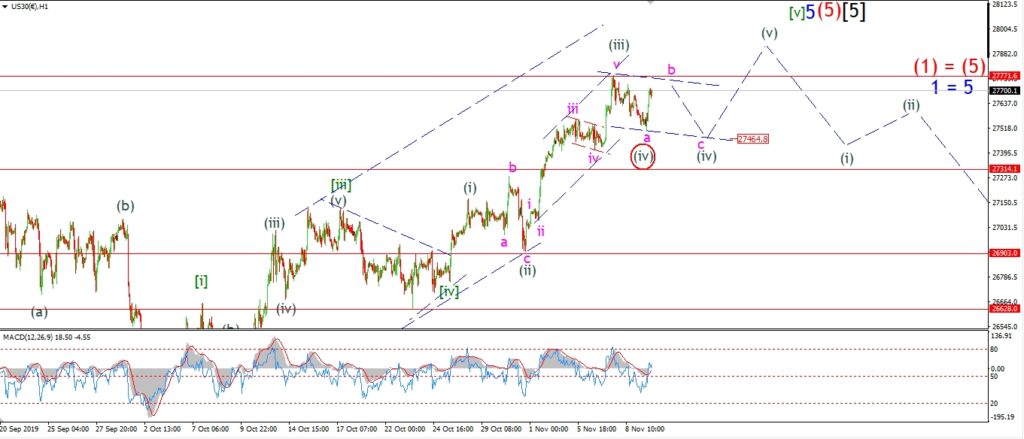
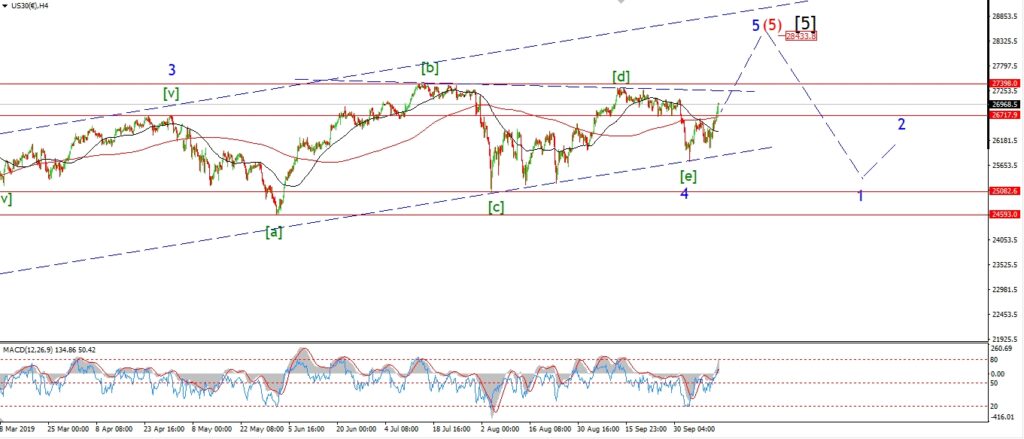
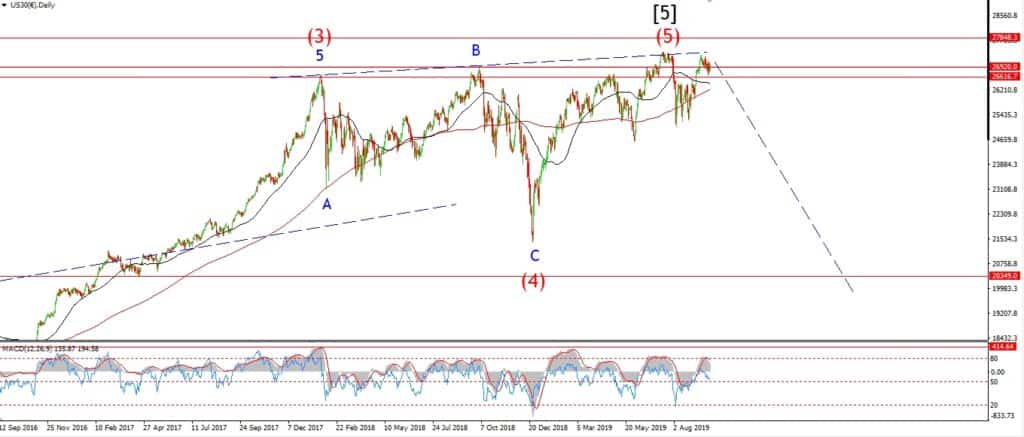
The recent action looks more corrective at the moment.
With that in mind,
I have labelled the high at 27770 as wave (iii) of [v].
The decline last Friday is labelled wave ‘a’ of (iv),
and todays spike higher could be part of wave ‘b’ of (iv).
This interpretation will allow for another high to form in wave (v) of [v] over the coming week.
But there is not much room to the upside left,
no matter what way I view the short term action.
The short term alternate count views todays lows as the end of wave (iv),
so if we see a break of 27770 tomorrow,
that will favor the idea that wave (v) has begun already.
Tomorrow;
Watch for wave ‘b’ of (iv) to complete below 27770.
Wave ‘c’ of (iv) should fall back to about 27450 by mid week.
GOLD
GOLD 1hr.
GOLD 4hr.
GOLD daily.
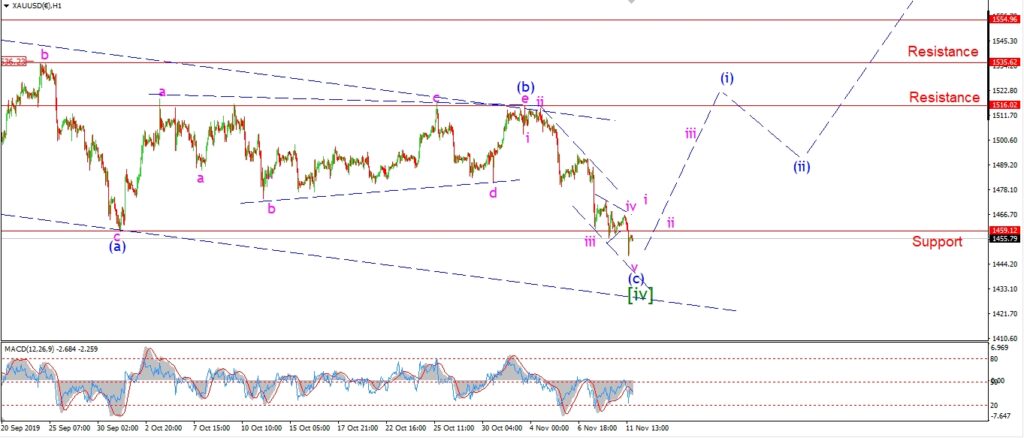
There is a deeper level of bearishness on display now
than the wave [ii] lows of last April when the price stood at 1266 and change.
The market was completing a large correction back then also,
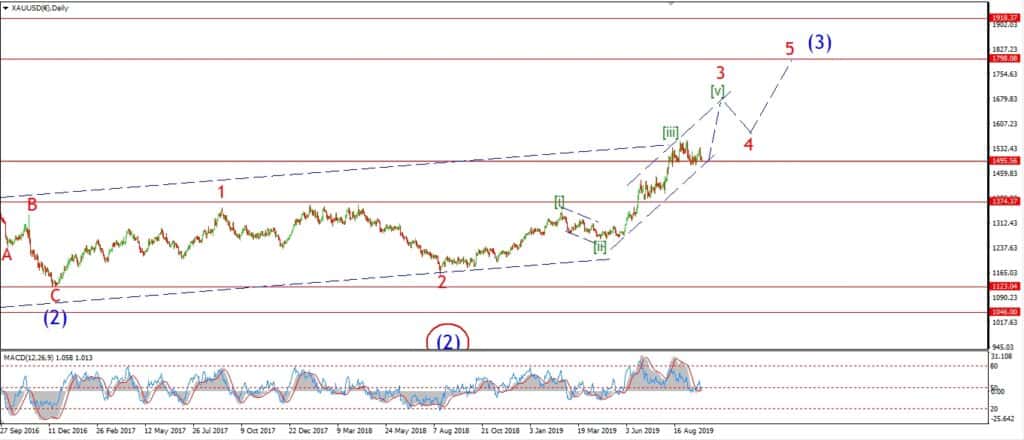
and then went on to rally 25% over the summer months as wave [iii] took over.
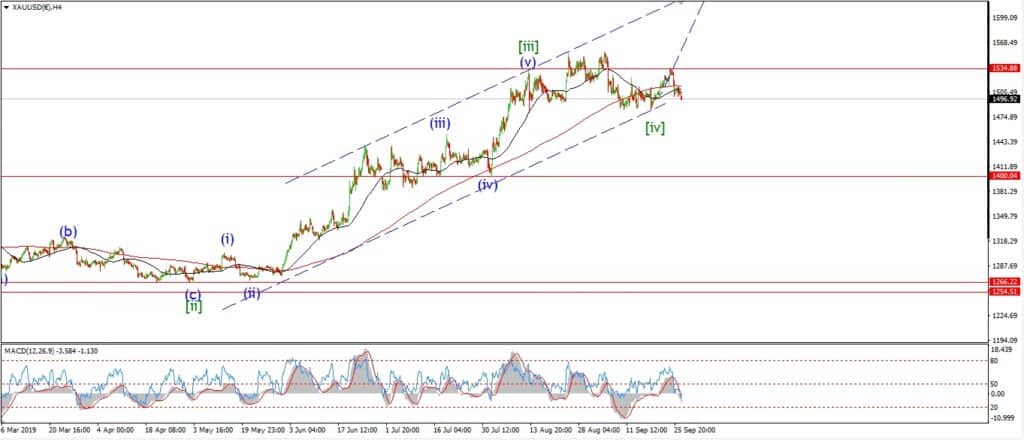
The current lows are also best viewed as a three wave correction in wave [iv].
With a rally in wave [v] of ‘3’ to come over the next few months.
The hourly chart shows a pattern that is damn near complete.
Wave (c) of [iv] spiked to a slight new low this afternoon.
And that new low may have completed a five wave decline in wave (c) itself.
Both the daily and 4hr charts show a bullish divergence in momentum.
The 4hr chart has a tripple bottom in place in both RSI and MACD.
At this point,
I think we have a reasonably bullish picture in place.
This is as good a setup as at the low of wave [ii] back in April.
And wave [v] of ‘3’ should get underway any day now.
Tomorrow;
Lets see if wee get a low forming over the coming days.
Watch for a five wave move back above support in wave ‘i’ of (i) by end of the week.
If we hit 1500 again over the next 10 days or so,
that should confirm the turn higher has begun.
CRUDE OIL.
CRUDE OIL 1hr.
CRUDE OIL 4hr.
CRUDE OIL daily.
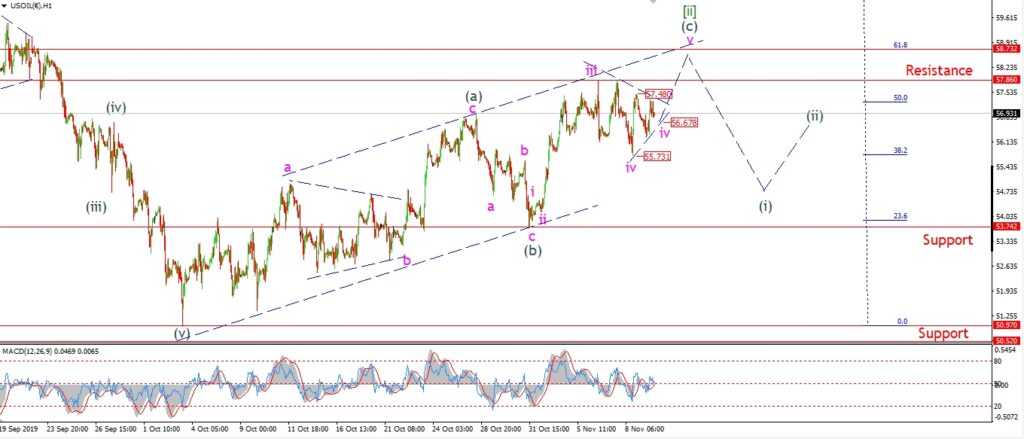
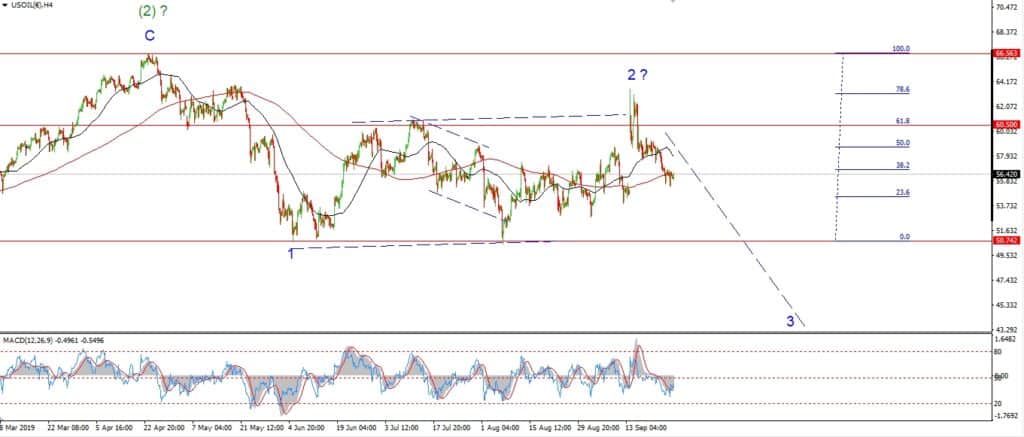
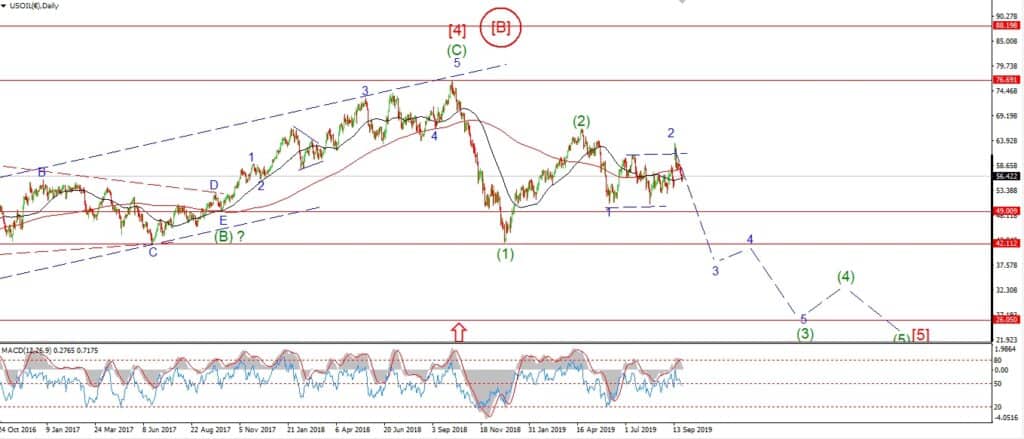
Crude is down off last weeks highs so far.
But the short term pattern is still more corrective in nature at the moment.
I have changed the short term count to explore the possibilities from here.
The current action can be viewed as wave ‘iv’ of (c).
And wave ‘iv’ can be interpreted in two ways.
The price range has contracted over the last week,
so this could be a triangle wave ‘iv’,
with wave ‘v’ left to pop to a final high for wave (c) later this week.
Or,
the initial three wave decline off the high could be a completed wave ‘iv’,
with wave ‘v’ now underway off 55.73.
The most likely target for wave ‘v’ at this point lies at the 62% retracement level of 58.70.
Tomorrow;
Watch for wave ‘iv’ to complete as a triangle at 56.67.
A break of 57.50 will signal wave ‘v’ has begun.
S&P 500.
S&P 500 1hr
S&P 500 4hr
S&P 500 daily.
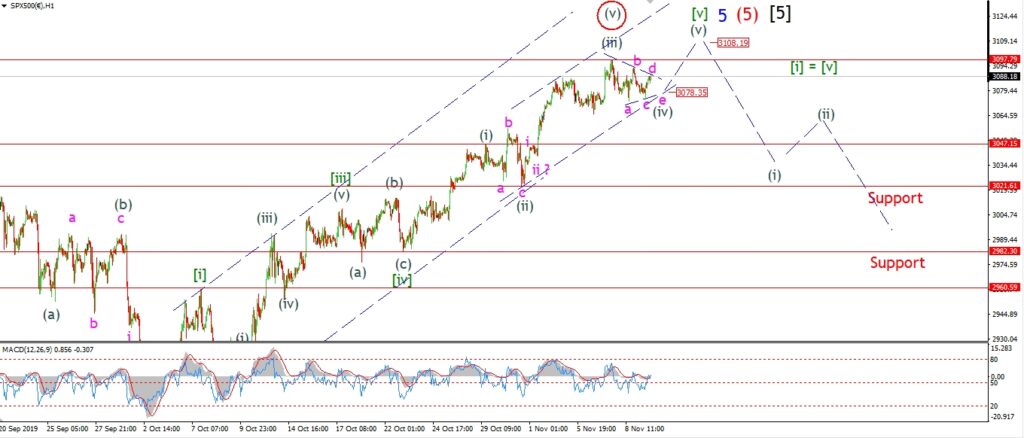
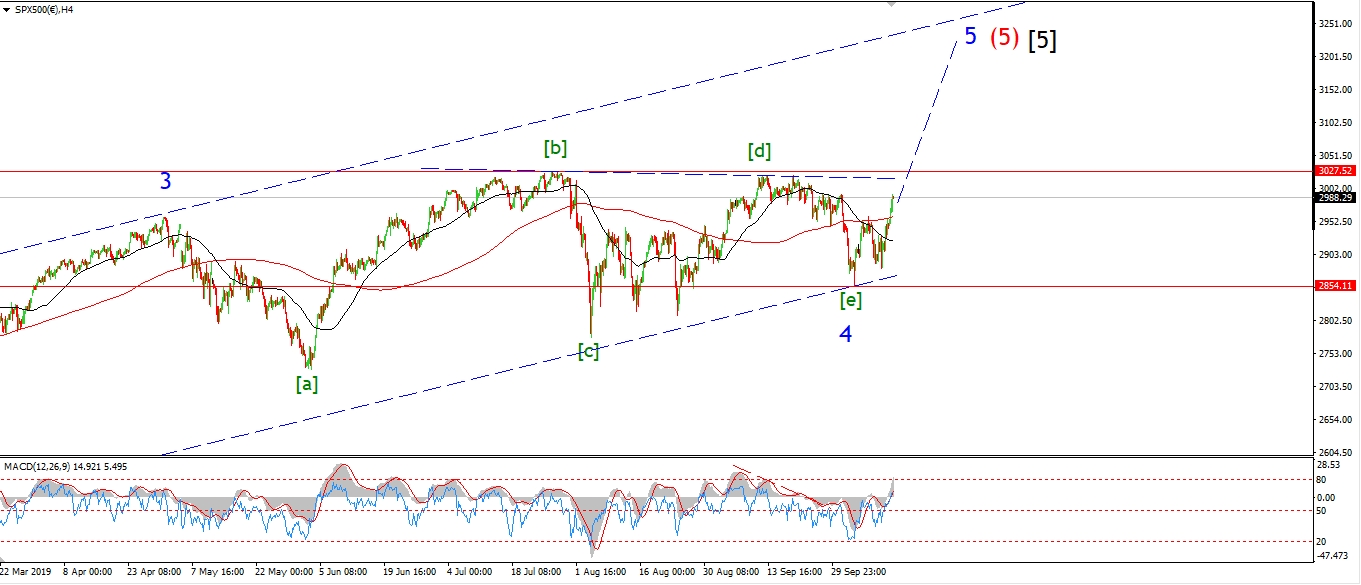
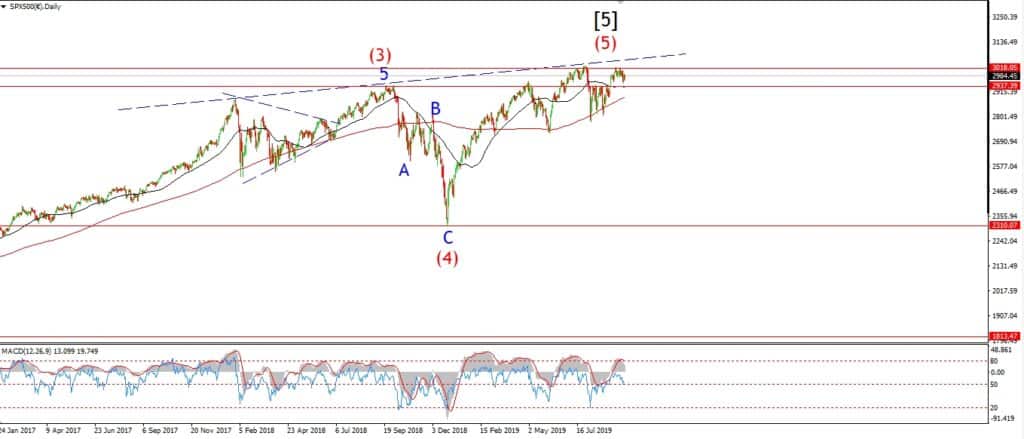
The action today in the S&P continues the sideways path we have seen over the last week.
This action suggests a corrective pattern is forming,
possibly a triangle as shown.
So I have altered the labeling this evening to account for that action.
If this is a triangle correction in wave (iv).
Then we will see a final move higher in wave (v) this week once the consolidation is complete.
The triangle is in its last leg down now,
wave ‘e’ of (iv) should drop into the lower trend line at about 3078 tomorrow to complete the triangle.
Then I will look for another run higher in wave (v) of [v] towards the end of the week.
You can view the recent high as the final high for wave (v),
this is shown as the alternate count now.
The key level on the bearish side of the equation lies at 3047.
If that level is broken it will signal wave (i) down has begun.
Tomorrow;
Watch for wave (iv) to complete as a triangle at about 3078.
A break above 3097 again will signal wave (v) has begun.
SILVER.
SILVER 1hr
SILVER 4hr.
SILVER daily.
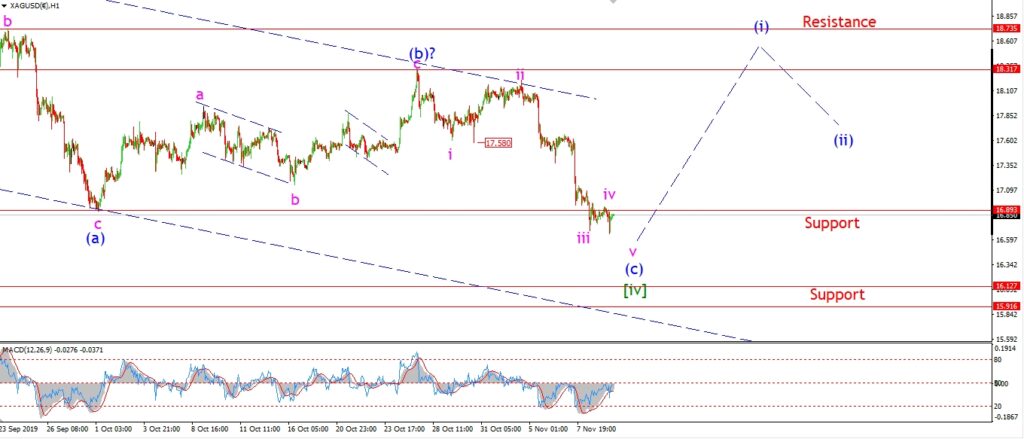
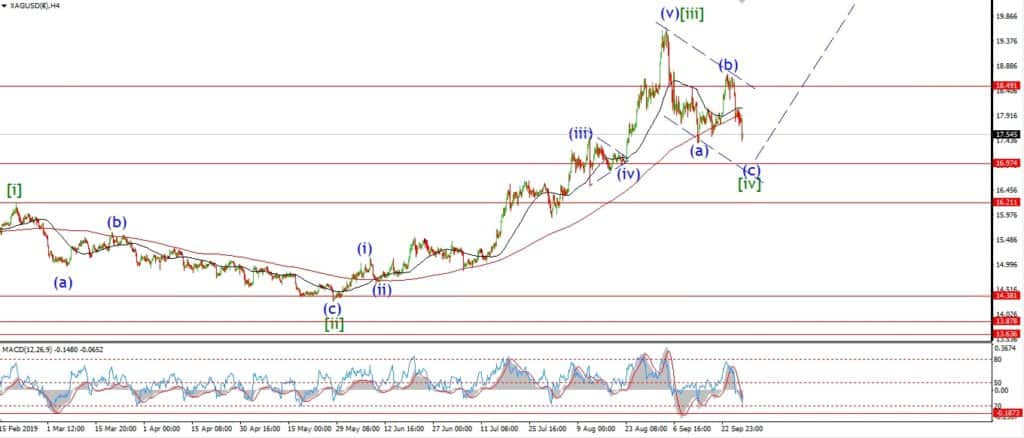
Silver is showing a very mature corrective pattern also this evening.
Wave (c) down is almost complete now.
Wave (c) has met the minimum target at 16.89,
and the internal pattern is wave (c) can be labelled as a complete five wave decline.
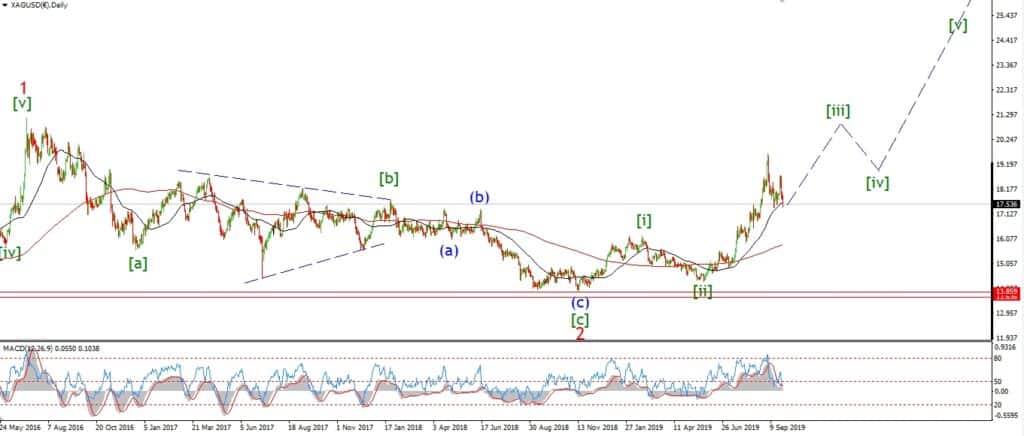
We are very near the end of this correction in wave [iv] now.
wave [v] up should carry price back above 21.20 again by the end of the year.
Again,
I think the most likely outcome from this point is a sharp rally,
and not a drop to oblivion as the general consensus seems to think.
Tomorrow;
watch for wave ‘v’ of (c) to complete soon.
A drop into 15.50 will be enough to call a low for wave (c).
I think we will see the first leg up in wave (i) of [v] begin this week.
U.S 10YR.
US 10YR 1hr.
US 10YR 4hr.
US 10YR daily.
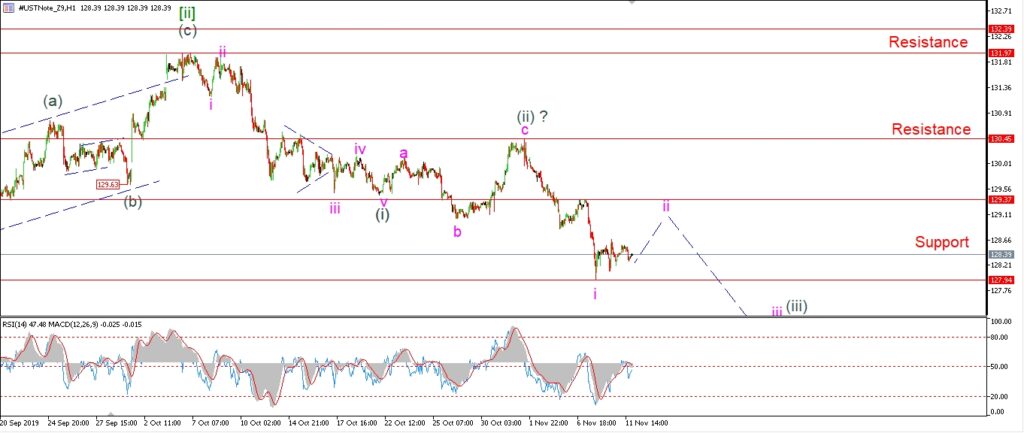
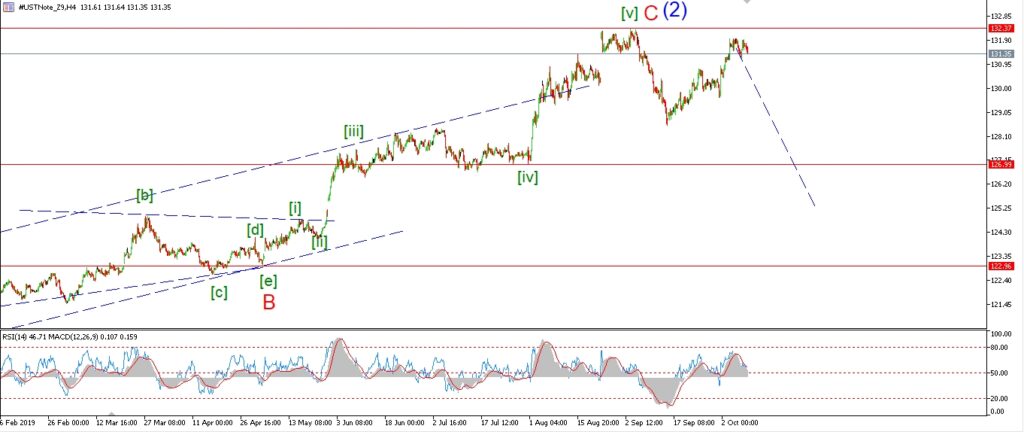
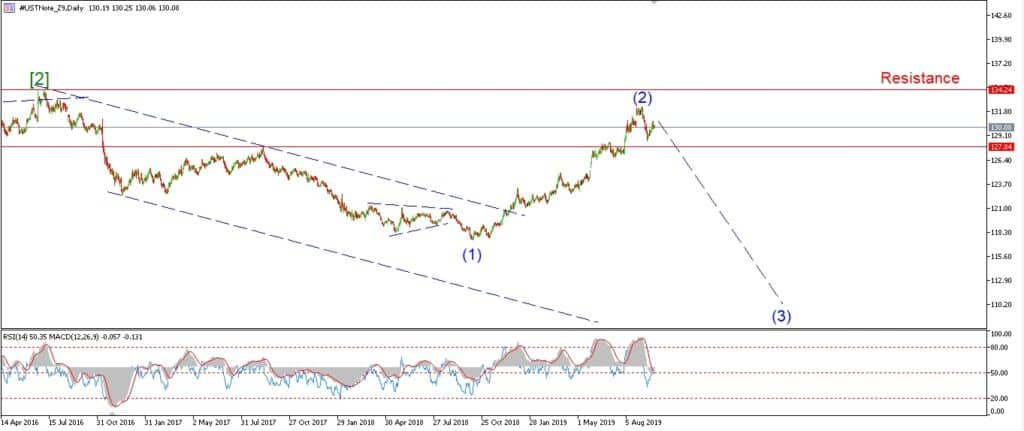
The sharp move lower into 127.90 last week
can be viewed as the full wave ‘i’ down as shown on the short term chart.
This count will allow for a further three wave correction higher in wave ‘ii’ of (iii) to develop this week.
Wave ‘ii’ should find resistance at 129.38,
at the previous shoulder created last week.
If this action occurs,
then we could have a lower degree bearish signal in place by Friday.
And wave ‘iii’ down will begin over the coming week.
Tomorrow;
Watch for wave ‘ii’ to hold above 127.94 for the next session at least.
Wave ‘ii’ should complete below 129.37.